Compendium January 2021 - K+S Group

Page created by Franklin Owen
 
CONTINUE READING
Compendium January 2021 - K+S Group
K+S Group

Compendium
January 2021
Compendium January 2021 - K+S Group
K+S Group
Compendium January 2021 - K+S Group
K+S at a Glance
                                                     K+S Group financials 2019
     Revenues                                   EBITDA                         EBITDA-Margin              Earnings after taxes, adj.
    € 4.07 billion                            € 640 million                         16%                         € 78 million

                               OU Europe+: Revenues: € 2.54 billion; EBITDA: € 437 million; Margin: 17%

                                   OU Americas: € 1.53 billion; EBITDA: € 230 million; Margin: 15%

                                                         Customer Segments

    Agriculture                               Industry                         Consumers                      Communities

                                                                                                            18%
    42%       Revenues                                 Revenues          12%           Revenues                         Revenues
              € 1.72 billion            28%            € 1.15 billion                  € 0.48 billion                   € 0.72 billion

                                                                                                            15%
              EBITDA                                   EBITDA                         EBITDA                            EBITDA
    46%                                                                  9%
              € 295 million                            € 218 million                  € 60 million                      € 94 million
                                        34%
              Margin 17%                               Margin 19%                     Margin 12%                        Margin 13%

3
Compendium January 2021 - K+S Group
Global Presence¹
1 Revenues   by regions 2019

                                                                    40 %

                                                             36 %

                                                                    3%
                                                                           9%

                                                      13 %

    Employees by region 2019

       69%        22 %
                               5%     3%       1%

     Germany     North      South    Rest of   Asia
                America    America   Europe

4
Compendium January 2021 - K+S Group
Customer Segments - Overview

                                                                   2019        EBITDA
                                                               Revenue share   margin

                 • Potassium chloride (MOP)
                 • Fertilizer specialities                         ~42%         17%
   Agriculture

                 • Chemical               • Oil and Gas
                 • Pharma                 • Water Softening                    19%
                                                                   ~28%
                 • Food                   • other Industrial
     Industry    • Animal Nutrition         products

                 • Culinary
                 • Water and Pool                                  ~12%         12%
                 • Ice Melt
   Consumers

                 • De-icing bulk
                 • De-icing packaged
                                                                   ~18%         13%
   Communities
Compendium January 2021 - K+S Group
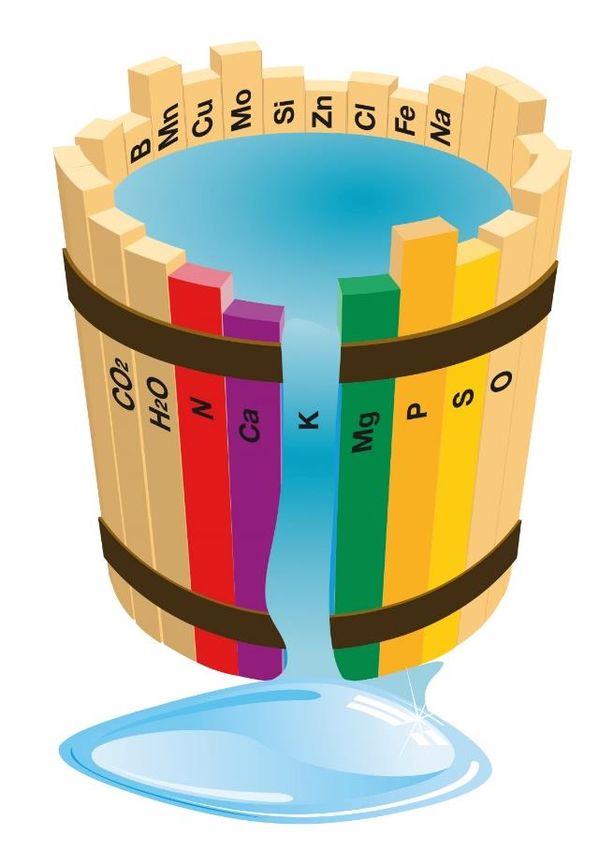
Adding value along our entire supply chain

        Exploration
        Our potash and salt deposits came into being millions of years ago. They are either our property or we have corresponding rights or
        approvals that allow the extraction or solution mining of the raw material reserves.

        Mining
        We extract raw materials in conventional mining above and below ground as well as through solution mining. We also use the power of
        the sun and extract salt by evaporating sea water or saline water.

        Production
        The refining of raw materials is one of our core competencies. Above ground, the crude salt is processed in complex, multi-phase,
        mechanical or physical processes, with the natural properties of the mineral remaining unchanged.

        Logistics
        The long-term securing of freight capacity is of strategic importance to us. A large part of our international transport volume is forwarded
        by service providers with which we maintain long-standing partnerships.

        Sales/Marketing
        The K+S Group wants to be its customers’ preferred partner in the market. High product quality and reliability are decisive preconditions
        for this. K+S offers a comprehensive range of goods and services for agriculture, industry and private consumers.

        Application
        Our customers apply our products, use our raw materials in their processes or process them in their products. We make extensive
        product information available and advise our customers on the application of our products.

6
Compendium January 2021 - K+S Group
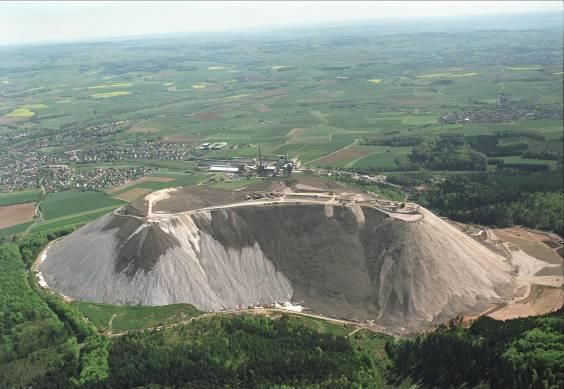
Board of Executive Directors

       Dr. Burkhard Lohr   Thorsten Boeckers   Mark Roberts
       CEO                 CFO                 Member of the Board

7
Compendium January 2021 - K+S Group
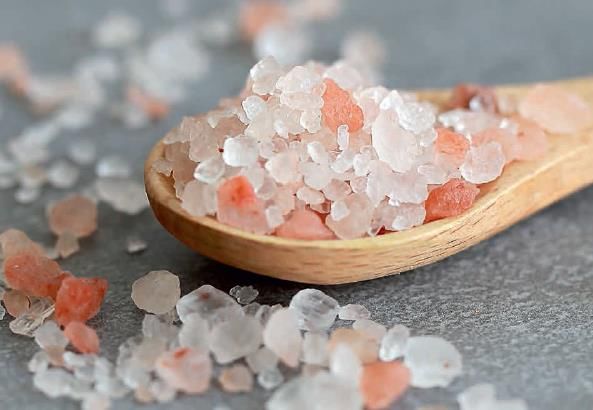
Active Portfolio Management
                     Salt             Salt         Salt          Salt                         Salt              Salt

                  Acquisition      Foundation   Acquisition   Acquisition                  Acquisition     Acquisition

                                                                                                            Ashburton
                                                                                                              Salt

      1999             2000            2002         2006          2009          2011           2012          2016          2017

     Fertilizer       Fertilizer                                Fertilizer    Fertilizer      Fertilizer    Fertilizer    Fertilizer

    Acquisition     Acquisition                               Acquisition    Divestment      Divestment    Acquisition   Acquisition

8
Compendium January 2021 - K+S Group
Signing achieved for complete OU Americas sale

                         Key data of the
                         signed agreement:
                         •   Buyer:               Stone Canyon Industries
         POINTE-CLAIRE                            Holdings LLC, Mark Demetree and
                                                  affiliates

      CHICAGO            •   Gross proceeds:      USD 3.2 bn

     1                   •   EV/EBITDA:           12.5x 2019 EBITDA of USD 257m
                         •   Closing timeline:    Summer 2021
                         •   Exp. net proceeds:   €~2.5bn after tax (currency risk fully
         SANTIAGO DE
                                                  hedged)
         CHILE

9
Compendium January 2021 - K+S Group
Key Financials

Revenues    (€ billion)                        EBITDA (€ million)

     4,2                                        1.058
                                 4,0    4,1
            3,5           3,6

                                                                           606     640
                                                                    577
                                                          519

     2015   2016          2017   2018   2019    2015      2016      2017   2018   2019

EBITDA-Margin         (%)                      FCF vs Net Financial Debt/EBITDA
                                                                    5.2
                                                                                   4.9
                                                          4.6
                                                                            5.3
      25                                                                          +140
                                                                           -206
                                                                    -390
             15             16    15     16     -636
                                                         -777
                                                 1.3

     2015   2016          2017   2018   2019    2015     2016       2017   2018   2019

10
Important megatrends
        8.5bn                              0,2
     Global population in       Average global warming (ºC)
            2030                                                           ▪   Arable land shrinking

                                                                           ▪   Yield needs to be improved

        Today: 7.3bn                    Per decade                         ▪   Higher efficiency of fertilization and
                                                                               irrigation needed

              Implications for K+S                                         ▪   Plants have to be more stress resistent

                                                                           ▪   Infrastructure needs to be
                            40 %                       5.4bn                   improved → focus on renewable
                   of population suffer from         people belonging to       energy
                   water shortage by 2030            the middle class by
                                                            2030
                                                                           ▪   Growing population, especially in Asia,
                                                                               needs more salt for various purposes

                       70% of water used                 2015: 3.0bn
                         for agriculture

11
Growth Areas
                                K+S Growth Landscape

     Geo-expansion                            Fertilizer                           Industry

         Africa                        Increase of fertilizer specialties   Expand Pharma & Food portfolio

         Asia                          Ramp of low-cost commodities             Chemical applications

                  Growth areas and ideas cover core and adjacent businesses

12
K+S sustainability KPIs and targets 2030

Environment
                                                                                                 Target by 2030 at
               Goal       KPI                                               2018       2019
                                                                                                     the latest
                          Deep-well injection of saline waste water in
                                                                             1.2        1.5       0   starting January 2022
                          Germany (m³ p.a.)
               Water
                          Additional reduction of saline process water                            -500,000       excluding
                                                                           +400,000   +800,000   reduction by KCF facility and
                          from potash production in Germany (m³ p.a.)*                               end of production SI
 Environment

                          Amount of residues used for other purposes
                          than tailings or increased amount of raw           1.0        1.5                   3
               Waste      material yield (million tons p.a.)
                          Additional area of tailings piles covered (ha)     5.9        8.7                 155
                          Carbon footprint for power consumed (kg
                                                                            -1.5 %     -1.7 %              -20 %
               Energy &   CO2/MWh)
               Climate    Specific greenhouse gas emissions (CO2) in
                                                                            -2.0 %    -11.1 %              -10 %
                          logistics

 * LTI relevant

13
K+S sustainability KPIs and targets 2030
People
                                                                                                 Target by 2030 at
                    Goal            KPI                                       2018      2019
                                                                                                     the latest
                    Health &                                                                              0
                                    Lost time incident rate (LTIR)*            8.5       10.3
                    Safety                                                                           Vision 2030
  People

                    Diversity &     Employees’ favorable perception of        68 %
                                                                                        54 %          >90 %
                    Inclusion       inclusive work environment                 (2015)

                    Human           Sites covered by a human rights due
                                                                               0%        8%           100 %
                    Rights          diligence process

Business Ethics
                                    Critical suppliers aligned with the K+S                           100 %
 Business Ethics

                    Sustainable                                               14.7 %    23.3 %
                                    Group Supplier Code of Conduct (SCoC)*                          by end of 2025
                    Supply
                    Chains                                                                           > 90 %
                                    Spend coverage of the K+S Group SCoC*     29.4 %    44.9 %
                                                                                                    by end of 2025

                    Compliance      All employees reached by communication
                                                                                                        100
                    & Anti-         measures and trained appropriately in      70.9      100
                                                                                                    by end of 2019
                    Corruption      compliance matters (percent)

14
                   * LTI relevant
Customer Segments
▪   Agriculture

▪   Industry

▪   Consumers

▪   Communities
Long-term dynamics in demand for our Customer Segments
Customer Segments
                       Demand driven by …

                            Arable land shrinking

                               Water shortage

                         Increasing standard of living

     Agriculture                                             Consumer
                             Population growth

                    Economic growth and industrialization

                                Urbanization

                         Winter weather conditions

                         Infrastructure development
       Industry                                             Communities
                               Global warming

16
Customer Segment Agriculture at a Glance
Customer Segment Agriculture
                                                                                                  Characteristics
                                                                             ▪ Close proximity to our main customers provide logistical
                            in € million           9M/2019        9M/2020      advantages
                            Revenues                1,326.1        1,231.3   ▪ Shipments to overseas customers at competitive costs
                                                                               from Hamburg harbor
                            Sales volume (mt)           4.77         5.31
                                                                             ▪ Strong and long-standing customer relationships
                            EBITDA                    265.6         147.8    ▪ Broad specialty portfolio provides flexibility and stability,
                                                                               partly following different trends and seasons

              Revenue Split by Region 2019 (%)                                Revenue Split by Products 2019 (%)
                         Others
                              5                                                 Fertilizer specialities
                                                                                                     42
                   Asia
                    19
                                                Europe
                                                50
                                                thereof Germany                                     1               2        Potassium chloride
                                                12                                                                           58

                South
               America
                    22
                     North America
                                 4
17
Why use fertilizers?
Customer Segment Agriculture

                                                                        ▪ For plants to thrive they need sunlight, water and
                                                                          minerals
                                                                        ▪ There are only few soils on earth which have a
                                                                          sufficient content and availability of plant nutrients
                                                                          to achieve high yields over a longer period without
                                                                          fertilization
                                                                        ▪ Potash is an indispensable supplement to the
                                                                          natural nutrient content of soils
                                                                        ▪ Compensation of the nutrient losses by harvest
                                                                          and other losses is necessary
     “The growth and yield of plants are limited by the
           nutrient which is in shortest supply”1

         1 Justus   von Liebig, 'The Natural Laws of Husbandry', 1863
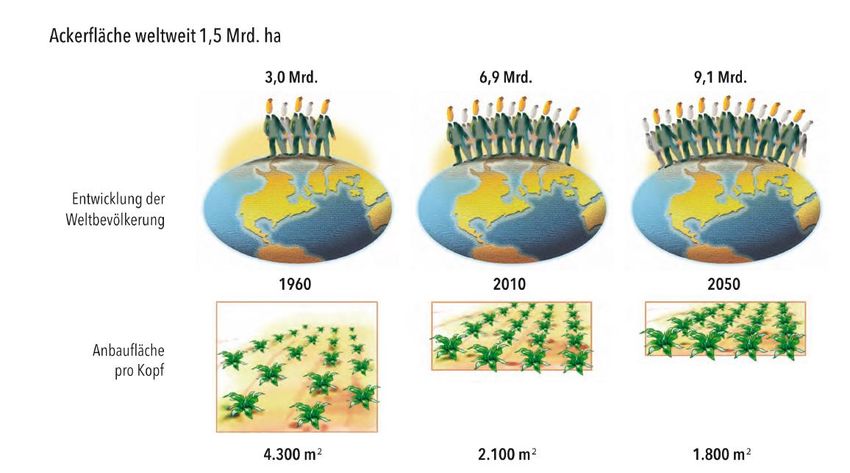
18
Long-term key drivers for our fertilizer business
Customer Segment Agriculture

                             Less arable land – but more protein consumption per capita
                      Jahr     1960             2010                 2050

     Global population
                                                                                    Each year an additional 80 million
       development                                                                  people need to be fed – this equals to
                                                6.9 billion          9.7 billion
                                                                                    the population of Germany
                               3.0 billion

        Arable land                                                                 Available arable land per capita will
         per capita
                                                                                    decrease at the same time
                              4.300 m²         2.100 m²             1.800 m1
                                                                                    By 2050 an expanded world population
          Protein
         per capita
                                                                                    will be consuming two thirds more
                                                                                    animal protein than it does today
                              60 g/ day       80 g/ day           130 g/ day1

        In 2050, only roughly a quarter of a soccer field will be available to feed one person year round - 80 percent of future
                                   growth in crop production will come from yield advancements
                                                 driven by balanced use of fertilizers
 Sources: UN, World Population Prospects, 2012 Revision, UNDP, 2013; FAOStat 2014
 1 FAO 2014 - forecasts based on the expected increase in animal protein

19
What makes us different?
Customer Segment Agriculture

     Fertilizer Specialties    ▪ mainly used for special applications
                                 (e.g. chloride-sensitive crops)

                               ▪ products containing a broad range of nutrients
                                 (e.g. potash, magnesium, sulphur)

                               ▪ premium products used for high-value crops

     Potassium Chloride        ▪ can be applied universally to all crops not sensitive
           (MOP)                 to chloride and to all types of soil

                               ▪ standard product used for commodity crops

20
Potash Price Development
Customer Segment Agriculture
                                        Pricing (Source: FMB Argus Potash)

 USD/t                                                                                                 EUR/t
 400                                                                                                     500
                        Potassium
                         Sulfate
 375                      (SOP)
                         Europe                                                                          450
 350
                                                                                                         400
 325      Potassium
           Chloride
         (MOP) Brazil                                       Potassium
 300                                                                                                     350
                                                             Chloride
                                                          (MOP) Europe
 275
                                                                                                         300
 250
                                                                                                         250
 225

 200                                                                                                     200

              MOP gran. Brazil USD/t, cfr (left scale)           SOP Europe EUR/t, cfr (right scale)

              MOP gran. Europe EUR/t, cfr (right scale)

21
World potash production and sales by region
Customer Segment Agriculture                                              24

 in million tonnes
                                 22
                                                                                            32
                                                                               5
                                                        6    6
                                      10

                                                                                       17

                                               14
                                                                     1
                                           2

      Basis: year 2019                     World potash production:            World potash sales volume:
      Incl. sulphate of potash
      and low-grade potash
                                           2019: 71.0 million tonnes           2019: 68.5 million tonnes
      Sources: IFA, K+S                    2018:    72.3 million tonnes        2018:   71.8 million tonnes

22
Supplier structure on the world potash market
Customer Segment Agriculture

                   29%                                                                                                                                   World Potash Sales Volumes:
                                                                                                                                                         2019:   68.5 million tonnes
                                                                                                                                                         2018:   71.8 million tonnes

                                       16%
                                                      15%                                                                                                     15 %

                                                                         9%
                                                                                           7%
                                                                                                           4%                                                              3%
                                                                                                                             2%             1%

              Canpotex                 BPC         Uralkali             K+S               ICL            APC               EuroChem        SQM               China       Other
                   Nutrien        Belaruskali                                             DSW         Participation                     Participation           > 20      Intrepid
       (prev. Potash Corp. & Agrium)                                                      CPL          of Nutrien                        of Nutrien          producers      Vale
                                                                                                    (prev. Potash Corp.)              (prev. Potash Corp.)
                   Mosaic                                                              Iberpotash                                                                        Compass
                                                                                                                                                                         Usbekistan
                                                                                                                                                                            Laos
Basis: 2019
Source: IFA, K+S              Incl. potassium sulphate and potash grades with lower K2O content

23
World potash supply and demand
                    Customer Segment Agriculture

                    Production is driven by demand despite continuous excess capacity

                    100.000

                     90.000
                                                                                                                                                      Capacity by producer

                     80.000

                                                                                                                                                      Others         Canpotex
                     70.000
                                                                                                                                                                       32%
1,000 t (product)

                                                                                                                                                       25%
                     60.000

                     50.000                                                                                                                     ICL
                                                                                                                                                6%
                     40.000
                                                                                                                                                  K+S
                     30.000                                                                                                                       9%                 Uralkali
                                                                                                                                                       Belaruskali    14%
                     20.000
                                                                                                                                                          14%
                     10.000

                          0
                              '60    '65       '70       '75      '80       '85       '90      '95       '00       '05         '10   '15   Basis: year 2019

                                              Technically available capacity            Sales volumes              Production

                    Source: IFA, K+S; incl. sulphate of potash and low grade potash of about 5 million tonnes eff. (product)

                    24
Customer Segment Agriculture
Between plan and Reality: Potash projects announced since 2006 (Greenfield)

                                      Projects with a high
     Announced projects or in early
                                      probability of         Projects in ramp-up
     development phases
                                      implementation by      phase
                                      2025

                                                                     2
               160                             6

25
Customer Segment Agriculture
What is behind the greatly feared oversupply?
thousand tons
140.000
                                                                                                                                      ▪ Only 5 years ago, the technically
120.000                                                                                                                                 available capacity in 2025 was
                                                                                                                                        estimated to be 12 million tons higher
100.000                                                                                                                                 than today
                                                                                                              +3% (Scenario 2)
 80.000                                                                                                       +1.3% (IFA prognosis)   ▪ Even now, greenfield projects by potash
                                                                                                              +/-0% (Scenario 1)        newcomers will still account for a
 60.000                                                                                                                                 significant share of the total until 2025

 40.000                                                                                                                               ▪ Non-utilization of capacity by existing
                                                                                                                                        producers not taken into account
 20.000
                                                                                                                                      ▪ Global capacity load should level off at
         0                                                                                                                              the long-term average by 2025
             '05                   '10                     '15                    '20v                    '25v

                   Technical available capacity of
                                                                             World sales volume
                    existing producers
                                                                             revised forecast
                   Greenfield potash newcomers
                                                                             technical available capacity from 2015
      Source: IFA, K+S; including potassium sulfate and potash varieties with a lower K2O content of about 5 million tonnes eff.
 26
Potash use by crop in selected countries
Customer Segment Agriculture
100%
                                                                                                            Wheat 2%         Corn 8%
                              Wheat 16%                                                     Corn 16%
                                                                                                                            Rice 11%            Soybean
                                                                                                            Rice 2%                               2%
                                Corn 13%
                                                           Rice 1%
                             Oilseeds 11%
                                                                                         Soybean 40%
                            Sugar crops 5%

                      Fruits & Vegetables 12%                                                                              Oilpalm 62%

                                                                                       Sugar crops 18%

                           Other crops 42%
                                                                                   Fruits & Vegetables 7%
                                                                                                                         Sugar crops 5%
                                                                                                                       Fruits & Vegetables 7%
                                                                                        Other crops 15%
                                                                                                                         Other crops 7%
     0%
                                 EU-28                                                        Brazil                       Indonesia
Source: IFA , Estimates of Fertilizer Use by Crop in Selected Countries in 2010-2010/11, published 2013

27
Farmer profitability of US corn
Customer Segment Agriculture

          in % of revenues
100%
                                                                     ▪ Expenditure on potash products only amounting
                         17%                                           to approx. 4% of the total costs
                                   thereof costs for potash: ~ 4 %
                         16%
                                                                     ▪ Earnings prospects should give the agricultural
                                                                       industry sufficient incentive to increase yield per
                                                  Operating profit     hectare by using plant nutrients
                                                  Fertilizer costs
                                                  Other costs
                         67%

     0%
                     Wheat (USA)

28
World potash sales volume by region
Customer Segment Agriculture

million tons                                     2011           2012           2013           2014    2015   2016   2017   2018   2019

 Western Europe                                    5.9            5.6            5.8            6.2    6.0    5.9    6.2    6.2    6.0
 Central Europe / FSU                              4.4            5.1            4.7            4.4    4.8    4.8    5.2    5.4    5.5
 Africa                                            0.7            0.7            0.8            1.0    1.0    1.1    1.4    1.6    1.4
 North America                                   10.2             9.1            9.7           11.8    9.5   10.9   11.2   11.5    9.8
 Latin America                                   10.5           10.5           11.0            11.9   11.5   12.2   12.7   13.7   13.5
 Asia                                            28.0           23.4           26.2           32.4    32.3   30.1   32.5   32.6   31.6
       - thereof China                           12.7           12.0           13.8           16.7    18.5   16.2   16.2   16.3   17.8
       - thereof India                             5.0            2.8            3.5            4.5    4.1    4.0    5.0    4.5    4.5
 Oceania                                           0.5            0.4            0.5            0.7    0.6    0.6    0.7    0.8    0.7
 World total                                     60.2           54.8           58.7           68.4    65.7   65.6   69.9   71.8   68.5

Incl. potassium sulphate and potash grades with lower K2O content of around 5 million tonnes eff.
Sources: IFA, K+S

29
Customer Segment Industry at a Glance
Customer Segment Industry
                                                                                                  Characteristics
                              in € million          9M/2019        9M/2020   ▪ Emerging markets: Footprint in rising markets such as
                                                                                 Asia as industrialization drives demand for electrolysis
                              Revenues                 857.2         845.4   ▪   Electrolysis and specialties: High product quality,
                              Sales volume (mt)             7.57      7.38       service and customer proximity
                              EBITDA                   159.1         216.7
                                                                             ▪   Pharma: High quality standards, certificates,
                                                                                 innovation and superior customer services as well as
                                                                                 reliability
              Revenue Split by Region 2019 (%)                                    Revenue Split by Products 2019 (%)
                                Asia Others
                                   2 1                                                                    Chemical
              South America                                                              Pharma                23
                         11                                                                   5

                                                  Europe
                                                                                                                                 Animal Nutrition
                                                  50
                                                                                      Food                                       5
                                                  thereof
                                                  Germany                               22        1                  2           Oil and Gas
                                                  25                                                                             1

                                                                             Water Softening
              North America                                                                4                             Other
                         35                                                                                              30
                                                                                          Complementary
                                                                                                    10
30
Broad variety of application areas (1)
Customer Segment Industry

         Chemical           Food processing             Pharma             Oil and Gas

 ▪ Main applications:   Main applications:     Main applications:     Main applications:
 ▪ Chemical industry    ▪ Food processing      ▪ Infusion, dialysis   ▪ Drilling fluidas
 ▪ Chlor-Alkali           industry               solutions
   processes (→ PVC)    ▪ Baking industry      ▪ Pharmaceuticals
 ▪ Polycarbonates ,     ▪ Condiment and
   MDI (Isocyanat)        preservative agent
   (→ plastics,         ▪ Preserving of fish
   synthetic resin)
 ▪ Synthetic Soda Ash
   (→ glass)

31
Broad variety of application areas (2)
Customer Segment Industry

     Animal Nutrition       Water softening       Complementary              Other

 Main applications:     Main applications:    Main services:         Main services:
 ▪ Animal feed          ▪ Water softening     ▪ Waste Management     ▪ Dyeing works
 ▪ Lickstones           ▪ Water treatment       and Recycling        ▪ Leather treatment
                                              ▪ Granulation of
                                                Catsan® for Mars
                                                GmbH
                                              ▪ K+S Transport GmbH
                                              ▪ CFK (Trading)

32
Customer Segment Consumer at a Glance
Customer Segment Consumer
                                                                                              Characteristics
                                                                            ▪ Our brands – and particularly MORTON SALT – can
                            in € million              9M/2019     9M/2020
                                                                              be found on shelves around the world. Every child
                            Revenues                      228.0     373.8     in the United States knows our “Umbrella Girl”.
                            Sales volume (mt)              1.31      1.26
                            EBITDA                         39.3      58.2

             Revenue Split by Region 2019 (%)                                 Revenue Split by Products 2019 (%)
                                                                                                         Other
                     South America     Europe                                                 Ice Melt   2
                                 5     14    thereof Germany                                  8
                                             4
                                                                                                         2
                                                                                                                   Culinary 38

                                                                             Water and Pool                  1
            North America                                                               52
                       81

33
Customer Segment Communities at a Glance
Customer Segment Communities
                                                                                                 Characteristics
                             in € million            9M/2019       9M/2020   ▪ Unrivalled global production and logistics network:
                                                                               Geographical diversification of production facilities
                             Revenues                      515.8     298.0     within a region and across continents
                             Sales volume (mt)              9.24      5.09
                             EBITDA                         55.4       9.2
                                                                             ▪ Diverse regional portfolio of de-icing salt markets

               Revenue Split by Region 2019 (%)                                 Revenue Split by Products 2019 (%)
                                        Europe
                                        18       thereof                                                        De-icing bulk
                                                 Germany                                                                  98
                                                 9

                                                                             De-icing packaged         1
             North America                                                                   2
                        82
                                                                                                                            1 Commodities

34
Presence in attractive de-icing markets
Customer Segment Communities
                            Eastern Canada
                                                                             Scandinavia

                                                      US East Coast    Central Europe
                                    Great Lakes

                           Indicative regional strength of winter

     2012/13   2013/14   2014/15            2015/16          2016/17        2017/18        2018/19   2019/20

                                   Europe             North America

35
Main salt suppliers worldwide
Customer Segments Industry, Consumers, Communities
Capacity in million tonnes (crystallized salt and salt in brine; excl. captive use)
                                                                                                                                     21
                                                ~4
                                                            15
                                                14                        14

                                                                                                                                     China National Salt
                                                                                                9   8
                                                                                                                7

                                                                                                    Artyomsol
                                                                                       5

                                                            Compass
                                                                                                                        5
                                                                                                                               4

                                                                                    American
                                                                                    Rock Salt

                                                                                                                Akzo

                                                                                                                       Süd-
                                                                          Cargill

                                                                                                                       salz

                                                                                                                              Sal-
                                                                                                                              ins
                                                     8
                                                     ESSA

                                                                                                                                                           10
                                                                      9

                                                                                                                                                           Dampier
                                                                                                                                                                       4

                                                                                                                                                                     Mitsui
Source: Roskill 2016, K+S

36
1
    Development of salt consumption and production
    Customer Segment Industry, Consumers, Commodities
    in million tonnes

                Consumption                                              Production
                   CAGR: 2,0 %                     CAGR                  CAGR: 2,1 %          CAGR

                                         295                                           295
                        268                         1,2 %                    264              2,5 %

      220                                                      217
     Other                                          3,3 %      Other                          4,0 %
         Asia                                                   Asia

                                                    1,0 %
    Europe                                                     Europe                         1,3 %

    North-                                                     North-
                                                    1,5 %      America                        0,4 %
    America

     2000               2009             2015                   2000         2009      2015
1   excl. captive use; Source: K+S, Roskill 2011, 2014, 2016

    37
Production
Potash sites in Germany
Potash Production
                                                          Potash mining in the Werra-Fulda region

                           6    4

          Kassel
                          1
                            2
                          3
                      5
                                                                               Potash seam
                                                                                  Hesse

       Share of annual production capacity (in %)
1.   Wintershall
2.   Unterbreizbach         Integrated Werra Plant ~ 50
3.   Hattorf
4.   Zielitz                                       ~ 25
5.   Neuhof-Ellers                                 ~ 20                        Potash seam
6.   Bergmannssegen-Hugo                             ~5                         Thuringia
     (production site only, no mining)

39
Underground mining production cycle
Potash Production

     1                          2                                 3                      4
                                                                                               Cleaning
          Blasting after        Muck pile load and dump                   Roof scaling
            shift end

     9                                                                                   5
                                                                                             Roof bolting
     Charging with explosives

     8                                            7                                      6
              Drilling                                    Face cleaning                      Auger drilling

40
Potash processing above ground
Potash Production

 Thermal                                                                                       Electrostatic
                                                  Flotation                                    separation
 dissolution
                                                                                               (ESTA®)

             heating                                            flotation                                     finely ground
     25 °C             110 °C                                   brine                                         crude salt
     mother brine                        finely                                       finely
                                      grosund                                       ground
     undissolved                    crude salt      flotation                    crude salt                          conditioning
         residue                                    agent
     + dissolved
             KCl                                                                                 triboelectric
                                     filtering      air                                          charging
                                                    bubbles                                                   -           +
                        95 °C
                       cooling
                                                                                                separation
      filtering                                                    filtering                    in a free
                                                                   and                          fall separator
                                                                   drying

     Potassium chloride         Residue (NaCl)         Residue         Potassium chloride            Residue       Potassium chloride
     (KCl)                        and Kieserite         (NaCl)         (KCl) or Kieserite            (NaCl)        (KCl) and Kieserite

41
Management of residues
Potash Production
▪      The mined rock salt only contains a limited share of usable material (max. 30%), therefore a residue accumulation is unavoidable.
▪      This challenge is shared among all potash producing companies in the world!
▪      The reutilization of residues is performed as effective as possible.
▪      The techniques and the technology of constructing tailings piles (heaps) are proved and tested.
▪      In total, 4 different ways of disposing solid and liquid residues are used world wide:

              Tailings piles                   Underground disposal                        River injection*                     Deep well injection
                                                                                                                           (for K+S in the Hessian-Thuringian
Ø share of residue disposed via this way of disposing in the Hessian-Thuringian potash district:                            potash district until the year 2021)

                  ~80%                                    ~9%                                    ~8%                                      ~3%

▪      These ways of disposal – depending on the corresponding site – are used also in combination. They currently
       represent the best available technique.
*    With low river water levels in the Werra, there are possibilities for K+S in the Hessian-Thuringian potash district to temporarily store liquid residues
     in water basins or suitable mine spaces on site or temporary ways of disposal by flooding decommissioned mines or gas caverns in Lower Saxony or
     Saxony-Anhalt.

42
Current environmental investments create long-term
planning security
     Tailings pile extensions

                                  Hattorf     •   Completed by end of 2022 / beginning of 2023
                                              •   Next permit and significant investments in
                                Wintershall       tailings pile extensions will not be necessary
                                                  again until the end of the 2020s
                                  Zielitz

         Liquid residues
                                              •   Deep-well Injection ends 2021
                                              •   As of 2022: permanent storage underground (subject
                                                  to approval)
                                              •   As of 2028: higher utilization of storage underground
                                  Werra           with additional processing of saline waters
                                              •   Discharge Werra: as of 2028: only tailings pile waters
                                                  with lower concentration

43
Development Saline Wastewater River Werra
Potash Production
          20
                                         Utlization/Avoidance
     million cbm                      (CapEx: almost € 500 million)

                          6.0

                                            4.0

                                                               3.0                                    5.5
                                                                                  1.5            million cbm
                                                                                                                                   Tailings pile waters
                                                                                                                       4.0
                                                                                                                                   Process waters
                                                                                                                       1.5
Saline Waste-water     from 1998:      until 2012: K+S until 2015: ESTA 1-       until 2018:      avg. saline     Disposal until    Disposal as of
       1997           Underground        package of     facility, cold preli-   kainite crys-   wastewater from       2027              2028
                       disposal in        measures      minary decomposi- tallization and            2018
                     Unterbreizbach     (Optimization   tion and high con- flotation facility;
                                        of production     sistency facility,    advantage:
                                        and manufac-    kainite crystalliza- additional product
                                      turing processes)   tion and MgCl2
                                                               facilitiy
With low Werra river flows:
On-site:
    • Temporary storage possibility of up to 1.0 million cbm (basins and temporary storage underground)
Off-site:
    • Flooding of decommissioned mines or gas caverns for their restoration
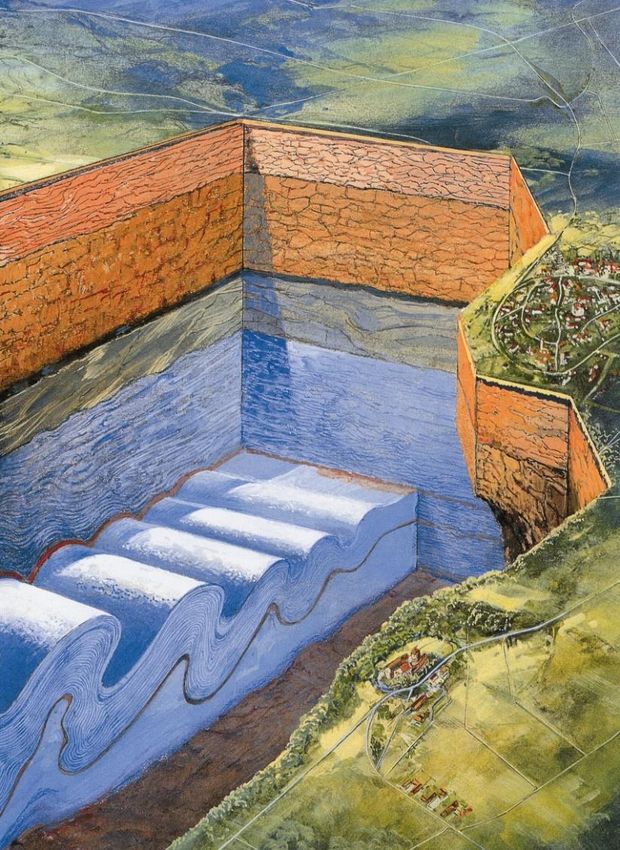
44
Bethune – Solution mining (example: primary mining)
Potash Production

                                                                         Mining technique        Solution mining

                                                                      Reserves / Resources       160 / 982 million t KCl product

                                                                              Depth              1,500 meters

                                                                            Thickness            33 meters
      Patience Lake
                                                                        K2O / KCl content        18% / 29%
      Belle Plaine

                                                                         Environmental           approved for up to
      Esterhazy
                                                                        impact statement         4 million t KCl/a

▪ In solution mining, freshwater is brought into solvent (salt) rock through a drill hole, therefore creating chambers, or caverns, filled with a
     water-salt solution. In a subsequent step, the saturated brine is brought to the surface through an additional pipeline.

▪ During the primary mining process, the cavern expands to create an ideal form for commencing secondary mining (see next page).

45
Bethune – Primary versus Secondary Mining
Potash Production
           Secondary Mining [NaCl brine mining / crystallisation pond]

                                                         Operates at 50% lower
                                                         production costs than
                                                            Primary Mining

▪    Secondary mining exclusively uses a NaCl-saturated brine in order to dissolve selectively KCl from the
     existing caverns.
▪    Advantages (in comparison to primary mining):
       ▪   lower energy intensity (e.g. injection brine is heated via waste heat from evaporators and KCl is
           crystalized in the cooling pond via natural cooling)
       ▪   substantially more efficient with the use of water
       ▪   reduces salt to tailings up to 30 %

46
Bethune – strengthening our global presence
Potash Production

                                         ▪ Expanding our current production portfolio in
                                            Germany with a North American production site
                                            → Second-source supplier
                                         ▪ Securing a good asset base with competitive
                                            production costs
     China
     India               North America   ▪ Sales and distribution through existing
     South East Asia                        distribution structures of the K+S Group
                                         ▪ Regional growth projects in China and
                                            Southeast Asia
                       South America
                                         ▪ Flexible multi-product strategy

47
Main production methods

        Rock salt                        Sea-/Solar salt                    Evaporated salt                           Brine

       Conventional                       Crystallization                   Recrystallization                      Controlled
         mining                          from sea water                     of purified brine                   borehole-brining

 ▪   Around 70 % of worldwide salt production (more than 290 million tonnes including brine) is obtained from rock salt mining and
     solution mining.
 ▪   Approximately 30 % of production is obtained from seawater and salt lakes.
 ▪   Salt is produced in almost every country in the world. Due to the high share of transportation costs in production costs, markets
     are generally regionally limited to the area around the production locations.
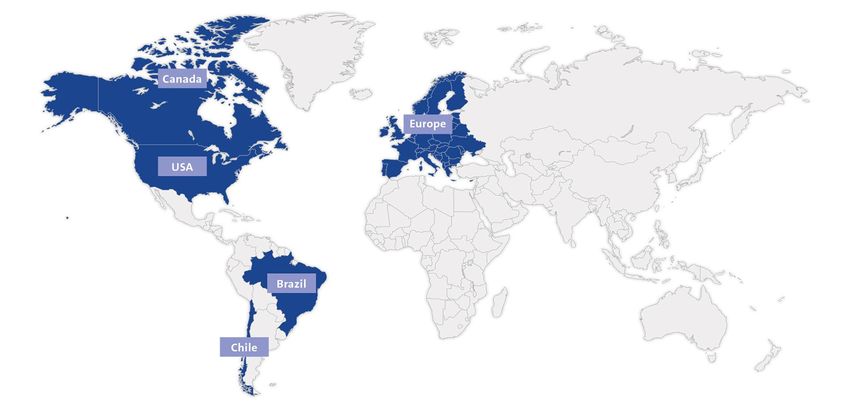
48
Unrivalled global production network

                              Canada

                                                             Europe

                               USA
                                                                                                    Potential
                                                                                                  Expansion into
                                                                                                   Asia-Pacific

                                               Brazil

                                       Chile

      Competitive edge:   ▪   More than 30 assets on 3 continents allow close proximity to customers in a
                              business that is highly freight-cost sensitive
      Unrivalled global   ▪   Broad range of products due to variety of production methods
     production network   ▪   Best in class supply chain assets and competence
                          ▪   Industry best-cost production in Chile

49
Our strengths
Salt Production

         Production   ▪ Geographical diversification of production facilities within a region and across
        network and     continents
         know-how     ▪ Access to a multitude of technical and geological experts within the K+S Group

                      ▪ Mixture of own cargo ships, medium-term sea freight contracts and
         Logistics      freight hedging
         network      ▪ Utilization of global logistics knowledge of K+S Group
                      ▪ Close supply chain cooperation for most efficient group-wide sourcing

         Product      ▪ Balanced and less cyclical product portfolio
         portfolio    ▪ Product innovations through access to group-wide R&D network

50
Financials
Debt profile (schuldschein and bonds)
                                                        Financing instruments
     €m                                 Amount outstanding            Coupon                  Maturity

     Schuldschein and loans             600

     Senior unsecured notes due 2021    500                           4.125%                  Dec-21

     Senior unsecured notes due 2022    500                           3.000%                  Jun-22

     Senior unsecured notes due 2023    625                           2.625%                  Apr-23

     Senior unsecured notes due 2024    600                           3.250%                  Jul-24

                                                        Debt maturity profile
                   835
                                                                                                         760
                                                                                665
                  335                            565                                                     160
                                                                                 40
                                                 65

                                                                                625                      600
                  500                            500

                  2021                           2022                           2023                     2024
                                              Bonds              Schuldschein          Loan

                               + Syndicated credit facility of up to € 800 million (available until 2024)
     + additional KfW-credit facility of up to € 350 million (available until August 2021, with option for extension)
                                   + commercial paper program as an additional source of liquidity
52
Cash flow and balance sheet

 € million                                H1/18   9M/18   FY/18   H1/19   9M/19   FY/19   H1/20   9M/20

 Operating cash flow                        292     276    309     518      510    640     323      328

 - Investing cash flow
                                           -198    -336    -515    -183    -306    -500    -157    -283
     (pre sale/ purchase of securities)

 Adjusted free cash flow                     94     -60    -206    335      204    140     166       45
 CapEx                                      154     278    443     166      310    493     207      343

 Net financial debt                       2,944   3,100   3,242   2,894   3,031   3,117   2,979   3,109

 Net financial debt/ EBITDA (LTM)           4.9     5.5     5.3     4.4     4.3     4.9     5.6     5.7

 Equity ratio                              43%     41%     41%     42%     43%     42%     43%     26%

53
Operating and free cash flow (adjusted)

 (€ million)

     756       719    669                                                640

                                      445
                                              307             309                328
                                                                         140
     49                                                                          45

                                                              -206
               -306
                                             -390

                      -636
                                      -777

     2013      2014   2015            2016   2017             2018       2019   9M/20

                      Operating Cash Flow    Free Cash Flow (adjusted)

54
Investor Relations
IR Contact Details
                                                                   K+S Aktiengesellschaft
                                                                   Bertha-von-Suttner-Str. 7
                                                                   34131 Kassel (Germany)

                                                                   e-mail:       investor-relations@k-plus-s.com
                                                                   homepage:     www.kpluss.com
                                                                   IR-website:   www.kpluss.com/ir
                                                                   Newsletter:   https://www.kpluss.com/newsletter
 Dirk Neumann
 Head of Investor Relations
 Phone:+49 561 / 9301-1460
 Fax: +49 561 / 9301-2425
 d.neumann@k-plus-s.com

 Julia Bock, CFA                     Janina Rochell
 Senior Investor Relations Manager   Investor Relations Manager
 Phone: +49 561 / 9301-1009          Phone: +49 561 / 9301-1403
 Fax:     +49 561 / 9301-2425        Fax:    +49 561 / 9301-2425
 julia.bock@k-plus-s.com             Janina.rochell@k-plus-s.com

5
K+S Share

     Key Data                                                  Quoted in the following indices
     WKN:                  KSAG88                              ▪   MDAX                     ▪   Prime Sector Chemicals
     ISIN:                 DE000KSAG888                        ▪   DJ EURO STOXX            ▪   Industry Group Chemicals / Commodity
                                                               ▪   HDAX                     ▪   DJ STOXX TMI
                           Registered shares of no-par
     Type of shares:                                           ▪   CDAX                     ▪   ECPI Ethical Index Global
                           value
                                                               ▪   Prime Allshare Index
     Total number of                                           ▪   Classic Allshare Index
                           191,400,000
     shares:
     Trading segment:      Prime Standard
                           Bloomberg SDF / Reuters
     Ticker symbols:
                           SDFG

     Covered by
     ▪   AlphaValue                               ▪   Deutsche Bank                         ▪   M.M. Warburg
     ▪   Baader Helvea Equity Research            ▪   DZ Bank AG                            ▪   MainFirst Bank AG
     ▪   Bankhaus Lampe                           ▪   Pareto Securities AS                  ▪   Morningstar
     ▪   Bank of America Merrill Lynch            ▪   Exane BNP Paribas                     ▪   Nord/LB
     ▪   BMO Capital Markets                      ▪   Independent Research                  ▪   Scotia Capital
     ▪   Citi Research                            ▪   J.P. Morgan Cazenove                  ▪   Société Générale
     ▪   Commerzbank                              ▪   Kepler Cheuvreux                      ▪   Solventis
     ▪   Credit Suisse                            ▪   LBBW                                  ▪   UBS

57
Shareholder structure

Retail shareholders 50%                Institutional shareholders 50%

                          Free float
                            100 %

As of 31.12.2019

58
K+S ADR Program

The K+S ADR Program offers North American investors the opportunity to take stock in K+S. Since the ADRs
are quoted in US dollars and dividends are also distributed in US dollars, this financial instrument closely
resembles an American share. Two ADRs represent one K+S ordinary share. The K+S ADRs are traded in the
United States under a level 1 ADR Program in the over-the-counter market (OTC).

     Trade on OTCQX                                                  Benefits to North American investors

      ▪   Symbol:           KPLUY                                     ▪   Clear and settle according to normal U.S.
      ▪   CUSIP:            48265W108                                     standards
      ▪   Ratio:            2 ADRs = 1 Share                          ▪   Stock quotes and dividend payments in
      ▪   Country:          Germany                                       U.S. dollars
      ▪   ISIN:             DE000KSAG888                              ▪   Can be purchased/sold in the same way
      ▪   Depositary:       The Bank of New York Mellon                   as other U.S. stocks via a U.S. broker
                                                                      ▪   Cost-effective means of international
                                                                          portfolio diversification

     Further information:
     www.kpluss.com/en-us/investor-relations/shares-bonds/key-data

59
K+S Bonds and Issuer Rating
                 Bond 12/2021        Bond 06/2022       Bond 04/2023      Bond 07/2024
WKN              A1Y CR5             A1P GZ8            A2E 4U9           A2N BE7

ISIN             XS0997941355        DE000A1PGZ82       XS1591416679      XS1854830889

Listing          Luxembourg SE       Luxembourg SE      Luxembourg SE     Luxembourg SE

Volume           EUR 500 million     EUR 500 million    EUR 625 million   EUR 600 million

Issue price      99.539%             99.422%            100.000%          100.000%
Coupon payment   4.125%              3.000%             2.625%            3.25%

Maturity         06.12.2021          20.06.2022         06.04.2023        18.07.2024

Face value       1,000 EUR           100,000 EUR        1,000 EUR         100,000 EUR

 Issuer Rating (S&P): B (outlook: negative), May 2020

60
Additional information

     Financial calendar                                                              2020/2021
     Annual Report 2020                                                            11 March 2021
     Quarterly Report; 31 March 2021                                                 11 May 2021
     Annual Shareholders’ Meeting                                                    12 May 2021
     Dividend payment (subject to resolution of the AGM)                             17 June 2021
     Half-yearly Financial Report, 30 June 2021                                    12 August 2021
     Quarterly Report, 30 September 2021                                        11 November 2021

     More content available online
     ▪ K+S Website: www.kpluss.com
     ▪ Annual reports: www.kpluss.com/ar2019
     ▪ Newsletter subscription: www.kpluss.com/en-us/investor-relations/service/newsletter
     ▪ Social Media:

61
Disclaimer
No reliance may be placed for any purpose whatsoever on the information or opinions contained in the Presentation or on its completeness, accuracy of
fairness. No representation or warranty, express or implied, is made or given by or on behalf of the Company or any of its respective directors, officers,
employees, agents or advisers as to the accuracy, completeness or fairness of the information or opinions contained in the Presentation and no
responsibility or liability is accepted by any of them for any such information or opinions. In particular, no representation or warranty, express or implied, is
given as to the achievement or reasonableness of, and no reliance should be placed on any projections, targets, ambitions, estimates or forecasts
contained in this Presentation and nothing in this Presentation is or should be relied on as a promise or representation as to the future.

This Presentation contains facts and forecasts that relate to the future development of the K+S Group and its companies. The forecasts are estimates
that we have made on the basis of all the information available to us at this moment in time. Should the assumptions underlying these forecasts prove not
to be correct or should certain risks – such as those referred to in the Annual Report – materialize, actual developments and events may deviate from
current expectations. Given these risks, uncertainties and other factors, recipients of this document are cautioned not to place undue reliance on these
forecasts.

This Presentation is subject to change. In particular, certain financial results presented herein are unaudited, and may still be undergoing review by the
Company’s accountants. The Company may not notify you of changes and disclaims any obligation to update or revise any statements, in particular
forward-looking statements, to reflect future events or developments, save for the making of such disclosures as are required by the provisions of statue.
Thus statements contained in this Presentation should not be unduly relied upon and past events or performance should not be taken as a guarantee or
indication of future events or performance.

This Presentation has been prepared for information purposes only. It does not constitute an offer, an invitation or a recommendation to purchase or sell
securities issued by K+S Aktiengesellschaft or any company of the K+S Group in any jurisdiction.

62
You can also read