Credit investor and analyst event March 5, 2019 - ILKKA SALONEN, CFO TAPIO SALO, SVP, TRIPLA PROJECT PIRJO AALTO, DEVELOPMENT DIRECTOR, TRIPLA ...
←
→
Page content transcription
If your browser does not render page correctly, please read the page content below
Credit investor and analyst event
          March 5, 2019
                  ILKKA SALONEN, CFO
            TAPIO SALO, SVP, TRIPLA PROJECT
  PIRJO AALTO, DEVELOPMENT DIRECTOR, TRIPLA PROJECT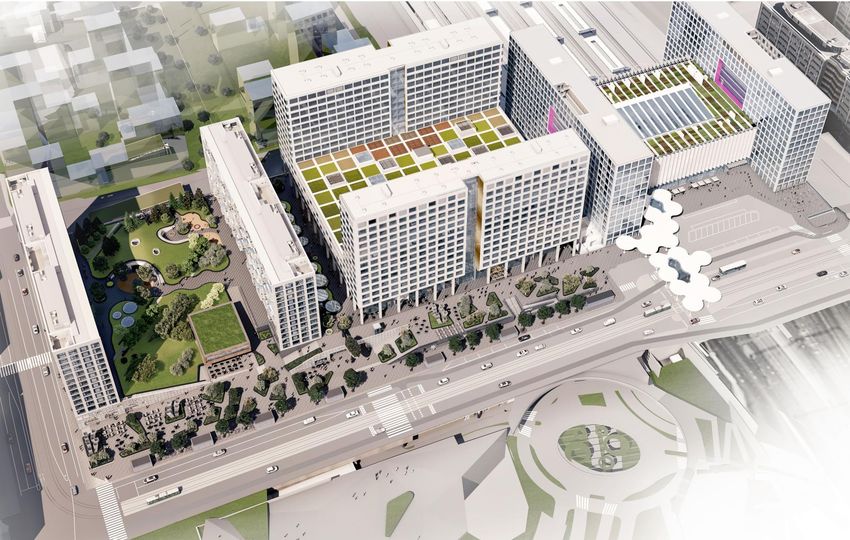
Contents

    Financial update
           1      YIT in a nutshell

           2      YIT’s strategy 2019-2021

           3      Group development in 2018 and
                  key ratios

           4      Outlook and guidance

    Case Tripla
    Mall of Tripla

    All figures are pro forma, please see slide 63 for additional
    information and figures in brackets refer to comparison
    period unless otherwise stated.

2                      Credit investor and analyst presentation March 2019
                                                                             TIETOTIE 6 DEVELOPMENT PROJECT
                                                                                              ESPOO, FINLAND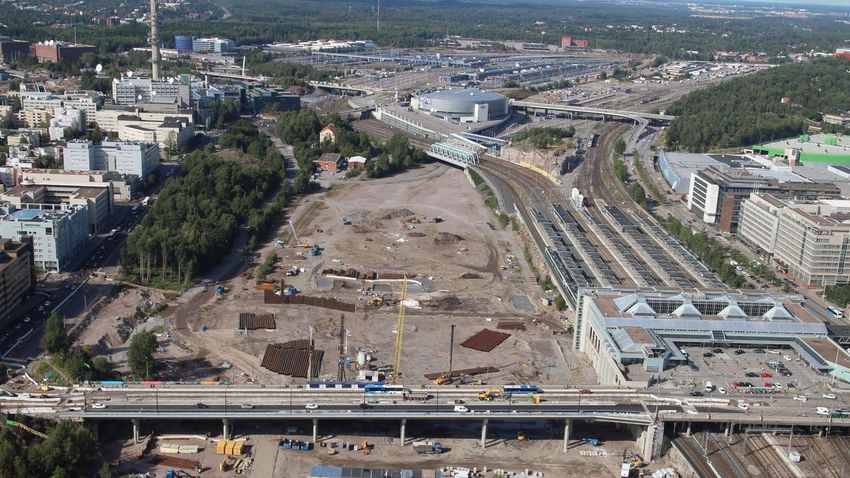
Financial update
  ILKKA SALONEN, CFO

1
YIT in a nutshell

4         Credit investor and analyst presentation March 2019     TRIPLA OFFICES
                                                                HELSINKI, FINLAND
YIT in brief
                                                                                                             Geographic revenue split, 2018
February 1, 2018                                               10,000                                                                                                                  FINLAND
                                                                                                                  Paving                                                               70% of total revenue
                                                                                                                                                                                       No of personnel: 5,034
YIT and Lemminkäinen merged                                     employees
                                                                                                                  Infrastructure projects

                                                                                                                  Business premises               SCANDINAVIA
                                                                                                                                                  9% of total revenue
        3.8 bn                                                         11                                         Partnership                     No of personnel: 757
                                                                                                                                                                                                          RUSSIA
                                                                                                                                                                                                          9% of total revenue
                                                                                                                  properties                                                                              No of personnel: 1,740
      EUR, pro forma                                       operating countries
     revenue for 2018                                                                                             Housing

ILLUSTRATIVE REVENUE PER BUSINESS AND SEGMENT IN 2018*, %                                                                                                                                  BALTIC COUNTRIES
                                                                                                                                             CEE COUNTRIES                                 8% of total revenue
                                                                                                                                             4% of total revenue
                                                              Paving                                                                                                                       No of personnel: 1,249
     Tender-                                                                                                                                 No of personnel: 290
      based                                                    19%                          Housing FIN &
                                 Urban
       27%                    development                                                       CEE
                                 49%                                                            30%

                                                  Infrastructure
                                                     projects
                                                       16%                                  Housing Russia
                                                                                                 7%
      Non-cyclical                                                 Business premises and
      businesses                                                   Partnership properties
         24%                                                               28%
                                                                                                              * Illustrative estimates do not take into account for example Group figures so the illustrative
 5                   Credit investor and analyst presentation March 2019                                      information should not be viewed as pro forma information.
We offer the whole package

                                                                                                                   INFRA-                                                                       PARTNERSHIP
       HOUSING FINLAND                        HOUSING                           BUSINESS
                                                                                                                   STRUCTURE                            PAVING                                   PROPERTIES
       AND CEE                                RUSSIA                            PREMISES
                                                                                                                   PROJECTS

     Revenue: 1.2 bn€                  Revenue: 300 M€                     Revenue: 1 bn€                   Revenue: 600 M€                       Revenue: 700 M€                       Equity investments/
     Adjusted operating                Adjusted operating                 Adjusted operating                Adjusted operating                    Adjusted operating                   commitments: 164 M€
       profit: 103 M€                    profit: -33 M€                      profit: 68 M€                     profit: -8 M€                         profit: 3 M€                       Adjusted operating
                                                                                                                                                                                           profit: 27 M€
      Development and                  Development and                   Tailored office, retail,             Transportation                    Paving, production of
        construction of                  construction of                 logistics, production,                infrastructure,                   mineral aggregates,
    apartments and entire            apartments and entire                  health and care               industrial construction,              stabilisation, crushing,                Financing and partial
      living areas, living             living areas, living              premises, renovation                water supply and                    water-proofing, road                  ownership of projects
          services, for                    services, for                        services                       power plants,                         maintenance                       together with partners
        consumers and                    consumers and                                                        excavation and
           investors                        investors                                                      reinforcement works                                                             Ownership of
                                                                                                                                                                                            project in:
    Mainly self-developed             Mainly self-developed              Self-developed and                      Contracting                           Contracting                      Business premises,
     but also contracting              but also contracting                  contracting                                                                                                Housing Finland and
                                                                                                                                                                                        CEE, Infrastructure
                                                                                                                                                                                             projects

                                                                                                    Revenue, adjusted operating profit are pro forma figures for 2018.
6                  Credit investor and analyst presentation March 2019                              Equity investments and investment commitments are actual figures as at December 31, 2018.
Market outlook for the next 12 months

                                                                 Housing
                                                                 Finland and          Housing              Business        Infrastructure                     Partnership
                                                                 CEE                  Russia               premises        projects             Paving        properties

Finland

Russia

The CEE countries

The Baltic countries

The Czech Republic, Slovakia, Poland

Scandinavia

Sweden

Norway

Denmark

     Weakened outlook compared to the past                            Unchanged outlook compared to the past          Improved outlook compared to the past
     12 months’ development                                           12 months’ development                          12 months’ development
 7                   Credit investor and analyst presentation March 2019
2
YIT’s strategy
2019‒2021

8         Credit investor and analyst presentation March 2019   PURJEENTEKIJÄNKUJA APARTMENT BUILDING PROJECT
                                                                                 LAUTTASAARI, HELSINKI, FINLAND
YIT Strategy 2019–2021 – Performance through cycles
Profitable and financially stable YIT

STRATEGIC PRIORITIESSTRATEGIC PRIORITIES                                                                            CORNERSTONESOF
                                                                                                                  CORNERSTONES  OF SUCCESS
                                                                                                                                   SUCCESS

                                                                                                                  TOP PERFORMANCE
                                                                                                                  • Synergies EUR 40–50 million
    URBAN DEVELOPMENT                                                                                             • Focus on productivity improvement

                                                                                   Sustainable
    Focus in self-developed, longer
                                                                                      urban
                                                                                                                  CAPITAL EFFICIENCY
    value chain and negotiation based
                                                                                   development                    • Leaner operating model in Russia
    projects
                                                                                                                  • Annual free cashflow EUR +150 million

    NON-CYCLICAL BUSINESSES                                                                                       SUCCESS WITH CUSTOMERS AND PARTNERS
                                                                                                PARTNERSHIP       • Improving customer experience and NPS
                                                                          PAVING
                                                                                                 PROPERTIES       • Deeper partnerships, higher value, more speed
    Annual EBIT EUR >100 million from                                           NON-CYCLICAL OFFERING:
    non-cyclical businesses from 2019 on                                SERVICES, RENOVATION, PAVING, OWNERSHIP
                                                                                                                  HAPPY PEOPLE
                                                                                                                  • Common culture, open and involving way to lead
                                                                                                                  • Most preferred employer in the field

                  Credit investor and analyst presentation March 2019
9
YIT Strategy 2019–2021 – Performance through cycles
Profitable and financially stable YIT

 STRATEGIC PRIORITIESSTRATEGIC PRIORITIES                                                                          CORNERSTONESOF
                                                                                                                 CORNERSTONES  OF SUCCESS
                                                                                                                                  SUCCESS

URBAN DEVELOPMENT 2018                                                                                           TOP PERFORMANCE

Revenue EUR 1,855 million                                                                                        EUR 19 million of realised synergies
Adjusted EBIT EUR 146 million                                                                                    during 2018

                                                                                     Sustainable
                                                                                        urban
                                                                                                                 CAPITAL EFFICIENCY
NON-CYCLICAL BUSINESSES 2018                                                         development
                                                                                                                 Capital employed EUR 319 million in
Revenue EUR 921 million                                                                                          Russia on 12/2018 (397)
Adjusted EBIT EUR 35 million
                                                                                                                 SUCCESS WITH CUSTOMERS AND PARTNERS
                                                                                                   PARTNERSHIP
                                                                            PAVING                               52% Net Promoter Score in 2018
                                                                                                    PROPERTIES
TENDER-BASED CONTRACTING 2018                                                NON-CYCLICAL OFFERING:
                                                                     SERVICES, RENOVATION, PAVING, OWNERSHIP     HAPPY PEOPLE
Revenue EUR 1,037 million
Adjusted EBIT EUR -21 million                                                                                    Exit rate (own request) 3.8% in 2018

               Credit investor and analyst presentation March 2019
10
Some examples of urban development projects
YIT’S ONGOING PROJECTS FUTURE PROJECTS
TIETOTIE 6 TRIPLA HELSINKI HIGH RISE CAMPUS MARIA
ESPOO, FINLAND HELSINKI, FINLAND FINLAND HELSINKI, FINLAND
120M€ 1.4BN€M€
1,400 500 + 500M€ 300M€
2017-2020 2014-2020 2021-2030 2021-2025
COMPLETED PROJECT
TAMPERE LIGHT RAIL KEILANIEMENRANTA JOKERI LIGHT RAIL
TAMPERE, FINLAND ESPOO, FINLAND HELSINKI, FINLAND E18 HIGHWAY (33 KM)
240M€ 800M€ 300M€ SOUTHERN FINLAND
2017-2020 2018-2025 2019-2022 220M€
2015-2018
11 Credit investor and analyst presentation March 2019Strategic financial targets 2019–2021
Financial target Long-term target level
ROCE-% >12%
Gearing 30–50%
Dividend per share Growing annually
Credit investor and analyst presentation March 2019
12KEY ELEMENTS OF YIT CULTURE
VALUES
RESPECT COOPERATION CREATIVITY PASSION
• We care about our customers • We are open and share • We trust and build • We aim high with quality,
and personnel knowledge a positive spirit expertise and results
• We look for environmentally • We involve and partner • We empower people to • We work ethically and keep
sustainable solutions to succeed innovate and challenge our promises
LEADERSHIP PRINCIPLES
• Act as one YIT team • Welcome change and new ideas • Celebrate success and learn from
• Lead by example • Be available, listen and ask mistakes
MANAGEMENT PHILOSOPHY
• Management By Key Results, MBKR
13 Credit investor and analyst presentation March 2019
TOGETHER WE CAN DO IT.3
Group development in
2018 and key ratios
14 Credit investor and analyst presentation March 2019 REMIXER METHOD ON E18 MOTORWAY
SOUTHERN FINLANDYear 2018 in brief
• YIT and Lemminkäinen merged on February ADJUSTED OPERATING PROFIT PER SEGMENT IN 2018, EUR million, %
1st 2018, integration proceeded as planned 20%
Partnership properties
• Revenue 3,759 M€ (3,863) and adjusted
operating profit 134.5 M€ (138.9) 15%
• Self-developed projects boosted revenue and profit
in Housing Finland and CEE, Business premises 10% Housing
and Partnership properties FIN & CEE
Business
• Paving, Infrastructure projects and Housing Russia 5%
premises
%
underperformed –more positive outlook for 2019
due to completed actions in 2018
0%Paving
• Strong operating cash flow amounting to -50
Infra
0 50 100 150
149 M€ -5%
• Strengthened urban development portfolio
-10%
• New strategy “Performance through cycles” Housing
Russia Area of the circle indicates the
for 2019-2021 prepared and published -15%
volume of revenue
Adjusted operating profit, M€
15 Credit investor and analyst presentation March 2019Key figures
IFRS, EUR million
Pro forma Pro forma
Income statement
1–12/18 1–12/17 Change1
Revenue 3,759.3 3,862.5 -3%
Adjusted operating profit 134.5 138.9 -3%
Adjusted operating profit margin, % 3.6% 3.6%
Earnings per share, EUR 0.16 0.13 22%
Reported Pro forma
Balance sheet
12/18 12/17 Change1
Capital employed 1,601.2 1,773.3 -10%
Equity ratio, % 38.1% 40.2%
Interest-bearing net debt 562.9 666.9 -16%
Gearing2, % 53.6% 59.9%
Operating cash flow after investments,
excluding discontinued operations 148.6 n/a
Order backlog 4,433.8 4,218.3 5%
Number of personnel at end of period 9,070 9,721 -7%
1 The change is calculated from pro forma figures including Lemminkäinen’s financial statements from January 1–31, 2018
TÖÖLÖNKATU PARKING FACILITY
2YIT has changed the definition of gearing on January 1, 2018 to include interest-bearing receivables in the calculation of this key figure. HELSINKI, FINLAND
The pro forma gearing for the comparison period is given according to the new definition.
Note: The adjusted operating profit does not include material reorganisation costs or impairment
16 Credit investor and analyst presentation March 2019Progress in synergy benefits and integration costs
MAIN SOURCES OF SYNERGY BENEFITS TIMING OF SYNERGY BENEFIT MEASURES
3/2018A 6/2018A 9/2018A 12/2018A 2019E 2020E
ANNUAL SYNERGY
6 34 38 40 45–50 45–50 BENEFIT ESTIMATE1
45–50
cumulative from 2018, EUR million
ESTIMATION OF ACHIEVED SYNERGY BENEFITS,
REPORTED IN EBIT EUR MILLION
Q1/2018A H1/2018A 1-9/2018A 1-12/2018A 2019E 2020E
Changes in operating model, overlaps 3 7 9 19 34–40 45–50
Premises annual, EUR million
COST ESTIMATE AT
IT systems MAXIMUM
ESTIMATED INTEGRATION COSTS2
40
Other
3/2018A 6/2018A 9/2018A 12/2018A 2019E 2020E
EUR MILLION
Additional synergy benefits expected
from refinancing 5 8 11 22 35-40 40
cumulative from 2017, EUR million
1 According to the original target, full EBIT improvement potential per annum by the end of 2020, original target was set in June 2017. The
target was raised in connection with Interim Report January–March 2018.
2 Integration costs for 2017, EUR 4 million included in the cumulative figure
17 Credit investor and analyst presentation March 2019Strong operating cash flow
• Operating cash flow after investments was especially strong in Q4 supported by the property
sales, and amounted to EUR 205 million
• FY2018 operating cash flow after investments amounted to EUR 149 million
CASH FLOW OF PLOT INVESTMENTS AND INVESTMENTS TO ASSOCIATED COMPANIES
OPERATING CASH FLOW AFTER INVESTMENTS (EUR million)
AND JOINT VENTURES (EUR million)
205
130 -6
Q1 Q2 -7 Q3 Q4
-16 -26
2018 -7
-33 -46
-5
-153
-21
Q1 Q2 Q3 Q4
2018
Cash flow from investments to associated companies and joint ventures
Figures above are actual reported figures.
Cash flow from plot investments
18 Credit investor and analyst presentation March 2019All financial key ratios improved
• The company’s new strategic target for gearing is 30–50%
NET DEBT / ADJUSTED PRO FORMA EBITDA
GEARING1 (%) EQUITY RATIO (%)
(multiple, x)
79.8
73.4 75.5
40.2 39.1 38.1
59.9 34.8
53.6 33.9 5.6
4.8 4.8
3.6
3.2
Q4 Q1 Q2 Q3 Q4 Q4 Q1 Q2 Q3 Q4 Q4 Q1 Q2 Q3 Q4
2017 2018 2017 2018 2017 2018
Q4/2017 figures are pro forma based and actual reported figures since Q1/2018.
1 YIT has changed the definition of gearing so that interest-bearing receivables are included in the calculation
19 Credit investor and analyst presentation March 2019Financing activities in 2018
June 11, 2018
February 1, 2018 April 3, 2018 May 31, 2018 Voluntary redemption
May 31, issued
2018
February 1,240 M€ bridge Payment
April 3,of the
2018 Regenero August
for outstanding 100 M€8, 2018
2018 Regenero
financing agreed
240 M€ bridge
outstading
Payment share
of the of a three year issued notes due 2020Extending
and the maturity of
Lemminkäinen’s
outstading share of a three
100 year
M€ senior the 2021
300 M€ revolving
financing available February 20, 2018 50 M€ notes due
February 20, 2018 35.2 M€ hybrid bond
Lemminkäinen’s 100 M€bond
secured senior credit facility by one year
Bridge financing took place secured bond
Bridge financing 35.2 M€ hybrid bond
cancelled
cancelled took place
JANUARY FEBRUARY MARCH APRIL MAY JUNE JULY AUGUST
JANUARY FEBRUARY MARCH APRIL MAY JUNE JULY AUGUST
MERGER DAY 1
MERGER DAY 1
June 5, 2018
JuneIssuance
11, 2018 of three
- Issuance of three
year 100 year 100 M€ and five
M€ and
year 150 M€ senior
five year 150 M€unsecured notes
- Voluntary
seniorredemption
unsecured for outstanding
100 M€ notes due 2020 and
notes
50 M€ notes due 2021
20 Credit investor and analyst presentation March 2019Balanced debt portfolio
BONDS DEBT PORTFOLIO1 AT THE END OF THE PERIOD 12/2018, EUR 891.7 MILLION
Maturity Initial amout Issue date Coupon
July 6, 2019 EUR 100 million June 26, 2014 7.375% Bonds, 39%
Commercial papers, 5%
June 11, 2021 EUR 100 million June 11, 2018 3.150% Housing corporation loans, 29%
June 11, 2023 EUR 150 million June 11, 2018 4.250% Loans from financial institutions, 15%
Pension loans, 6%
RCF Finance lease liabilities, 2%
Other loans, 4%
Maturity Initial amout Issue date Status
August 2021 EUR 300 million February 2018 Undrawn
MATURITY STRUCTURE, NOMINAL AMOUNTS1 (EUR million)
COVENANTS
• YIT’s generally used covenants: gearing, equity ratio and interest
cover ratio
161 160
131
113
11 11
2019 2020 2021 2022 2023 2024-
1 Excluding
housing corporation loans, EUR 259.0 million (these loans will be transferred to the buyers of the apartments
when the units are handed over), and commercial papers, EUR 46.7 million.
21 Credit investor and analyst presentation March 2019IFRS 16 Leases - update
• New IFRS 16 became effective on the 1st of January
2019.
• Lease agreements will be recognised in balance
sheet.
• According to the current estimate
• the adoption of the standard will increase the amount
of property, plant and equipment, inventories,
advances received and financial liabilities.
• the standard is not expected to have a significant
impact on profit for the accounting period or equity.
• The balance sheet total is estimated to increase EUR
300-350 million. The adoption of the standard will
also have a positive impact on EBITDA.
• Estimates will be updated when further information is
available.
PARLIAMENT HOUSE RENOVATION
HELSINKI, FINLAND
22 Credit investor and analyst presentation March 20194
Outlook and guidance
23 Credit investor and analyst presentation March 2019 OODI CENTRAL LIBRARY
HELSINKI, FINLANDStrategic focus areas in 2019
Navigating
Proactiveness Portfolio
Performance through
to customer 2020 and
improvement changes in
demand onwards
Russia
24 Credit investor and analyst presentation March 2019Estimated completions of consumer apartment projects under
construction
Apartments under construction in total on December 31, 2018: 13,028 (9/2018: 14,666). The table below shows the company’s current estimate of completed consumer apartment
projects under construction. In addition, the company has 1,429 apartments that are recognised in accordance with percentage of completion. The timing of the commissioning permit
may deviate from the technical completion of a building, and the company cannot fully influence the reported completion date. Also other factors may influence the completion date.
1-12/2018 Q1/2019 Q2/2019 Q3/2019 Q4/2019
Actual Estimate Estimate Estimate Estimate Later
Finland 1 3,657 800 1,000 400 500 1,117
CEE 2 1,427 0 600 100 700 1,096
Russia 3 2,974 0 800 700 1,600 2,186
In total 8,058 800 2,400 1,200 2,800 4,399
1 In Finland, the estimate of completions may deviate with tens apartments depending on the construction schedule.
2 In CEE countries, the estimate of completions may vary with tens apartments, a deviation of over 100 apartments is possible depending on authorities’ decisions. The figure includes projects sold to YCE housing fund I.
3 In Russia, the estimate of completions may vary with hundreds apartments, a deviation of over 500 apartments is possible depending on authorities’ decisions.
25 Credit investor and analyst presentation March 2019Guidance for 2019
The Group revenue 2019 is estimated to be in the range of +5% – -5% compared to revenue 2018 (pro forma
2018: EUR 3,759.3 million).
In 2019, the adjusted operating profit1 is estimated to be EUR 170–230 million (pro forma 2018: EUR 134.5
million).
GUIDANCE RATIONALE
• The guidance for 2019 is based, among others, on the completion of Mall of Tripla in the
last quarter, the estimated timing of completion of the residential projects under
construction and the company’s solid order backlog. At the end of December, 63% of the
order backlog was sold.
• Significant fluctuation is expected between the quarters due to normal seasonal
variation, sales of business premises projects and the timing of completions of residential
projects as well as Mall of Tripla. As in 2018, the last quarter of the year is expected to be
clearly the strongest. The company estimates that the adjusted operating profit for first
quarter of 2019 will be on par with the comparison period (pro forma).
1 The
adjusted operating profit reflects the result of ordinary course of business and does not include material reorganisation costs, impairment charges or other items affecting comparability. Adjusted operating profit is disclosed to improve
comparability between reporting periods. Adjusting items are defined more precisely in bulletin’s the tables section.
26 Credit investor and analyst presentation March 2019Case Tripla TAPIO SALO, SVP, TRIPLA PROJECT
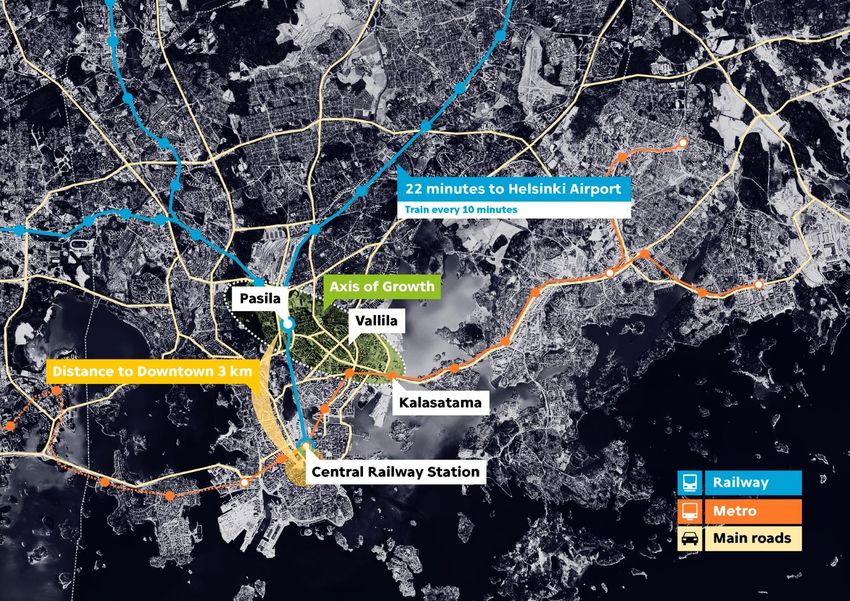
Location, location, location

                                                              MAXIMISING
                 Maximizing                                   CONNECTIVITY
                 connectivity                                 • 1.7 million consumers

                                                              • 50 million users

                                                              • 900 trains
                                                              • 800 busses
                                                              • 500 trams

                                                              • Helsinki Focus Area

                                                              PASILA YEAR 2030

                                                              • 50,000 workplaces
                                                              • 30,000 inhabitans

28      Credit investor and analyst presentation March 2019
Developing the Pasila area in Helsinki 2013 2025 29 Credit investor and analyst presentation March 2019
Office, Workery East
                                                                                                          SOLD 100% 12/2018
                                                  Office, Workery West                                    Completed Q1/2020
                                                  SOLD 100% 12/2018
                                                                                                                                          Office, Workery East
                                                  Completed Q1/2020
                                                                                                                                          SOLD 100% 12/2018
                                                                                                                                          Completed Q1/2020
               Housing
         Completed Q1-Q3/2020
                                                                                                      Hotel, Exilion
                                                                                                    SOLD 100% 6/2017
                                1                                                                   Completed Q1/2020
                                                                                                                                 Pasila Station (Mall of Tripla)
                                                                                                                                     SOLD 61.25% 6/2016
     2                                                                                                                                 Opening Q4/2019
                                    as kari said our aim is to develop cities in sustainable way.

                                                          Mall of Tripla and Parking
                                                                JV –company
                                                       Ilmarinen, YIT, Conficap, Fennia
                                                             SOLD 61.25% 6/2016
                                                              Opening Q4/2019

30
Construction schedule, 2014 estimate
Soil works 72 kk -24 months CONSTRUCTION
SCHEDULE
AHEAD OF
Parking & Metro 63 kk -6 months ORIGINAL
S WE ESTIMATE IN
ALL AREAS
Station, offices
78 kk
Workery East
-24 months
Shopping Mall, MoT 48 kk -12 months
Office workery West 33 kk -2 months
1 2
Housing 33 kk -0...6 months
Hotel 30 kk - 6 months
H2/13 H1/14 H2/14 H1/15 H2/15 H1/16 H2/16 H1/17 H2/17 H1/18 H2/18 H1/19 H2/19 H1/20 H2/20 H1/21 H2/21
Actual schedule
31 Credit investor and analyst presentation March 2019Facts and figures
TRIPLA PROJECT SIZE AT THE SITE
• Total cost estimate • Total area equivalent to • 1,200 daily workers
EUR 1.1 billion 50 football fields
• 1,000,000 tonnes of
• Total construction time • Total capacity equivalent to removed soil
6 years world’s biggest cruise ship
• 170,000 m3 of concrete
• Divided into 30 sub projects • From foundations to the roof
90 metres • 27,000 tonnes of steel
• 2,300 window boxes
• 24,000 concrete prefabricates
• Over 5,000 sq.m. of site cabins
32 Credit investor and analyst presentation March 2019Mall of Tripla PIRJO AALTO, DEVELOPMENT DIRECTOR, TRIPLA PROJECT
THE NEW OF HELSINKI
FROM
              WASTELAND
ON THE RISE
Shopping centre
Business premises
Hotel
Apartments
Public transport hub
Parking facilities
TO A
CULTURAL HOTSPOT
ON THE RISESHOPPING CENTRES ARE FAVOURITE RETAIL
DESTINATIONS IN FINLAND
401M 4,5% 6,36BN 3,6% 100%
visitors increased sales shopping centre visitor numbers more pleasant during
total sales increase long Nordic winters
ON THE RISEHELSINKI KEEPS ATTRACTING INTERNATIONAL BRANDS
2015 2016 2017 2018 2019
TokuMaru*
Espresso House Athlete’s Foot & Other Stories Gigantti- Rieker*
H&M Man Flormar Samsøe & Samsøe Phonehouse IvoNikkolo*
Power Monton*
Michael Kors KappAhl Newbie JD Sports* Surf Beach Hki*
Odd Molly Massimo Dutti Weekday FAME*
Volt Lexington
Pandora Taco Bell Cinamon* Menodiciotto*
Joe & The Juice MOHITO*
Victoria’s Secret WHSmith SuitSupply Reserved*
Hamleys MUJI Jysk City Cropp*
Upper Crust
House*
SINSAY*
* Will open their first store in Finland or flagship store in Mall of Tripla100% UNFORGETTABLE
FASHION AND CULTURE AND RESTAURANTS
LIFESTYLE ENTERTAINMENT AND CAFES
38% 16% 15%
GROCERY SERVICE AND COMMERCIAL
STORES STORAGE SERVICES
15%
FACILITIES 4%
12%
HOME OF URBAN CULTUREOVER 30% OF FINNS LIVE FINLAND
WITHIN A 30-MINUTE DRIVE FROM
MALL OF TRIPLA HELSINKI
NORWAY
SWEDEN ESTONIA
DENMARK
HOME OF URBAN CULTUREACCESSIBLE BY
PLANE CAR TRAIN TRAM BUS BIKE
22 min from 2,300 900 400 850 3,400
Helsinki Airport parking trains trams buses bicycle
spaces per day per day per day spaces
HOME OF URBAN CULTURECUSTOMER FLOW 24/7
PUBLIC TRANSPORT USERS | 47 MILLION / YEAR
CAMILLA THE COMMUTER
Five days a week, Camilla commutes from Vantaa to Helsinki via Pasila. She enjoys the convenience of Mall of Tripla for doing
groceries or goal-oriented shopping for whatever she needs. On the weekends, Tripla is a great place to relax and meet up with
friends.
LOCAL RESIDENTS | 70,000 WITHIN 2 KM
RAMI THE RESIDENT
Rami works as an IT consultant in Pasila. He lives in a newly built apartment nearby with his family of four. Mall of Tripla is a
great place to spend a Saturday with the family, stacking up on household items, eating out and going to the cinema.
EMPLOYEES AND STUDENTS | 80,000 IN THE PASILA AREA
EMILY THE EMPLOYEE
Emily works at a real estate agency at the Tripla complex. The restaurant world offers her a range of lunch options. She feels
that Mall of Tripla is the best venue for her team’s after-work activities.
LEISURE-TIME VISITORS | 3.8 MILLION / YEAR
VINCENT THE VISITOR
During his trip Vincent stays in the new hotel in the Tripla area, since the location makes it easy to move around. As Vincent’s
interests include local design and gastronomy, Mall of Tripla caters many of his needs.
NÄIN ME
HOME OFTOIMIMME
URBAN CULTURE5+1 FLOORS OF INSPIRATION
5 Soul Streets
4 Little Manhattan and railway station
3 Downtown
2 Nordic Avenue
1 Food Market
P4 Down Under
HOME OF URBAN CULTUREP4 floor DOWN UNDER - EXPERIENCE CENTRE
Beneath the daily bustle of Mall of Tripla
is an underground experience centre
unparalleled in Finland. In this
underground sports haven, visitors can
enjoy beach volleyball, indoor surfing
and summery temperature of 26 degrees
throughout the year.
The youngest mallgoers find excitement
and adventure at the all new HopLop
indoor playground. Helsinki Ballet
Academy offers courses for kids &
seniors.
CULTURAL MULTIPURPOSE
HOME OF URBAN CULTURE ARENA Credit investor and analyst 441. floor FOOD MARKET
This floor is all about food. All big grocery stores can
be found here. The MARKET ZOO is a mix of street
food, specialty shops and unique food market feel.
CULTURAL MULTIPURPOSE
HOME OF URBAN CULTURE ARENA2. floor NORDIC AVENUE
The latest trends and trusty wardrobe
staples are all found on the second
floor, where shoppers get their fashion
fix with fresh newcomers and
established megabrands.
HOME OF URBAN CULTURE3. floor DOWNTOWN
Helsinki’s new number one shopping
street, where the latest fashion and high-
quality brands are presented in elegant
surroundings with tailored ambience.
HOME OF URBAN CULTURE4. floor LITTLE MANHATTAN
Wherever you are and whatever your
mood, there’s something here for you.
Take your pick from an array of hip
restaurants, world-class brands and
flagship stores. Hit the urban stage for
awesome cultural events and pop-ups.
CULTURAL MULTIPURPOSE
HOME OF URBAN CULTURE ARENA4. floor TRAVEL HUB
The city’s traffic flows come together at
the modern and functional public
transport hub on the fourth floor.
Cafes and quick shopping points offer
convenient services to residents and
commuters. It’s easy to grab a quick bite
or take care of everyday errands.
A junction of major public transport
routes, this will be the busiest floor in
Mall of Tripla.
HOME OF URBAN CULTURE5. floor SOUL STREETS
Movie theatres, restaurant and wellness
services all right below the office services.
You can also find both, the night club and
church in this floor.
HOME OF URBAN CULTURE
KAUPUNKIKULTTUURIN KOTICITY WITHIN A CITY
CULTURAL HIGHLIGHTS CINEMA
Shows, spectacles and the Blockbusters and
Finnish Music Hall of Fame indie screenings
FOOD ACTIVITIES
Authentic flavors and fresh Indoor sports, creative collaborations
gastronomic experiments and community projects
FASHION URBAN NATURE
Top international brands Lush park in the midst of
and local Finnish names the new city center
HOME OF URBAN CULTUREURBAN
CULTURE
RESPECTS
ENVIRONMENT
MALL OF TRIPLA IS A GREEN URBAN
CENTRE WHEN IT COMES TO TRAFFIC,
CONSTRUCTION, RECYCLING, AND
ENERGY CONSUMPTION
THIS IS HOW WE ROLLWE ARE GOING GREEN
PLATINUM-LEVEL
LEED CERTIFICATE TRANSPORTATION ENVIRONMENT FIRST
Constructed to meet the criteria of the A public transport hub Plenty of greenery in common areas
highest certification level available 3,400 bicycle parking spaces 1/3 of roofs are green roofs
+300 electric car spaces
SAVING ALMOST A
WATER ZERO-ENERGY BUILDING RECYCLING
Clean water consumption about 40% Energy efficiency rating of A saves A vacuum waste collection system
lower than in comparable properties energy and prevents heat loss for mixed waste, paper, cardboard,
and biodegradable waste
Rainwater collection system
THIS IS HOW WE ROLLAdditional information Ilkka Salonen Chief Financial Officer (CFO) +358 45 359 4434 ilkka.salonen@yit.fi Hanna Jaakkola Karo Nukarinen VP, SVP, Investor Relations Treasury +358 40 566 6070 +358 50 564 0920 hanna.jaakkola@yit.fi karo.nukarinen@yit.fi Follow YIT on Twitter @YITInvestors 55 Credit investor and analyst presentation March 2019
Appendices

56      Credit investor and analyst presentation March 2019
YIT’s shareholders
                                                                                                         NUMBER OF SHAREHOLDERS AND SHARE OF NOMINEE-REGISTERED
 MAJOR SHAREHOLDERS ON JANUARY 31, 2018
                                                                                                         AND NON-FINNISH OWNERSHIP, JANUARY 31, 2018
                                                                                            % of share                                                                                                             46,704
      Shareholder                                                                 Shares       capital                                                                                                                  46,140
                                                                                                                                                                              43,752 44,312                   43,619
1.    Tercero Invest AB                                                     23,100,000           10.94                                                                                    41,944
                                                                                                                                                                                               40,016
2.    Varma Mutual Pension Insurance Company                                15,945,975            7.55                                                         36,547 36,064

3.    PNT Group Oy                                                          15,296,799            7.25                                                    32,476
4.    Conficap Invest Oy                                                        8,886,302         4.21                                               29,678
                                                                                                                                          52.9%
5.    Pentti Heikki Oskari Estate                                               8,146,215         3.86                                        25,515
                                                                                                                                  45.9%
6.    Ilmarinen Mutual Pension Insurance Company                                5,610,818         2.66                    39.9%                       38.7% 37.9%
                                                                                                                                                  36.5%
                                                                                                                                                                            34.8% 33.8%
7.    Forstén Noora Eva Johanna                                                 5,115,529         2.42                                                              32.2%
                                                                                                                                   15,265                                                 29.3%           29.5%
                                                                                                                  27.9%       14,364                                                              26.3%
8.    Herlin Antti                                                              4,710,180         2.23    22.1%
                                                                                                                          9,368
9.    Pentti Lauri Olli Samuel                                                  3,398,845         1.61            7,456
                                                                                                                                                                                                                  16.0%
                                                                                                                                                                                                                          13.8%14.6 %

      Fideles Oy                                                                3,188,800         1.51    4,928
10.

      Ten largest total                                                     93,399,463           44.24

      Nominee registered shares                                             24,946,548           11.82

      Other shareholders                                                    92,753,842          43.94
                                                                                                                     Number of shareholders
      Total                                                                211,099,853         100.00
                                                                                                                     Nominee-registered and non-Finnish ownership, % of share capital
        57                Credit investor and analyst presentation March 2019
Board of Directors as of March 16, 2018
Harri-Pekka Eero Heliövaara Erkki Järvinen Olli-Petteri
Kaukonen Vice Chairman of Member of the Lehtinen
Chairman of the the Board Board Member of the
Board Board
Inka Mero Kristina Tiina Tuomela
Member of Pentti-von Member of the
the Board Walzel Board
Member of
the Board
58 Credit investor and analyst presentation March 2019Group Management Team as of November 1, 2018
Kari Kauniskangas Ilkka Salonen Teemu Helppolainen Antti Inkilä
President and CEO CFO EVP, Housing Russia EVP, Housing
Deputy to CEO Finland and CEE
Harri Kailasalo Juha Kostiainen Esa Neuvonen Juhani Nummi
EVP, Infrastructure EVP, Urban EVP, Business EVP, Strategy and
projects development premises and development,
Partnership integration
properties
Pii Raulo Heikki Vuorenmaa
EVP, Human EVP, Paving
resources
59 Credit investor and analyst presentation March 2019Transaction overview
3.6146 new YIT shares 60% 40%
The transaction would be executed as an 3.6146 new YIT shares would be issued for After the transaction the current
absorption merger whereby Lemminkäinen each share in Lemminkäinen as merger shareholders of YIT would own 60% of the
is merged into YIT and thereafter dissolved consideration to the shareholders of combined entity whereas the current
Lemminkäinen in exchange for all assets, shareholders of Lemminkäinen would own
liabilities and businesses of Lemminkäinen 40% (assuming no redemption of opposing
shareholders)
Transaction Post transaction structure
Current owners Current owners Current owners Current owners
of YIT of Lemminkäinen of YIT of Lemminkäinen
Merger consideration 60% 40%
100% in new YIT shares 100%
YIT Lemminkäinen Combined YIT & Lemminkäinen
All assets, liabilities and businesses (merger)
60 Credit investor and analyst presentation March 2019The merger of YIT and Lemminkäinen, February 1st 2018
Revenue: EUR 1,909 million
Adjusted EBIT: EUR 122.3 million 2018 - MERGER
Personnel: 5,427
YIT is the largest Finnish and significant
SINCE
YIT creates more attractive North European construction company. We Target to
1912 and sustainable urban
environments by building
develop and build apartments, business
premises and entire areas. become
housing, business premises,
infrastructure and entire
areas.
We are also specialised in demanding together the
infrastructure construction and
paving. Together with our customers our leading urban
Revenue: EUR 1,847 million 10,000 professionals are creating more
Adjusted EBIT: EUR 46.6 million functional, more attractive and more developer in
Personnel: 4,632 sustainable cities and environments.
SINCE An expert in complex
Northern
1910
We work in 11 countries: Finland, Russia,
infrastructure construction
ana building construction in Scandinavia, the Baltic States, the Czech Europe
northern Europe and one of Republic, Slovakia and Poland.
the largest paving companies
in our market area.
* Revenue, adjusted EBIT and personnel at the end of period in 2017. YIT’s figures according to POC (percentage-of-completion) and Lemminkäinen figures according to IFRS.
61 Credit investor and analyst presentation March 2019The merger of YIT and Lemminkäinen, February 1st 2018
Merger rationale
• Target to become a leader in urban development
Strong platform for • More balanced business portfolio
1 growth (housing, business premises, infrastructure projects,
paving and partnership properties)
• Wider geographical presence in several economic regions
Synergies and • Good references and wide pool of professional people
2 improved • Potential for profitability improvement
competitiveness • Wider opportunities for specialisation and scale
Improved financial • Counter cyclicality of businesses and geographies
3 position and reduced • Lower financing costs
risk profile • Lower dependency on investment demand
• Significant market value, good liquidity of the share
Enhanced investment
4 case
• Balanced and improved risk profile
• Growing dividend expectation
62 Credit investor and analyst presentation March 2019Presentation of financial information
• In this presentation, all figures are pro forma figures, unless
otherwise stated, to facilitate the comparability of the Merger related fair value cost effects and goodwill have not been
combined company’s financial information allocated to the segments’ capital employed but are reported in
segment level in “other items and eliminations”. Therefore,
• Following the merger of YIT and Lemminkäinen on adjustments due to merger related items have no impact on the
February 1, 2018, YIT published pro forma figures for 2016 and segments’ results.
2017, which are used as comparison figures in this presentation
• YIT reports pro forma figures for 1–12/2018 to include
Lemminkäinen’s financial statements for January 1–January 31,
2018
• Balance sheet based figures as at December 31, 2018 are actual
reported figures
• All figures and comparisons are according to IFRS
reporting unless otherwise stated.
• Unless otherwise noted, the figures in brackets refer to
the corresponding period in the previous year and are
of the same unit.
63 Credit investor and analyst presentation March 2019Disclaimer This presentation has been prepared by, and the information contained herein (unless otherwise indicated) has been provided by YIT Corporation (the “Company”). By attending the meeting or event where this presentation is made, or by reading the presentation slides, you agree to be bound by the following limitations. This presentation is being furnished to you solely for your information on a confidential basis and may not be reproduced, redistributed or passed on, in whole or in part, to any other person. This presentation does not constitute or form part of and should not be construed as, an offer to sell, or the solicitation or invitation of any offer to buy, acquire or subscribe for, securities of the Company or any of its subsidiaries in any jurisdiction or an inducement to enter into investment activity. No part of this presentation, nor the fact of its distribution, should form the basis of, or be relied on in connection with, any contract or commitment or investments decision whatsoever. The information contained in this presentation has not been independently verified. No representation, warranty or undertaking, expressed or implied, is made as to, and no reliance should be placed on, the fairness, accuracy, completeness or correctness of the information or the opinions contained herein. Neither the Company nor any of its respective affiliates, advisors or representatives nor any other person shall have any liability whatsoever (in negligence or otherwise) for any loss however arising from any use of this presentation or its contents or otherwise arising in connection with the presentation. Each person must rely on their own examination and analysis of the Company and the transactions discussed in this presentation, including the merits and risks involved. This presentation includes “forward-looking statements”. These statements contain the words "anticipate", “will”, "believe", "intend", "estimate", "expect" and words of similar meaning. All statements other than statements of historical facts included in this presentation, including, without limitation, those regarding the Company’s financial position, business strategy, plans and objectives of management for future operations, are forward-looking statements. Such forward-looking statements involve known and unknown risks, uncertainties and other important factors that could cause the actual results, performance or achievements of the Company to be materially different from future results, performance or achievements expressed or implied by such forward-looking statements. Such forward-looking statements are based on numerous assumptions regarding the Company's present and future business strategies and the environment in which the Company will operate in the future. These forward-looking statements speak only as at the date of this presentation. The Company expressly disclaims any obligation or undertaking to disseminate any updates or revisions to any forward-looking statements contained herein to reflect any change in the Company's expectations with regard thereto or any change in events, conditions or circumstances on which any such statement is based. The Company cautions you that forward-looking statements are not guarantees of future performance and that its actual financial position, business strategy, plans and objectives of management for future operations may differ materially from those made in or suggested by the forward-looking statements contained in this presentation. In addition, even if the Company's financial position, business strategy, plans and objectives of management for future operations are consistent with the forward-looking statements contained in this presentation, those results or developments may not be indicative of results or developments in future periods. Neither the Company nor any other person undertakes any obligation to review or confirm or to release publicly any revisions to any forward-looking statements to reflect events that occur or circumstances that arise after the date of this presentation. 64 Credit investor and analyst presentation March 2019
You can also read