RESULTS PRESENTATION 2020 - NEPI Rockcastle
←
→
Page content transcription
If your browser does not render page correctly, please read the page content below
RESULTS PRESENTATION 2020
EXCELLENCE. INNOVATION. EXPERIENCE.

                  1                                 2        3           4
                                                  Asset
            Overview                                        Finance   Way forward
                                               management

             page 3                               page 14   page 30     page 44

NEPI ROCKCASTLE   2   RESULTS PRESENTATION DECEMBER 2020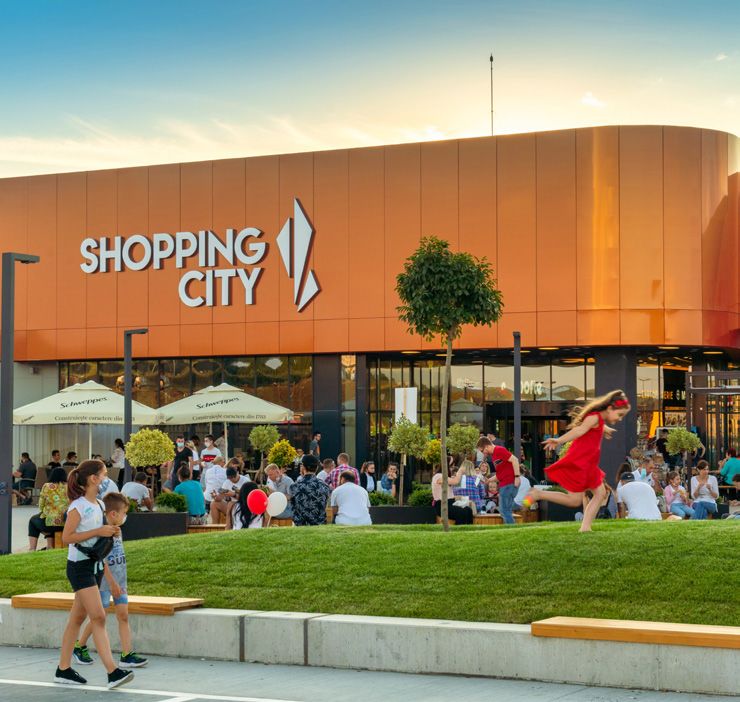
1
Overview

NEPI ROCKCASTLE   3   RESULTS PRESENTATION DECEMBER 2020

2020 context

•   Non-essential stores closed in 2020 for an average period of 73 days (20% of calendar days in the year)

•   COVID-19 started in spring 2020 with strict lockdown in all countries of operation and continued with
    partial or full restrictions throughout the remainder of the year

                                                                                   First wave - strict
                                                                                  lockdown, all non-                                                                           Second wave - periods
                                                                                    essential shops                                                                            of lockdown in several
                                                                                         closed                                                                                       countries
                  Weight in       2020 proportion
                  portfolio       of non-essential   Jan '20    Feb '20      Mar '20   Apr '20     May '20     Jun '20     Jul '20      Aug '20      Sep '20    Oct '20      Nov '20   Dec '20    Jan '21      Feb '21
                 by prop. value    shops closed

     Romania         35%               23%

     Poland          24%                21%

     Hungary         10%                14%

     Slovakia         9%               22%

     Bulgaria         8%               28%

     Croatia          5%                15%

     Czech
                      3%               26%
     Republic

     Serbia           3%                14%

     Lithuania        3%                16%

                                                      All non-essential shops closed     Entertainment and restaurants closed        Limited restrictions      Fully operational        Date of H1 results presentation

NEPI ROCKCASTLE         4     RESULTS PRESENTATION DECEMBER 2020
Key business figures
                              2020                                         2019                        Variance

                         38.42€ cents
                                                                      56.33€ cents                   -31.8%
                  Distributable earnings per share             Distributable earnings per share

                     €323m      NOI
                                                                    €401m    NOI
                                                                                                     -19.4%
                                                                                                  -18.5% retail only

                         95.7%
                         EPRA Occupancy
                                                                      97.9%
                                                                      EPRA Occupancy
                                                                                                     -2.2pp

                          95%
                          Collection rate
                                                                     99.9%
                                                                       Collection rate
                                                                                                     -4.9pp

                         221m Footfall
                                                                      325m
                                                                           Footfall
                                                                                                      -32%

                         2.2bn
                             Turnover
                                                                       3.1bn
                                                                          Turnover
                                                                                                    -29.4%*

90% cash distribution payout ratio for H2 2020
Retail GLA added: 44,300m2
Sale of Romanian office portfolio
Divestment from URW listed securities and repurchase of NEPI Rockcastle shares

                                                                                                                  * Excluding hypermarkets

NEPI ROCKCASTLE      5    RESULTS PRESENTATION DECEMBER 2020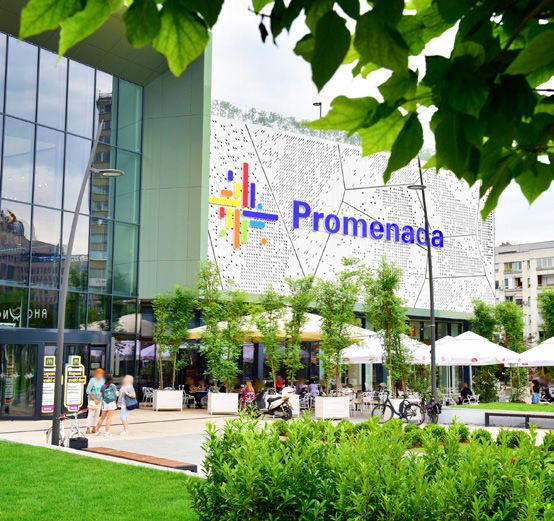
Key business figures» continued
                         Dec 2020                                   Dec 2019                                                                 Variance

                  €5.8bn
                  Investment property value*
                                                                 €6.3bn
                                                              Investment property value*
                                                                                                                                          -5.2%**

                       €6.45
                       EPRA NRV per share
                                                                   €7.32
                                                                 EPRA NRV per share
                                                                                                                                           -11.9%

                       31.5%
                         Loan-to-value*
                                                                     32%
                                                                   Loan-to-value*
                                                                                                                                          -0.5pp

                         83%
                   Unencumbered assets^
                                                                     83%
                                                               Unencumbered assets^
                                                                                                                                                  -

                  4.1 years
                    Average debt maturity
                                                               4.1 years
                                                                Average debt maturity
                                                                                                                                                  -

€1.2bn liquidity
€500m inaugural green bond
Investment grade credit ratings

                                                                                      * Including investment property held for sale and excluding immaterial impact of right of use assets
                                                                                      ** Investment property in use on a like-for-like basis (excluding other properties held for sale)
                                                                                      ^ Percentage of investment property

NEPI ROCKCASTLE    6     RESULTS PRESENTATION DECEMBER 2020
Strategy during 2020

           Ensure stability of retail
           eco-system

           Deliver on
           committed projects

           Focus on liquidity

           Customer safety and
           maintaining asset quality

NEPI ROCKCASTLE   7   RESULTS PRESENTATION DECEMBER 2020
Stable retail eco-system

Approach to retailers

•   Fair and balanced criteria                                             95.7%
                                                                   Solid EPRA Occupancy rate

•   Impact of restrictions on the tenant's business
                                                                           14.5%*
                                                                Sustainable Occupancy Cost Ratio
•   Authorities support measures

•   Maintain a vibrant and relevant tenant mix                              97%
                                                                Negotiations finalised and agreed
                                                                   contractually during 2020
•   In the case of multi-location tenants,
    negotiations held at Group level
                                                                    No notable insolvencies
                                                                          of retailers

* Excluding hypermarkets

NEPI ROCKCASTLE      8     RESULTS PRESENTATION DECEMBER 2020
Stable retail eco-system » continued

                                                                                                   38+62
Anchor and national chains retailers continued their expansion

•   310 new leases signed (43% of 2019 new leases)

    55% of which represented either new tenants to the Group or
                                                                                                           New leases breakdown
    tenants expanding in new assets their stores network
                                                                                                             International retailers 38%
•   388 lease renewals                                                                                       National and local retailers 62%

    99% of the expired lease agreements renewed with lease
    terms similar to those pre-COVID-19

Top tenants with strong liquidity and good prospects

Top 10 tenants^                                                                                                                            Annual rent
LPP*                                                                                                                                             4.2%
Auchan                                                                                                                                           3.7%
Inditex**                                                                                                                                        3.4%
Carrefour                                                                                                                                         3.1%
H&M                                                                                                                                              2.3%
New Yorker                                                                                                                                        1.8%
CCC                                                                                                                                               1.6%
Peek & Cloppenburg                                                                                                                                1.4%
C&A                                                                                                                                               1.2%
Deichmann                                                                                                                                         1.2%
Total                                                                                                                                           23.9%

* Cropp Town, House, Mohito, Reserved, Sinsay
* * Bershka, Massimo Dutti, Oysho, Pull&Bear, Stradivarius and Zara
^ For turnover only tenants, the percentage above includes the fixed rent advanced payments only

NEPI ROCKCASTLE       9   RESULTS PRESENTATION DECEMBER 2020
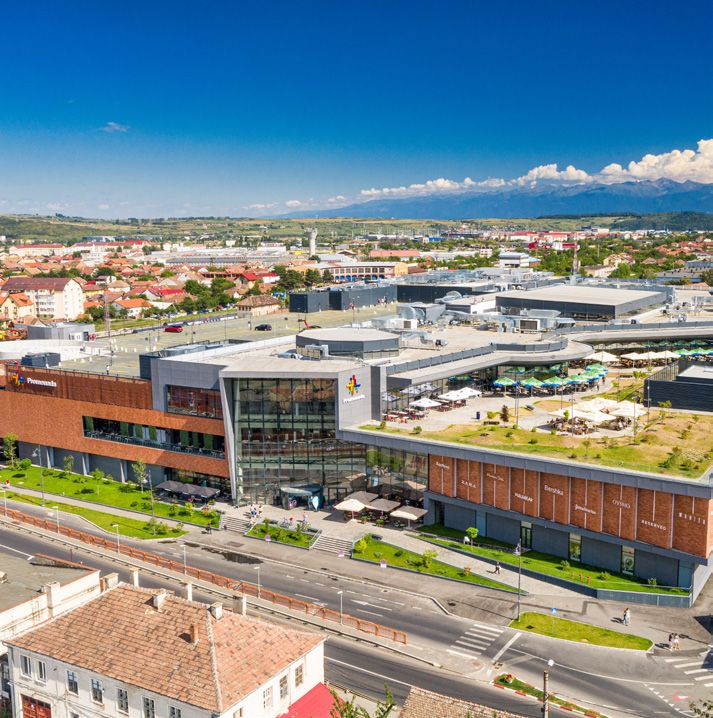
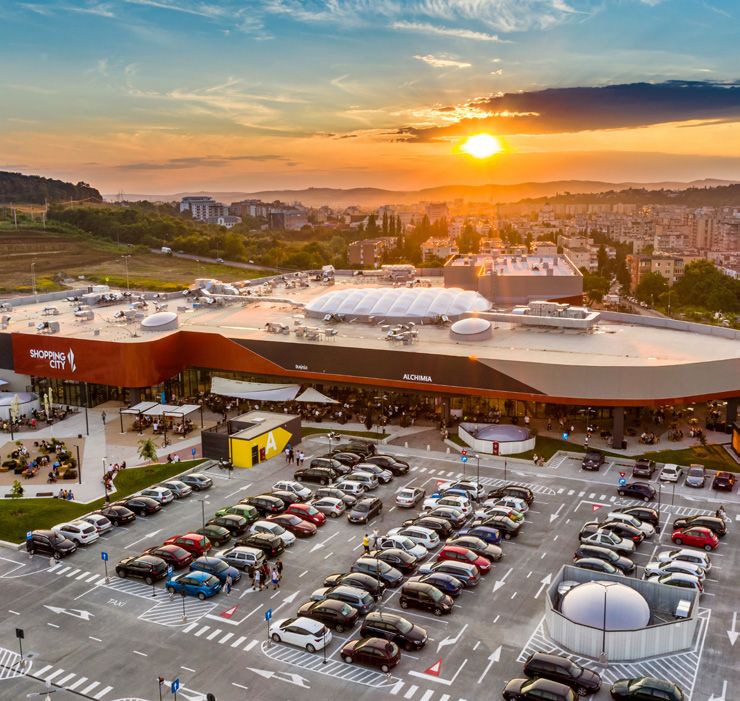
Deliver on committed projects

Shopping City Targu Mures (greenfield development)

                                                            Shopping City Buzau redevelopment and extension

NEPI ROCKCASTLE   10   RESULTS PRESENTATION DECEMBER 2020
Deliver on committed projects » continued
Focus Mall Zielona Gora refurbishment and extension ongoing
Forum Liberec Shopping Centre refurbishment
NEPI ROCKCASTLE 11 RESULTS PRESENTATION DECEMBER 2020Deliver on committed projects » continued
Bonarka City Center refurbishment ongoing
Ozas Shopping and Entertainment Centre refurbishment
NEPI ROCKCASTLE 12 RESULTS PRESENTATION DECEMBER 2020Milestones achieved
Issue of inaugural €500 million green bond
Disposal of the Romanian office portfolio
NEPI ROCKCASTLE 13 RESULTS PRESENTATION DECEMBER 20202 Asset management NEPI ROCKCASTLE 14 RESULTS PRESENTATION DECEMBER 2020
Adapted asset management

Fast adaptation to COVID-19 challenges:

•   Immediate creation of international team to liaise with the tenants on group level

•   Intense coordination - no tenant discussion outside of Group framework

•   Discussions based on data

•   Systems in place to allow dealing with multiple issues

•   Prompt operational/marketing /capital expenses revision

•   6,150 addenda signed by end of 2020, in addition to new leases and lease renewals

•   Various lease agreements improvements received in exchange for rental concessions

•   95% collection rate

•   Managed to keep EPRA vacancy ratio at low level of 4.3%

Typical lease terms signed in 2020

•   Intensive GLA over extensive GLA

•   Lease term remains minimum 5 years

•   Commercial terms comprise base rent, service charges, marketing fees and
    additional turnover rent

•   No additional break option

•   All leases are in euro

•   Rent and marketing fees are annually indexed with consumer prices indices, and
    the vast majority of service charges are recoverable

NEPI ROCKCASTLE    15   RESULTS PRESENTATION DECEMBER 2020
Tenant sales recovered faster than footfall
Footfall decreases by 32.9%* vs 2019, but higher spending is noted (tenant sales decrease only by 31.5%*)
Fast rebound of footfall gives an optimistic signal regarding the customers’ appetite to return to shopping centers
Increased basket size:
+8.50% September 2020 vs 2019
+2.22% December 2020 vs 2019
Footfall and Tenants turnover change
% 2020 vs 2019
20
0
First wave - strict
lockdown, all
-20 non-essential shops
closed
-40
-60
Pre-COVID period Quick rebound and upward footfall Second wave - periods
(Jan-Feb), sales up by trend during months with limited of lockdown in several
-80 9%* vs previous year restrictions countries
-100
Jan Feb Mar Apr May Jun Jul Aug Sep Oct Nov Dec
Footfall Turnover
* On a like-for-like basis
NEPI ROCKCASTLE 16 RESULTS PRESENTATION DECEMBER 2020Active management
• Tenants dependent on daily traffic (impulse shopping) performed weaker
• Customers adapting to 'Work From Home' spent more on home deco/electronics
• Leisure/dining/entertainment are expected to bounce back as customers are eager to return to their lifestyle pre-COVID-19
Sales performance 2020 vs 2019
per retail category
Electronics -14%
Health & Beauty -18%
Furnishings & DIY -21%
Sporting Goods -23%
Fashion Complements -25%
Other Retail -25%
Fashion -31%
Kiosks -32%
Food Service -39%
Services -52%
Entertainment -63%
NEPI ROCKCASTLE 17 RESULTS PRESENTATION DECEMBER 2020Active management » continued
2021 asset management approach
• Health and safety remains the highest priority
• Close monitoring of local legislation
• Cooperation with local authorities regarding opening
protocols and healthy measures
• Close liaison with the tenants
• Intensive works aimed at cross-border leasing and bringing
new tenants to the region
Tenant mix management:
Focus on:
• tenant mix and layouts optimisation
• improving quality of offering-tenants entering new cities and
locations
NEPI ROCKCASTLE 18 RESULTS PRESENTATION DECEMBER 2020Active management » continued
New and strengthened partnership with tenants
Bonarka City Center
900m2 Relocation to Relocation Refurbishment Refurbishment Refurbishment
extension a three times and
larger unit enlargement
Solaris Shopping Centre Galeria Tomaszow Alfa Centrum Bialystok
Lease Lease New lease New lease Refurbishment Refurbishment
extension extension agreement agreement
Focus Mall Zielona Gora Galeria Warminska Galeria Mlyny
New lease Extension Refurbishment New lease New lease
agreement agreement agreement
NEPI ROCKCASTLE 19 RESULTS PRESENTATION DECEMBER 2020Active management » continued
New and strengthened partnership with tenants
Shopping City Buzau
1st 1st 1st 1st
in the city in the city in the city in the city
1st 1st 1st
in the city in the city in the city
Mega Mall
Refurbishment Relocation Reopening
and Forum Usti
enlargement nad Labem
Louis
Juna
New lease New lease New lease
agreement agreement agreement
NEPI ROCKCASTLE 20 RESULTS PRESENTATION DECEMBER 2020Active management » continued
New and strengthened partnership with tenants
Ozas Shopping and Entertainment Centre
New lease New lease Lease New lease Lease
agreement agreement extension agreement extension
Forum Liberec Shopping Centre
New lease New lease New lease New lease New lease
agreement agreement agreement agreement agreement
Aupark Zilina Aupark Kosice Mall
New lease
agreement
New lease
agreement
New lease
agreement
1st 1st
store outside store outside
Bratislava Bratislava
NEPI ROCKCASTLE 21 RESULTS PRESENTATION DECEMBER 2020New face of entertainment
Creating leisure destinations in the shopping centers and strengthening the experience, offering an alternative to
the home entertainment
In Ozas Shopping and Entertainment Centre - creation of a 6,000m2 complex and fluid entertainment space, that encompasses:
• Adventica, a 4,300m2 family entertainment park opened in June
2020, which includes a large jumping area, a ninja-warrior arena,
virtual screens, electric cars and more
• The park brought in 70,000 customers high sales despite periods
of closure
• O’Learys - a new concept bringing together a cinema with dining
experience, a VR gaming field, a basketball court and many
more. Construction works in progress
• Professional swimming pool with 9 tracks for professionals and
for a swimming school
NEPI ROCKCASTLE 22 RESULTS PRESENTATION DECEMBER 2020Adaptive retail - Physical Retail and E-commerce
• Online share of total retail sales in CEE countries still expected to remain below Western European countries and US
• Total retail sales forecasted to grow at higher pace then Western European countries and US
% Online share of total retail sales % Total Retail sales growth
25 10
20 5
15 0
10 -5
5 -10
0 -15
Czech Weighted average countries with
Romania Poland Bulgaria Hungary Slovakia France Germany UK Euro Area US Eurozone UK US
Republic NRP presence by population
2019 2020F 2021F 2022F 2023F
Source: GlobalData
Total shopping centre floorspace*
Czech Western
Romania Poland Bulgaria Serbia Hungary Croatia Slovakia Republic Lithuania Europe USA
Shopping center density (m2 / 1,000 population) 201.0 318.8 115.2 79.7 229.7 123.6 219.9 224.4 311.7 322.0 1,500
Population (million people) 19.4 38.0 6.9 6.9 9.8 4.0 5.5 10.7 2.8 420.5 330
Stock of shopping centre space (million m2) 3.9 12.1 0.8 0.6 2.24 0.5 1.2 2.4 0.9 135.4 509
Source: Colliers, JLL, CBRE * excludes high street retail space
NEPI ROCKCASTLE 23 RESULTS PRESENTATION DECEMBER 2020Adaptive retail - Physical Retail and E-commerce » continued
Conversion of internet users in online shoppers in CEE countries significantly below the EU-27
Limitations faced by E-commerce support the expectation that the 2020 E-commerce growth will partially reverse in 2021:
• Missing social element of a shopping trip
• Low consumer confidence in online payment
• Difficult logistics related to delivery/return
% Internet use and online purchases 2020 Most popular online purchase of goods and services*
(% of individuals aged 16 to 74) EU
100
Clothes, shoes
or accessories 64%
80
Streaming 32%
services
60 Food deliveries 29%
Furniture 28%
40
Beauty 27%
Books 27%
20
IT&C 26%
0 Music 26%
Romania Poland Bulgaria Hungary Slovakia
Czech
Lithuania Serbia UK EU-27
0% 10% 20% 30% 40% 50% 60% 70%
Republic
* % of people who bought or ordered goods or services over internet for private
Used internet within last 12 months Purchased online within the last 12 months use 3 months prior to February 2021
Source: Eurostat
NEPI ROCKCASTLE 24 RESULTS PRESENTATION DECEMBER 2020Adaptive retail - Digital acceleration strategy
Create a customer-centric ecosystem that drives incremental footfall and turnover by
offering surprising experience, personalisation and convenience to our loyal shoppers
Digitally augmented
experience
Unified
Loyalty Program
Surprising
rewards
Relevant
Personalised communication
communication
Convenient
shopping
WOW shopping experience,
Enhanced
Offline and Online brand connection
NEPI ROCKCASTLE 25 RESULTS PRESENTATION DECEMBER 2020New initiatives focused on increasing footfall
Increased digital communication and activities
• SEZAM loyalty app – the largest shopping center loyalty program in Poland,
now expanding to other countries
(41,646 application downloads; registered receipts of €7.3 million)
• Click & Collect campaign – digital advertising campaign to promote tenants
with a collection service
• Gamification events in Romania – Christmas advent calendar (8x
engagement), and Running Heroes app partnership in Mega Sport Challenge
• Arena Mall Auction – unprecedented campaign in Hungary, combining on-line
auction with direct off-line sale (769 conversions/participants on auction;
€188 average basket value/player)
• Cultural events with social media live-streams: Museum of Senses (Shopping
City Timisoara), Retro cars and Romanian brands Museum (Mega Mall) , NASA
Expo (Shopping City Targu Mures)
• Increased Communication with customers on their preferred media channels
(YouTube, Tik Tok, vloggers)
• #mALL Black Friday creative concept – national campaign in Romania to
communicate Black Friday offers
New services
• Call & collect services
• Free gift shipping on Christmas season
• Loyalty program for all shopping centre employees in Romania: special
discounts applicable in food courts, based on an access card
• Early Christmas campaigns across the whole portfolio and activities to
encourage a safe and early shopping experience
NEPI ROCKCASTLE 26 RESULTS PRESENTATION DECEMBER 2020Continuous commitment to sustainability
NEPI Rockcastle continues to be committed to sustainability strategy
• Focus on minimising waste to landfill – feasibility study finalised, waiting for submission and approval. Aiming at zero waste to
landfill from 2025
• 100% of the energy used for common areas coming from renewable sources and 50% of purchased energy produced from
renewable sources - certification received starting August 2020
• BREEAM certification or re-certification of all properties in progress (Very good or Excellent level)
• Compliant with all disclosing policies in regards to the environmental and sustainability reports (GRESB, GRI, UN SDGs)
• Car-charging stations, with the aim to increase their number and promote electrical car usage NEPI Rockcastle continues to be
committed to sustainability strategy even in difficult times
• Implementation of Green Financing Framework and issue of the inaugural €500m green bond
NEPI ROCKCASTLE 27 RESULTS PRESENTATION DECEMBER 2020Developments completed and ongoing
Lithuania
Developments completed
Shopping City Targu Mures Romania Mall Development
Shopping City Buzau Romania Mall Refurbishment
Forum Liberec Shopping Centre Czech Republic Mall Refurbishment
Poland
Ozas Shopping and Entertainment
Lithuania Mall Refurbishment
Centre
Czech Republic
Developments ongoing
Mall/
Promenada Mall Romania Extension
Office
Promenada Plovdiv Bulgaria Mall Development
Promenada Craiova Romania Mall Development
Romania
Bonarka City Center Poland Mall Refurbishment
Refurbishment
Focus Mall Zielona Gora Poland Mall
and extension
Bulgaria
NEPI ROCKCASTLE 28 RESULTS PRESENTATION DECEMBER 2020Safety in our properties "COVID-19 Compliant" certification in all countries of operations 33 malls certified Safe Retail Destinations by SAFE Shopping Centers Continous dialog with authorities on the safe re-opening measures The Group adehered to the highest health and safety standards: • social distancing rules • preventions measures in line with World Health Organisation standards • fresh air ventilation in centers and HVAC filters antiseptic treatment • hourly disinfection of frequently used areas • use of new nanotechnology materials for self-cleaning of all frequently touched areas • hand sanitising dispensers in all access points of the properties • face masks acquisition points are available in all shopping centres • temperature checks NEPI ROCKCASTLE 29 RESULTS PRESENTATION DECEMBER 2020
3
Finance

NEPI ROCKCASTLE   30   RESULTS PRESENTATION DECEMBER 2020
Prudent financial strategy

Focus on liquidity and optimisation of capital allocation

•   Reduced variable non-critical operating expenses during lockdown

•   Deferred non-committed development projects

•   Supplementary cash capacity through partial drawdown of revolving
    credit facilities during H1 2020

• 1st green bond issue of €500m

•   Capitalisation issue for H1 2020, allotting shares instead of a cash dividend

•   Disposal of Romanian office portfolio and preservation of cash proceeds

•   Strong collection rate of 95% of reported revenues
    (adjusted for concessions)

Liquidity as at 31 December 2020: €1.2bn

NEPI ROCKCASTLE   31   RESULTS PRESENTATION DECEMBER 2020
Prudent financial strategy» continued
• Investment grade credit ratings:
» BBB, negative outlook - Standard & Poor’s
Prudent LTV (%)
» BBB, stable outlook - Fitch
50
40
• LTV: 31.5% (LTV target: 35%) 35%
36.1%
30 33.0% 32.5% 32.0% 31.5%
28.0%
• 83% of the investment property unencumbered 20
10
• Weighted average remaining debt term: 4.1 years
0
H1 2018 H2 2018 H1 2019 H2 2019 H1 2020 H2 2020
• Interest rate risk 99% hedged
Net debt/EBITDA
• Extension of €325m revolving credit facilities, with 12
added sustainability-linked clauses
10
8
• Cost of debt: 2.3% (2019: 2.4%) 7
80+20
6
6.7
6.2 6.0
5.4
4 5.0
2
Debt Breakdown 2.5
By type
0
Bonds 80% 2015 2016 2017 2018 2019 2020
Bank debt 20%
Threshold monitored by management and rating agencies
NEPI ROCKCASTLE 32 RESULTS PRESENTATION DECEMBER 2020Significant headroom on unsecured debt covenants
Solvency ratio could be breached only by a 800bps deterioration of valuation yields, which is unlikely
% Solvency ratio (%)
60
50
40
40%
30 36% 37% Solvency ratio is computed on a gross basis, not adjusted
31%
20
for cash balances
10
0
2017 2018 2019 2020
Consolidated coverage ratio %
Unencumbered assets/unsecured liabilities (%)
8 500
7 7.9x
7.4x
400
6 6.6x 421%
5
300
4.8x 315%
4 290%
200
261%
3
150
2
100
1
0 0
2017 2018 2019 2020 2017 2018 2019 2020
Threshold as per unsecured debt terms and conditions
NEPI ROCKCASTLE 33 RESULTS PRESENTATION DECEMBER 2020Overview of government measures
Overview of the local legislation's impact on lease agreements in 2020
Slovakia, Czech Republic, Romania, Bulgaria, Hungary,
Poland
Lithuania Croatia, Serbia
24% by market value 15% by market value 61% by market value
Tenant payments to landlords partially covered
by governments, which in return requested
Government - imposed relief of rent and landlords to provide specific discounts
service charges during lockdown, subject to a No specific legislations enforced
mandatory six-month lease extension plus the Additional reliefs were granted in H2 2020 in
by 1st February 2021
period when units were closed Czech Republic and Slovakia for the second
wave closures and only to a limited extent in
Lithuania
General support measures taken by governments in CEE
Tax measures:
• payment deferral of tax liabilities
• exemptions/discounts granted for property tax (Romania, Poland and Croatia)
Employment support measures:
• technical unemployment (with certain thresholds), flexible working time, other tax related benefits as an aid for
preserving jobs in affected sectors
Financial/liquidity measures:
• loans for working capital, guarantees and other similar grants especially for SMEs
• suspensions of loan payments obligations for 2020 applicable for companies and individuals
NEPI ROCKCASTLE 34 RESULTS PRESENTATION DECEMBER 2020Impact of concessions in NOI
• Prior to signing lease addendum: receivable accrued as per the agreements in place written off as partial forgiveness of
receivables, fully reflected in NOI
• After the signing of lease addendums: concessions agreed straight-lined over the lease term
• Tenant reliefs governed by local legislation: fully recognised in NOI, as decrease in rental income and service charge income
• Variable discounts contingent upon tenants performance: recognised in NOI as negative turnover
• P&L effect: €69.5m; Cash effect: €72m
Accounting treatment for tenant concessions:
• rent reliefs governed by local legislation (Poland) (€16.3m)
Profit or loss
• partial forgiveness of receivables in line with IFRS 9 and IFRS
16 (no straight-lining applied) (€47m) Impact recognised in 2020
Income statement: €69.5m
• variable discounts contingent on tenants' performance (€5m)
• discounts subject to straight-lining (€1.2m)
• €2.5m concessions to be recognised in the income statement over the remaining lease period (approx. 3 years)
Tenant receivable reduced by the amount of concessions granted €69.5m
Balance sheet
Additional €6.3m net expected credit losses recognised in the period
Recoverable trade receivable balance of €36.4m
95% of the reported revenues (adjusted for concessions) collected by year-end
NEPI ROCKCASTLE 35 RESULTS PRESENTATION DECEMBER 2020Strong collection during the year
amounts include VAT
95%
Group collection rate at 31 December 2020
(97% at mid-February 2021)
€672m
(€86m) (€6m)
€45m €34m
(€591m)
Net tenant receivable Contractual rental and Rental concessions (on Net expected Cash collected Net tenant receivable
as at 31 December 2019 service charge income a cash basis, excluding credit losses as at 31 December
straight-lining) 2020 excluding
straight-lining impact
NEPI ROCKCASTLE 36 RESULTS PRESENTATION DECEMBER 2020Fair value losses on property valuation driven by COVID-19 context
External appraisers covering NEPI Rockcastle's portfolio
Share of total
Countries covered
portfolio (%)
Colliers International Romania 35%
Bulgaria, Croatia, Czech Republic,
Jones Lang LaSalle 33%
Hungary, Serbia and Slovakia
Cushman and Wakefield Poland, Hungary and Lithuania 32%
Valuation overview
Changes in valuation assumptions:
• Assumptions affecting short-term cash flows (2021/2022):
» various levels of rent holidays
» prolonged void periods
» higher levels of unpaid rents for the period
» lower levels of tenants sales-based rents and ancillary income
• Assumptions affecting long-term cash flows and values:
» increased discount rates and exit rates to reflect greater uncertainty over long-
term cash flows, liquidity, value and growth prospects on exit
"Material valuation uncertainty" clause excluded from the valuation reports, as
property markets were predominantly functional by year-end
NEPI ROCKCASTLE 37 RESULTS PRESENTATION DECEMBER 2020Fair value losses on property valuation driven by COVID-19 context » continued
Fair value loss on property portfolio of €345m generated by COVID-19 context
Exit rate Discount rate Prime yield
Countries*
2020 2019 2020 2019 2020 2019
Romania 7.28% 7.25% 9.18% 8.85% 6.75% 6.50%
Poland 6.23% 6.00% 7.83% 7.80% 5.25% 4.75% Property valuation is
down 5.2%*
Hungary 6.38% 6.20% 7.74% 7.50% 6.00% 5.75%
on a like-for-like basis
Slovakia 6.71% 6.62% 7.47% 7.13% 6.00% 5.75%
Bulgaria 7.63% 7.41% 8.73% 8.36% 7.50% 7.25%
Croatia 7.78% 7.55% 8.69% 8.30% 7.25% 7.00%
Czech Republic 6.50% 6.38% 7.24% 6.70% 5.25% 4.90% -3.8% -1.4%
Serbia 8.41% 8.17% 9.42% 8.98% 8.25% 8.00% market effect cash-flow effect
Lithuania 7.45% 7.20% 9.05% 9.00% 7.10% 6.75%
Portfolio average 7.15% 6.97% 8.37% 8.07% 6.59% 6.29%
Source: Colliers, Cushman & Wakefield, JLL Q4 2020/Q4 2019 (retail properties)
*
Investment property in use on a like-for-like basis (excluding non-core properties held for sale)
NEPI ROCKCASTLE 38 RESULTS PRESENTATION DECEMBER 2020Disposal of URW shares and repurchase of NEPI Rockcastle shares In Q4 2020, the URW share price showed a significant improvement The Board noted that a divestment of the remaining URW holding coupled with a buyback of NEPI Rockcastle shares would be accretive, also taking into account the comparative balance sheet strength and growth perspectives of the companies The transaction of €75 million was executed in late November - early December 2020, and 17,717,760 own shares were repurchased (2.95% of the share capital in issue) EPRA Net Reinstatement Value at 31 December 2020 improved by approx. 1% The lower number of shares in issue also leads to an improvement in the estimated growth in distributable earnings/ share in 2021 vs 2020 The divestment from the legacy listed securities portfolio is now finalised NEPI ROCKCASTLE 39 RESULTS PRESENTATION DECEMBER 2020
EPRA NRV: from December 2019 to December 2020
                                                                                                                               amounts in €

       7.32

                                                                                                   +0.22                        6.45
                                 -0.15
                                                        -0.57                                                       -0.12
                                                                              -0.25

   December 2019          Fair value loss from    Fair value loss from   Dividend payment   Profit for the period   Other   December 2020
                            listed securities    investment property                          and other items

NEPI ROCKCASTLE    40   RESULTS PRESENTATION DECEMBER 2020
2020 distributable earnings
amounts in euro cents
56.33
(0.3%)
+0.19 (+1.6%)
(0.2%)
+0.93
+0.10 38.42
-14.22
(-25.2%) -2.08 -0.97
(-3.7%)
-0.27 -1.12 -0.47
(-1.7%)
(-0.5%) (-2.0%) (-0.8%)
2019 NOI effect Savings in Lack of Net finance Foreign Savings in Antecedent Share of Depreciation 2020
distribution (concessions Corporate accrued expense exchange taxes earnings profit in joint added back distribution
granted) expenses income ventures
from listed
securities
(URW)
NEPI ROCKCASTLE 41 RESULTS PRESENTATION DECEMBER 2020From distributable earnings to cash flow from operating activities
amounts in € thousand
+7,641
232,415 +2,659 +759 +1,665 236,415
-1,267
-1,835 -5,622
Distributable Adjustment Non-cash items Amortisation of Accrued net Accrued income Working capital Unrealised Cash flow
earnings earnings relating to JVs financial assets finance result tax expense less adjustments foreign from operating
and NCI less cash basis tax paid exchange losses activities
net finance
result
NEPI ROCKCASTLE 42 RESULTS PRESENTATION DECEMBER 2020Declaration of H2 2020 dividend
• H2 2020 dividend declared for 90% of the distributable
earnings, to be settled in cash
• Distribution policy unchanged: 90% or more of
distributable earnings
• The Board decided to retain 10% as reserve
• LTV estimated to remain below 33% after H2 2020 dividend
payment, still prudent
• No dividend reinvestment option offered due to dilution
impact
• Cash payment to be done on 25th of March
• The economic effect of this 90% cash dividend for H2
together with the capitalisation issue for H1 is a 95%
distribution for the year 2020
NEPI ROCKCASTLE 43 RESULTS PRESENTATION DECEMBER 20204 Way forward NEPI ROCKCASTLE 44 RESULTS PRESENTATION DECEMBER 2020
CEE growth prospects expected to continue post COVID-19
Real GDP growth (%) Private Consumption Growth Index**
NEPI Rockcastle’s portfolio countries are expected to experience a more muted Private consumption growth in CEE, above the EU average, to drive the growth in retail
recession than the EU / Euro area as well as compared to other Emerging markets sales as well
140
4.8% 5.2% 5.0%
3.9%
3.5% 4.0% NRP, 137.7
3.3%
2.8% 2.8% 130
1.3% 1.1% 1.3% 0.9%
120
-0.3%
110
-4.1%
EU, 106.7
-4.9% -5.0%
-5.8% 100
Euro Area, 104.8
-8.3% -8.2%
-9.0% 90
2019A 2020F 2021F 2016A 2017A 2018A 2019A 2020A 2021F
Weighted Av. NEPI Rockcastle Portfolio* Euro Area Brazil Mexico Colombia Russia Turkey NEPI Rockcastle EU Euro Area
Unemployment (%) Consumer Price Index (%)
NEPI Rockcastle’s portfolio countries are expected to be more stable in terms of CEE area to remain the most stable amongst the emerging economies
employment than the EU / Euro area as well as compared to other Emerging markets
15.2%
17.3%
15.8% 11.9% 11.9%
14.6% 14.1%
13.7% 13.4%
11.9% 12.4%
10.5%
8.9% 9.2%
7.6%
6.6% 6.0%
5.6% 5.8% 5.2% 4.5%
4.3% 4.6% 3.7% 3.6% 3.5% 3.4%
3.5%
4.2% 3.0%
2.6% 2.7%
3.2% 2.9% 3.3% 3.2%
2.4% 2.3% 2.1%
1.2% 0.9%
0.4%
2019A 2020F 2021F 2019A 2020F 2021F
Weighted Av. NEPI Rockcastle Portfolio* Euro Area Brazil Mexico Colombia Russia Turkey Weighted Av. NEPI Rockcastle Portfolio* Euro Area Brazil Mexico Colombia Russia Turkey
* Weighted average by country share in NEPI Rockcastle portfolio (CEE countries) Source: IMF, Thomsons Reuters
** Index based on growth of private consumption expenditure per year All growth rates based on local currency
NEPI ROCKCASTLE 45 RESULTS PRESENTATION DECEMBER 2020COVID-19 evolution and start of vaccination process in CEE
Vaccination rate in NEPI Rockcastle countries progressing above EU average. According to European
Commission, by summer 2021, Member States should have vaccinated 70% of the entire adult population.
14 days moving average of COVID-19 cases per 1 million inhabitants
1 September 2020 - 18 February 2021
NEPI Rockcastle average vs WE and US
800
700
600
500
400
300
200
100
0
1 September October November December January 18 February
WE US Weighted average countries with NEPI Rockcastle presence, by population
Number of COVID-19 cases in Group's portfolio is on a decreasing trend for the last 3 months.
Source: ECDC
NEPI ROCKCASTLE 46 RESULTS PRESENTATION DECEMBER 202085% of the Group’s GLA operational as at mid-February 2021
Weight in Operational GLA Operational GLA
portfolio
by prop. value as at 31 December 2020 as at mid-February 2021
Romania 35% 94% 98%
Poland 24% 31% 91% 91%
Hungary 10% 83% 100% 82%
Slovakia 9% 21% 98%
21%
Bulgaria 8% 30% 91%
Croatia 5% 97% 98%
Czech
3% 42% 42%
Republic
Serbia 3% 100% 100%
Lithuania 3% 15% 16%
Group
65% 85%
average
All figures include vacancies;
NEPI ROCKCASTLE 47 RESULTS PRESENTATION DECEMBER 2020Development pipeline - Opportunity for long-term growth
Focus on sustainable long-term growth through development of retail and mixed-use
properties and reinforcing dominance through extensions and redevelopments projects €1 bn
development pipeline
Further opportunities
• cca. €1 billion of controlled development pipeline
• Diversification of the portfolio through mixed use (retail/residential) and residential projects
• Extensions planned to reinforce dominance of our shopping centres
Prudent investment strategy
• Sound track record in managing development risk and maintaining discipline in investment criteria
• Construction costs are committed to in a phased manner following the achievement of the pre-leasing targets and are limited to
the internal sources of financing
• Majority of works done by package contracting, with limited use of general contractors, allows flexibility to change non-
performing suppliers and enables high degree of cash flow management
NEPI ROCKCASTLE 48 RESULTS PRESENTATION DECEMBER 2020Outlook and strategy
2021 Focus
• Maximise sustainable NOI
• Digital acceleration
• Committed development pipeline
• Maintain balance sheet safety
• Leverage on the Group's strenghts to benefit from
arising opportunities
2021 Guidance
• Distributable earnings per share for 2021 are expected to
be approximately 10% higher than in 2020.
• Assumptions:
» No further systemic macroeconomic disruptions
» A continuation of the trading trends observed to date
» Highly dependent on potential future measures taken by
governments, such as further restrictions on trading or
state support to tenants and/or landlords.
NEPI ROCKCASTLE 49 RESULTS PRESENTATION DECEMBER 20205 Appendix NEPI ROCKCASTLE 50 RESULTS PRESENTATION DECEMBER 2020
Reconciliation of (loss)/profit for the period to EPRA Earnings
and distributable earnings                                                                                                       amounts in €'000

  EPRA Earnings                                                                                                   Dec 2020       Dec 2019
  (Loss)/earnings in IFRS Consolidated Statement of comprehensive income                                           (174 921)       416 235
  Fair value adjustments of investment property for controlled subsidiaries                                         345 253      (134 709)
  Fair value loss/(gain) and net result on sale of financial investments at fair value through profit or loss        93 767        (11 091)
  Gain on acquisition of subsidiaries                                                                                      -         (446)
  Gain on disposal of assets held for sale                                                                           (2 310)          (123)
  Gain on disposal of joint ventures                                                                                       -       (3 588)
  Impairment of goodwill                                                                                                   -         5 956
  Fair value adjustment of derivatives and losses of extinguishment of financial instruments                         10 539         23 743
  Transaction fees                                                                                                         -          5 411
  Deferred tax (income)/expense for controlled subsidiaries                                                        (32 440)         31 370
  Adjustments above in respect of joint ventures                                                                      1 946        (2 272)
  Non-controlling interests                                                                                          (1 064)            137
  EPRA Earnings (interim)                                                                                           123 710        168 077
  EPRA Earnings (final)                                                                                             117 060        162 545
  EPRA Earnings                                                                                                    240 770        330 623
  Number of shares for interim distribuition                                                                    600 921 133    585 838 887
  Number of shares for final distribution                                                                       608 994 907    599 797 201
  EPRA Earnings per Share (EPS interim)                                                                               20.59          28.69
  EPRA Earnings per Share (EPS final)                                                                                 19.22           27.10
  EPRA Earnings per Share (EPS)                                                                                       39.81          55.79
  Company specific adjustments:
         Amortisation of financial assets                                                                             (759)         (1 533)
         Reverse foreign exchange loss                                                                                     -           907
         Depreciation in relation to property, plant and equipment of an administrative nature                          580                -
         Add back realised foreign exchange loss                                                                           -           (37)
         Reverse income from financial investments at fair value through profit or loss                              (5 517)      (12 560)
         Accrued income from financial investments at fair value through profit or loss                                    -        12 349
         Antecedent earnings                                                                                        (2 659)          4 062
  Distributable Earnings (Interim)                                                                                   118 168       170 031
  Distributable Earnings (final)                                                                                    114 247        163 780
  Distributable Earnings                                                                                            232 415        333 811
  Distributable Earnings per Share (interim)                                                                          19.66          29.02
  Distributable Earnings per Share (final)                                                                            18.76           27.31
  Distributable Earnings per Share                                                                                    38.42          56.33

NEPI ROCKCASTLE       51   RESULTS PRESENTATION DECEMBER 2020
Disclaimer NEPI Rockcastle plc is a commercial property investor and developer, listed on the Main Board of the Johannesburg Stock Exchange Limited (JSE), Euronext Amsterdam and A2X. The information in this presentation has been included in good faith but is for general informational purposes only. All reasonable care has been taken to ensure that the information contained herein is not untrue or misleading. It should not be relied on for any specific purpose and no representation or warranty is given as regards its accuracy or completeness. The forward-looking statements contained in this document, including assumptions, opinions and views of the Company or cited from third party sources are solely opinions and forecasts which are uncertain and subject to risks. A multitude of factors can cause actual events to differ significantly from any anticipated development. Neither the Company nor any of its subsidiary undertakings nor any of its officers or employees guarantees that the assumptions underlying such forward-looking statements are free from errors nor does any of the foregoing accept any responsibility for the future accuracy of the opinions expressed in this document or the actual occurrence of the forecasted developments. NEPI Rockcastle assumes no obligation to update any forward- looking information contained in this document. The presentation should not be regarded by recipients as a substitute for the exercise of their own judgment. Investors should seek financial advice regarding the appropriateness of investing in any securities or investment strategies discussed or recommended in this presentation and should understand that statements regarding future prospects may not be realised. It does not constitute an offer to purchase any securities or a solicitation to purchase or subscribe securities neither in the United States nor in any other country where such offer or solicitation is restricted by applicable laws or regulations. Neither NEPI Rockcastle nor any affiliates nor their or their affiliates’ officers or employees shall be liable for any loss, damage or expense arising out of any access to or use of this presentation, including, without limitation, any loss of profit, indirect, incidental or consequential loss. Unless expressly agreed otherwise, no part of this presentation should be reproduced or communicated to any third party. NEPI ROCKCASTLE 52 RESULTS PRESENTATION DECEMBER 2020
NEPI ROCKCASTLE 53 RESULTS PRESENTATION DECEMBER 2020
You can also read