INFINITE POSSIBILITIES - YEAR-END REPORT - SmartCentres
←
→
Page content transcription
If your browser does not render page correctly, please read the page content below
SUPPLEMENTAL INFORMATION PACKAGE
                  December 31, 2019

INFINITE
POSSIBILITIES…
YEAR-END REPORT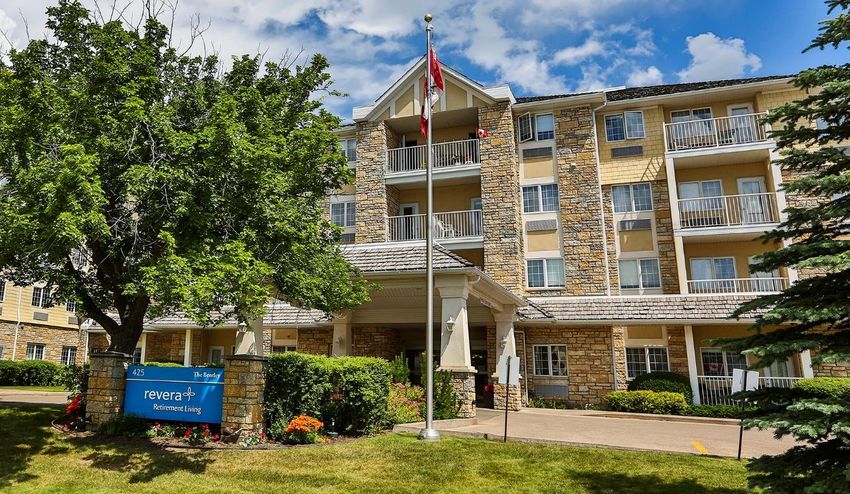
TABLE OF CONTENTS

Notice to Reader …………………………………………………………………………........………….... 2
Conference Call Highlights ………….……..………………………………………………………………. 3
Looking Beyond ……………………………………………………..…………………………………… 11
Portfolio Highlights ……………………………...……………...…………………………………………. 16
Distribution Reinvestment Plan ……………………………………………...…………………………… 17
           Distribution History …………………………………………..………………….…………..... 17
Performance of SmartCentres Units ………………………………………………………………......... 18
           Average Unit Trading Price …………………………………………………………….…….. 18
           Average Daily Volume of Units Traded ………………………………………..……………. 18
           Market Capitalization Summary ………………………………………………..……………. 18
Gross Revenue and Area by Province ………………………………………………………………….. 19
Top 25 Tenants Ranked by Gross Rental Revenue …………………………………………............. 20
Lease Expiration Schedule ……………………………………………………………………………..… 21
Area by Age (Retail Only) …………………………………………………………………………….….. 22
Future Retail Developments, Earnouts and Mezzanine Financing ……………………………......… 23
Major Mixed-Use Development Initiatives …….……………………………………………………...… 24
Mortgages Receivable (Mezzanine Financing) ……………………………………………………….. 26
Individual Property Summary ………………………………………………………………………..…… 27
Corporate Information ……………………………………………………………………........................ 37
.

SMARTCENTRES REAL ESTATE INVESTMENT TRUST
DECEMBER 2019 SUPPLEMENTAL INFORMATION PACKAGE                                   1
NOTICE TO READER

Readers are cautioned that certain terms used in this Supplemental Information Package
(“Supplement”) such as Funds From Operations ("FFO"), Adjusted Cashflow From Operations
("ACFO"), "Gross Book Value", "Payout Ratio", "Interest Coverage", "Adjusted Debt to Adjusted
EBITDA" and any related per Unit amounts used by management to measure, compare and explain
the operating results and financial performance of the Trust do not have any standardized meaning
prescribed under IFRS and, therefore, should not be construed as alternatives to net income or cash
flow from operating activities calculated in accordance with IFRS. These terms are defined in this
Supplement and reconciled to the consolidated financial information of the Trust in the
Management’s Discussion and Analysis (“MD&A”) for the year ended December 31, 2019. Such
terms do not have a standardized meaning prescribed by IFRS and may not be comparable to
similarly titled measures presented by other publicly traded entities.

Certain statements in this Supplement are "forward-looking statements" that reflect management's
expectations regarding the Trust's future growth, results of operations, performance and business
prospects and opportunities. More specifically, certain statements contained in this Supplement,
including statements related to the Trust's maintenance of productive capacity, estimated future
development plans and costs, view of term mortgage renewals including rates and upfinancing
amounts, timing of future payments of obligations, intentions to secure additional financing and
potential financing sources, and vacancy and leasing assumptions, and statements that contain
words such as "could", "should", "can", "anticipate", "expect", "believe", "will", "may" and similar
expressions and statements relating to matters that are not historical facts, constitute "forward-
looking statements". These forward-looking statements are presented for the purpose of assisting
the Trust's Unitholders and financial analysts in understanding the Trust's operating environment,
and may not be appropriate for other purposes. Such forward-looking statements reflect
management's current beliefs and are based on information currently available to management.
However, such forward-looking statements involve significant risks and uncertainties. A number of
factors could cause actual results to differ materially from the results discussed in the forward-looking
statements. Although the forward-looking statements contained in this Supplement are based on
what management believes to be reasonable assumptions, the Trust cannot assure investors that
actual results will be consistent with these forward-looking statements. The forward-looking
statements contained herein are expressly qualified in their entirety by this cautionary statement.
These forward-looking statements are made as at the date of this Supplement and the Trust
assumes no obligation to update or revise them to reflect new events or circumstances unless
otherwise required by applicable securities legislation.

SMARTCENTRES REAL ESTATE INVESTMENT TRUST
DECEMBER 2019 SUPPLEMENTAL INFORMATION PACKAGE                                                          2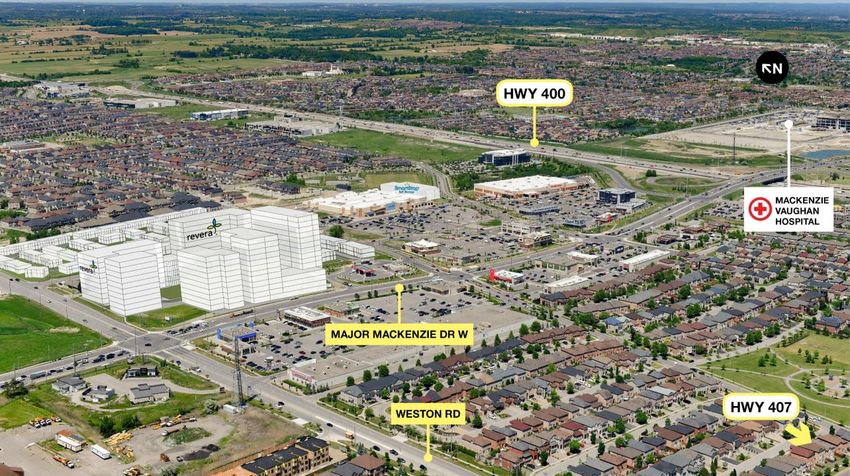
CONFERENCE CALL
HIGHLIGHTS

OPERATIONS – FOR THE YEAR
 ▪   FFO with one-time adjustments and before Transactional FFO increased by $17.6 million or
     4.8% to $386.0 million as compared to 2018
 ▪   ACFO increased by $6.7 million or 2.0% to $334.6 million as compared to 2018
 ▪   Committed and in-place occupancy rates were 98.2% and 98.1%, respectively, as at
     December 31, 2019, as compared to 98.1% and 98.0%, respectively, as at December 31, 2018.
     Outlook for new leasing remains strong
 ▪   Completed or near completion on lease renewals totaling 2,990,717 square feet, representing
     83.6% of lease maturities for December 31, 2019, with average net retail rent increases of 3.3%
     (4.0% excluding anchor tenants)
 ▪   The weighted average stabilized capitalization rate for the investment property portfolio was
     5.89% (December 31, 2018 – 5.92%)
 ▪   Payout ratio to ACFO with one-time adjustment increased by 4.5% to 87.5% as compared to
     2018

SMARTCENTRES REAL ESTATE INVESTMENT TRUST
DECEMBER 2019 SUPPLEMENTAL INFORMATION PACKAGE                                                     3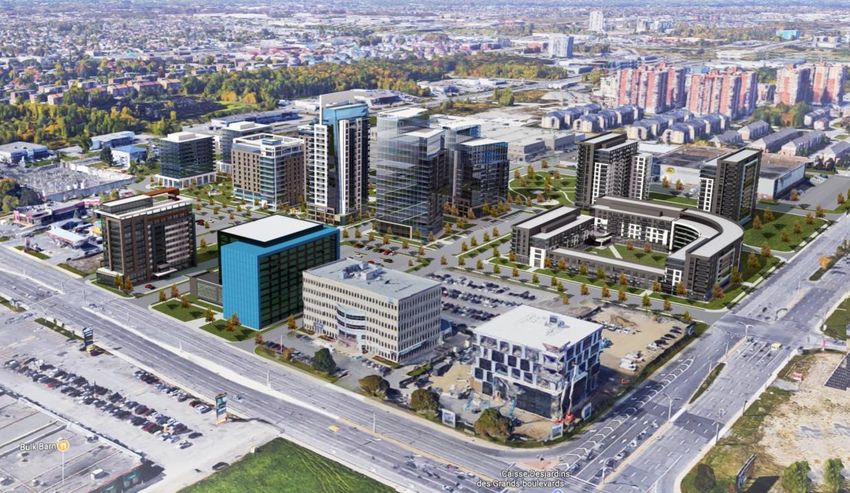
CONFERENCE CALL
HIGHLIGHTS

TENANT ACTIVITY
 ▪   Excluding SmartVMC, during 2019 SmartCentres completed approximately 209,000 square
     feet of new retail developments including additional new stores for Indigo, Marshalls, Old Navy,
     HomeSense, Dollarama, Treasure Hunt, End of the Roll, Yellow Shoes, PetSmart, Healthy
     Planet, etc.
 ▪   307,878 square feet of retail and office tenancies (including equity accounted investments) were
     completed and transferred in the year via earnouts and developments, providing an average
     unleveraged yield of 6.1%, including an expansion of an existing Winners store in Penticton and
     the opening of the PwC office space in SmartVMC
 ▪   3.0 million square feet (83.6%) of 2019 lease expiries renewed at or near completion
 ▪   The 2019 bankruptcy and closure of 21 Bombay and Bowring locations and 46 Payless Shoes
     locations in our portfolio represent 103,000 square feet and 107,000 square feet, respectively.
     Substantively all of these locations are part of Walmart-anchored or shadow-anchored shopping
     centres, and leasing work on backfilling these locations is going well. Currently, we have leased
     or have expressions to lease approximately 80% and 60% of the Payless/Bowring locations
     respectively of this space and we expect to have the balance of vacant space in these locations
     leased by the end of 2020
 ▪   Continued strong interest from tenants for various size properties based on quality of locations
 ▪   We see demand among expanding retailers for physical retail space continuing. Currently, the
     top expansion retail categories include grocery, off-price apparel, dollar stores, fast food and
     theme-based restaurants, fitness and health facilities, and beauty and cosmetics
 ▪   Overall, SmartCentres continues to monitor closely those tenants in certain markets where
     some rationalizing is taking place

SMARTCENTRES REAL ESTATE INVESTMENT TRUST
DECEMBER 2019 SUPPLEMENTAL INFORMATION PACKAGE                                                          4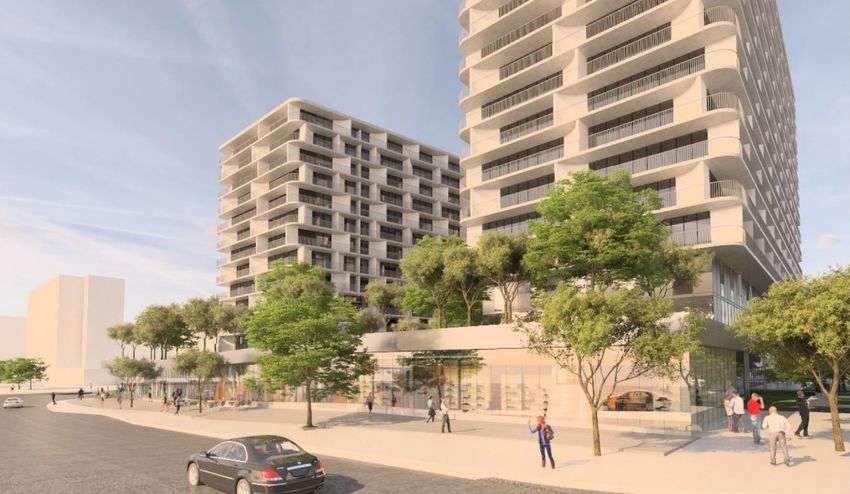
CONFERENCE CALL
HIGHLIGHTS

GROWTH
 ▪   Same Properties NOI would have increased by approximately $5.1 million or 1.0% without the
     impact of the previously announced tenant bankruptcies of Bombay/Bowring and Payless
     Shoes. When included, the Same Properties NOI was virtually flat as compared to 2018
 ▪   Premium Outlets
       ‒ both the Toronto and Montreal Premium Outlets continue to experience high sales levels
         with industry leading sales per square foot, which ranks both outlets as top tier retail
         centres in Canada
       ‒ SmartCentres continuing to work with our partner, Simon Properties, on two potential
         additional sites
 ▪   SmartVMC
       ‒ 2017 successful launch for first residential developments in a joint venture with Mitchell
         Goldhar and CentreCourt Developments Inc. with Transit City Condos 1, 2 & 3, which
         when complete will be 55 storeys each and have a total of approximately 1,741 units. All
         three towers sold out at significantly increased pricing versus original proformas.
         Construction of all three towers progressing well with Towers 1 and 2 now reaching 55th
         and 51st floors respectively and completion expected in 2020/2021. Proforma FFO for the
         three towers now expected to be approximately $65 million
       ‒ next phase includes two additional condominium towers and the first purpose-built
         residential rental apartment expected to be completed in 2023/24. The three towers total
         1,477 units. Towers 4 and 5 will be 45 storeys (498 units) and 50 storeys (528 units)
         respectively, and will have direct access to 20,000 square feet of amenity space.
         Marketing of these two towers commenced in Spring 2019 and are now sold out, and
         construction has begun. The apartment building will be 35 storeys. This phase includes
         expansive open green spaces designed by Claude Cormier & Associates. The open
         spaces are an integral part of the master plan at SmartVMC
       ‒ construction of realignment of off-ramp from Hwy 400 at Hwy 7 to align with Applewood
         Crescent completed during Q3 2019
       ‒ significant internal road infrastructure on western portion of SmartVMC now complete,
         improving internal access and extending Applewood Crescent to align directly with the
         Hwy 400 off-ramp

SMARTCENTRES REAL ESTATE INVESTMENT TRUST
DECEMBER 2019 SUPPLEMENTAL INFORMATION PACKAGE                                                    5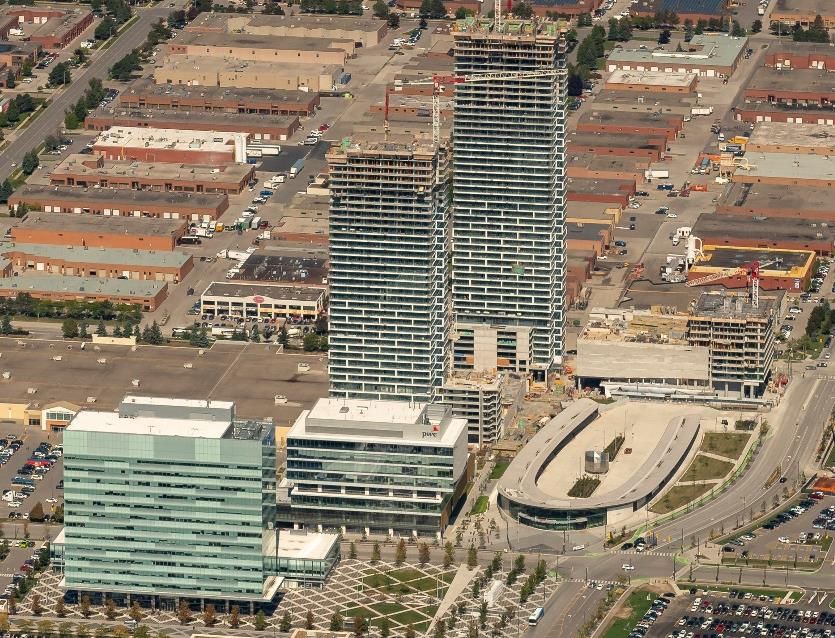
CONFERENCE CALL
HIGHLIGHTS

GROWTH (CONT’D)
       ‒ 100% of office space in both the KPMG Tower and the PwC-YMCA Tower is now leased
       ‒ working on leasing balance of KPMG Tower ground floor retail space which now includes
         TD Canada Trust, Bank of Montreal, International News and Pumpernickel's
       ‒ second mixed-use tower with PwC as lead tenant as well as YMCA, a library and other
         community space. In the PwC-YMCA Tower, PwC is now open and YMCA is expected to
         open in the summer of 2020
       ‒ signed a 10-year (plus two 5-year extensions) lease transaction with Scotiabank to be a
         tenant occupying both the PwC-YMCA Tower’s top floor and a retail branch on the ground
         floor and they are expected to open for business in Q1 2020
       ‒ commenced construction of new Walmart store on SmartCentres' former home office site
         and once complete in August 2020, will “free up” 15.5 acres of additional development
         lands on the SmartVMC site
       ‒ SmartVMC Bus Terminal (York Regional Transit) now open
       ‒ surface parking for 1,020 cars now available for subway commuters in two lots on the site
         and these are fully occupied Monday to Friday
       ‒ subway which opened in December 2017, continuing to attract higher ridership levels
 ▪   Intensification / Redevelopment
       ‒ 94 sites now under consideration for 256 mixed-use development initiatives, with
         additional projects under consideration
       ‒ JV with SmartStop progressing for self storage sites. Agreements have been executed for
         three additional sites recently bringing the total number of JV sites to 10 in the GTA. The
         three new locations are Aurora, Whitby and Markham, adding to the previously announced
         sites in Leaside, Oshawa, Scarborough, Toronto, Vaughan, and two in Brampton.
         Leaside, Brampton and the Vaughan NW sites are currently under construction with
         completion of Leaside expected later in Q1 2020. In October 2019, SmartCentres,
         together with SmartStop, purchased an existing 735-unit self storage facility on Dupont
         Street in Toronto

SMARTCENTRES REAL ESTATE INVESTMENT TRUST
DECEMBER 2019 SUPPLEMENTAL INFORMATION PACKAGE                                                     6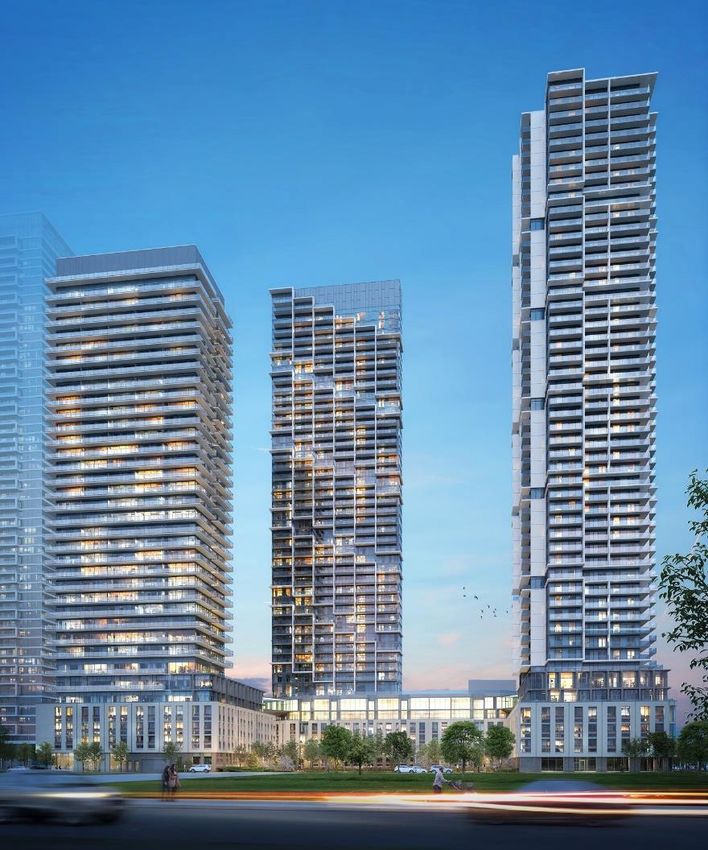
CONFERENCE CALL
HIGHLIGHTS
GROWTH (CONT’D)
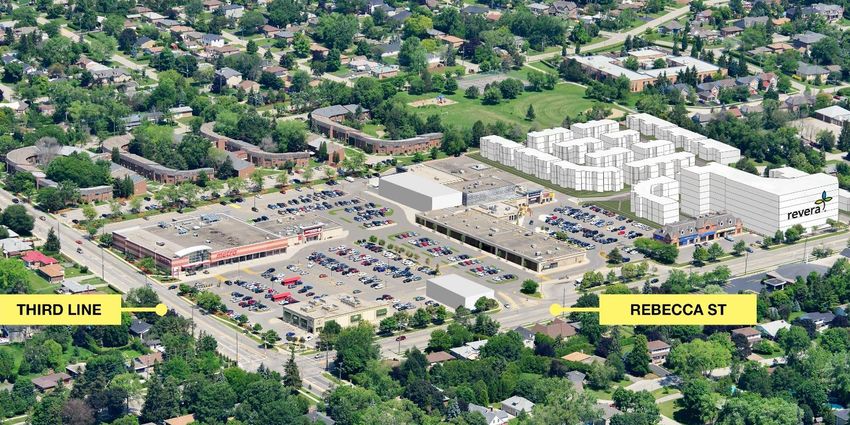
‒ agreements with Revera for seven retirement home development projects completed in
2019. Recently announced projects in Barrie, Markham and Oakville are joint ventures
between Revera and SmartCentres, and a project in Toronto between Revera and
Penguin, added to the previously announced two projects in Vaughan and one in Oakville
‒ Ottawa (Laurentian Place) SmartCentre – JV for 420-unit seniors apartment/retirement
home with another retirement home operator, Selection Group announced with
construction expected to begin later in 2020
‒ discussions with a number of other potential partners to consider residential (including
condominium, rental and single family homes), and other potential uses on existing retail
sites underway. However, SmartCentres intending to develop, market and manage many
residential projects on its own
‒ Entered into an overall agreement and specific site agreements for digital signs on seven
shopping centre sites
‒ Tesla charging stations have been installed on eight SmartCentres properties as part of a
comprehensive strategy to incorporate value-added services to many of the properties in
the retail portfolio. On average, each station includes 16 chargers. A total of 129 chargers
have been installed to date
▪ Future Opportunities
‒ retail earnouts and developments (including Premium Outlets) – committed retail pipeline
(ie. executed leases) of approximately 270,000 square feet in place at a yield of 5.9%
‒ the film studios at the StudioCentre at Lakeshore Boulevard East continue to be very
active
‒ a few examples of our extensive intensification initiatives:
o Westside Mall – mixed-use opportunity for up to 3.0 million square feet resulting
from Eglinton LRT line station and proposed GO interchange integrated with existing
retail property moving forward with strong council support
o Vaughan (400 & 7) SmartCentre – 20-acre site along Hwy 7 is now slated for
approximately 5.1 million square feet of redevelopment, including residential, office,
retail and entertainment. The site, under the Vaughan Official Plan, is permitted one
of the highest densities in Vaughan, second only to SmartVMC
SMARTCENTRES REAL ESTATE INVESTMENT TRUST
DECEMBER 2019 SUPPLEMENTAL INFORMATION PACKAGE 7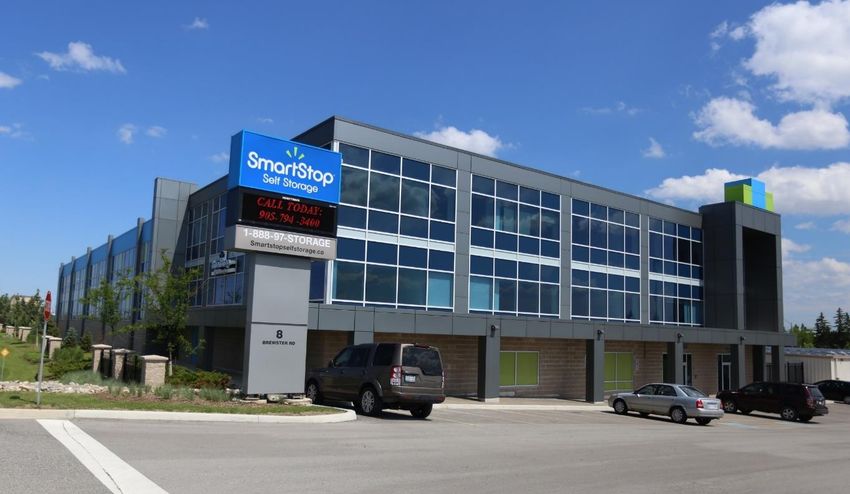
CONFERENCE CALL
HIGHLIGHTS

GROWTH (CONT’D)
            o Laval Centre
                    ‒ proposed mixed-use development, including office, residential, seniors housing
                      and further retail, now underway
                    ‒ JV with Jadco progressing well and construction also progressing well for first
                      171 unit rental tower with initial occupancy expected in Q2 2020 and second
                      167 unit rental tower expected to commence construction in 2020
            o Pointe-Claire SmartCentre is now identified for significant intensification, with zoning
              now approved for up to 1.5 million square feet of residential, in various forms, and
              retirement homes
            o South Oakville Centre is now in active redevelopment, including both a residential
              development and the seniors residence development with Revera
 ▪   Acquisitions
       ‒ In September 2019, the Trust entered into a co-ownership agreement with Greenwin and
         closed on the purchase of a 7.8 acre lakefront property in Barrie, Ontario. The project is
         contemplated to be a multi-phase rental apartment community, comprising over 2,000
         residential units. The property is in close proximity to the GO station and has direct access
         to the waterfront. Commencement of construction of the first phase is expected later in
         2020
       ‒ In October 2019, SmartCentres acquired a 50% interest in a self-storage facility in Toronto
         (Dupont Street), Ontario, which is a 50/50 joint arrangement with SmartStop for a
         purchase price of $17.1 million
       ‒ Subsequent to year end, together with our partner, Greenwin, SmartCentres announced
         the purchase of a development site in the Davisville/Yonge area of Downtown Toronto on
         which development of a high-rise purpose built rental tower is planned
       ‒ SmartCentres continues to seek acquisition opportunities that are accretive and/or provide
         future development potential

SMARTCENTRES REAL ESTATE INVESTMENT TRUST
DECEMBER 2019 SUPPLEMENTAL INFORMATION PACKAGE                                                       8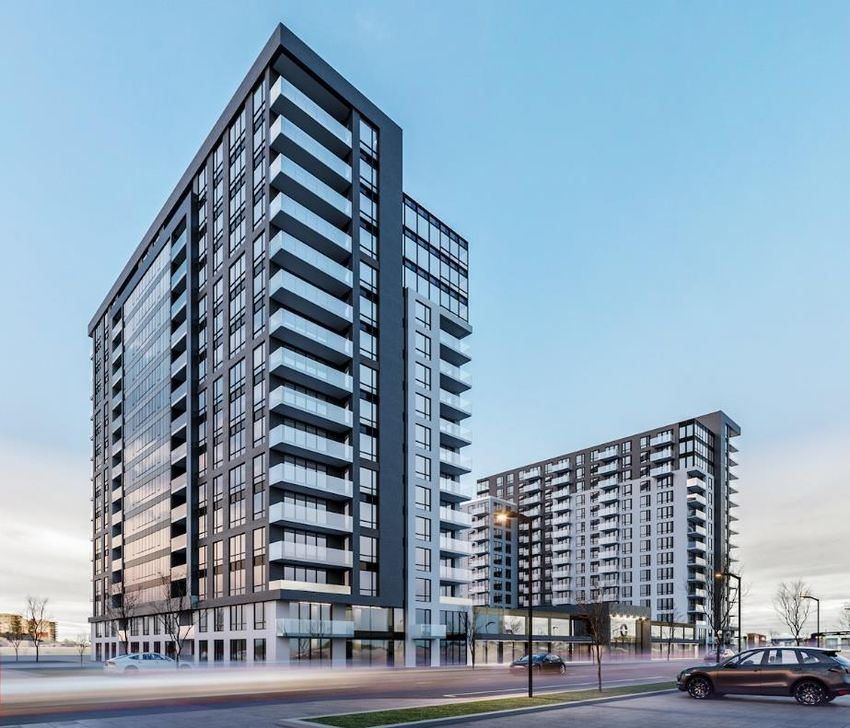
CONFERENCE CALL
HIGHLIGHTS

CAPITAL ACTIVITIES
 ▪   SmartCentres received a credit rating upgrade on December 6, 2019, and unsecured
     debentures issued after this date are rated “BBB (high)” with a stable trend
 ▪   Unencumbered asset pool in excess of $5.7 billion ($4.3 billion in 2018), providing significant
     future flexibility. Pool contains high quality assets
 ▪   In January 2019, closed an equity offering of 7,360,000 Trust Units at a price of $31.25 per
     Trust Unit for gross proceeds of $230.0 million, including the exercise, in full, of the over-
     allotment option granted to the underwriters
 ▪   In March 2019, fully redeemed $150.0 million aggregate principal amount of 4.05% Series H
     Debentures due in July 2020 (the “Series H Debentures”). Concurrent with the redemption of
     the Series H Debentures, SmartCentres arranged a new $150 million 7 year, 3.59% fixed rate
     loan with a major Canadian bank, the proceeds from which were used to repay the Series H
     Debentures
 ▪   In March 2019, closed on a $350.0 million aggregate principal amount issuance of Series T
     Debentures that carry an annual coupon rate of 2.757% and will mature in June 2021, with the
     proceeds used to repay outstanding variable rate mortgage debt to fortify the balance sheet for
     future development projects
 ▪   In May 2019, arranged a $170.0 million unsecured bank loan at a fixed rate of 3.256% for
     seven years with a major Canadian financial institution, with part of the proceeds used to
     redeem the Series L Debentures
 ▪   In December 2019, closed on $450.0 million aggregate principal amount issuance of Series U
     Debentures that carry an annual coupon rate of 3.526% and will mature in December 2029,
     with the proceeds primarily used to repay existing indebtedness and to fund a property
     acquisition
 ▪   Annual distribution increased in October 2019 to $1.85 from $1.80, representing a 2.8%
     increase
 ▪   Leverage at 42.3% decreased from 43.9% as compared to 2018
 ▪   Total debt weighted average interest rate of 3.55% (3.73% in 2018)
 ▪   Interest coverage at 3.5X (3.3X in 2018)

SMARTCENTRES REAL ESTATE INVESTMENT TRUST
DECEMBER 2019 SUPPLEMENTAL INFORMATION PACKAGE                                                     9
CONFERENCE CALL
HIGHLIGHTS
CAPITAL ACTIVITIES (CONT’D)
▪ Rebalancing between unsecured and secured continues and is approximately 63%/37% based
on current financing strategy (48%/52% in 2018)
▪ Financing in place for Transit City Condos 4 & 5
▪ Admitted into TSX “Dividend Aristocrat Index” pursuant to continuous track record of distribution
increases
▪ Completed construction and mortgage financing for:
‒ Laval Centre (first of two residential rental towers) - joint venture with Jadco
‒ Self storage facilities (multiple locations) - joint venture with SmartStop has been arranged
and credit facility with a group of lenders near completion
2020 OUTLOOK
▪ FFO per unit growth rate expected to accelerate in 2020 as initial benefits of significant
developments begin to be realized
SMARTCENTRES REAL ESTATE INVESTMENT TRUST
DECEMBER 2019 SUPPLEMENTAL INFORMATION PACKAGE 10VAUGHAN METROPOLITAN CENTRE
LOOKING BEYOND
Vaughan Metropolitan Centre – aerial
with KPMG Tower, PwC-YMCA Tower
and construction of the first three
Transit City condominiums
Construction of the Transit
City Condos (Towers 1, 2
& 3)
PwC now open in the
PwC-YMCA Tower
Artist's rendering of Transit City from the East Block
of VMC (Towers 4 & 5 and first 35-storey rental
building in left foreground)
SMARTCENTRES REAL ESTATE INVESTMENT TRUST
DECEMBER 2019 SUPPLEMENTAL INFORMATION PACKAGE 11LOOKING BEYOND
Ottawa (Laurentian Place) – Concept Plan
Pointe-Claire – Concept Plan
SMARTCENTRES REAL ESTATE INVESTMENT TRUST
DECEMBER 2019 SUPPLEMENTAL INFORMATION PACKAGE 12LOOKING BEYOND
Vaughan NW – Potential single family, self-storage, seniors
residence (with Revera) development
South Oakville – Townhomes and seniors residence (with Revera)
development
SMARTCENTRES REAL ESTATE INVESTMENT TRUST
DECEMBER 2019 SUPPLEMENTAL INFORMATION PACKAGE 13LOOKING BEYOND
Laval Centre – Concept Plan
Laval Centre – Artist's rendering of the Apartment
Buildings (currently under construction)
SMARTCENTRES REAL ESTATE INVESTMENT TRUST
DECEMBER 2019 SUPPLEMENTAL INFORMATION PACKAGE 14LOOKING BEYOND
Retirement Homes with Revera
Self-Storage with SmartStop
SMARTCENTRES REAL ESTATE INVESTMENT TRUST
DECEMBER 2019 SUPPLEMENTAL INFORMATION PACKAGE 15PORTFOLIO HIGHLIGHTS
As at As at
December 31, 2019 December 31, 2018
(in $000s, except per Unit and other non-financial data)
Total number of properties owned 165 164
Number of Walmarts / Supercentres 101 / 99 101 / 96
Number of Walmarts / Supercentres (including shadows) 115 / 113 115 / 109
Gross leasable area including both retail and office space (sq. ft.) 34,337,351 34,379,372
Total GLA in Walmart anchored centres (sq. ft.) 28,549,316 28,586,018
Future estimated retail development area (sq. ft.) 2,593,065 3,214,270
Committed occupancy rate 98.2% 98.1%
In-place occupancy rate 98.1% 98.0%
Average lease term to maturity 4.9 years 5.4 years
Net rental rate (per occupied sq. ft.) $15.49 $15.38
Net retail rental rate excluding Anchors (per occupied sq. ft.) (1) $22.13 $21.82
Total assets (2) 9,928,467 9,459,632
Total unencumbered assets (3) 5,696,100 4,250,800
Debt (3)(4) 4,290,826 4,236,364
Debt to aggregate assets (3)(4) 42.3% 43.9%
Debt to gross book value (3)(4) 49.0% 51.1%
Unsecured to secured debt ratio (3)(4) 63%/37% 48%/52%
Unencumbered assets to unsecured debt (3)(4) 2.1X 2.1X
Weighted average interest rate (3)(4) 3.55% 3.73%
Interest coverage (3)(4) 3.5X 3.3X
Adjusted debt to adjusted EBITDA (3)(4) 8.0X 8.2X
Units outstanding (5) 171,283,191 161,716,843
Unit price (TSX: SRU.UN) $31.21 $30.83
Equity (fair value) 5,345,748 4,985,730
Equity (book value) (2) 5,367,752 5,008,331
Year ended Year ended
December 31, 2019 December 31, 2018
FFO with one-time adjustments and before Transactional FFO (3)(4)(6) $2.26 $2.28
FFO with one-time adjustments and Transactional FFO (3)(4)(6) $2.28 $2.30
Payout ratio to ACFO (3)(4)(6)(7) 92.8% 83.3%
Payout ratio to ACFO with one-time adjustments (3)(4)(6) 87.5% 83.0%
Surplus of ACFO with one-time adjustments over distributions declared (3) 44,440 58,271
Surplus of ACFO with one-time adjustments over distributions paid (3) 115,980 115,384
(1) Anchors are defined as tenants within a property with leasable area greater than 30,000 square feet.
(2) Represents a GAAP measure.
(3) Represents a non-GAAP measure. The Trust’s method of calculating non-GAAP measures may differ from other reporting issuers’ methods and accordingly
may not be comparable. For definitions and basis of presentation of the Trust’s non-GAAP measures, refer to the “Presentation of Non-GAAP Measures”
section in the MD&A.
(4) Includes the Trust’s proportionate share of equity accounted investments.
(5) Total Units outstanding include Trust Units and LP Units, including Units classified as liabilities. LP Units classified as equity in the unaudited interim condensed
consolidated financial statements are presented as non-controlling interests.
(6) See “Other Measures of Performance” in the MD&A for a reconciliation of these measures to the nearest consolidated financial statement measure.
(7) The calculation of the Trust’s FFO and ACFO and related payout ratios, including comparative amounts, are financial metrics that were determined based on
the February 2019 REALpac White Paper on FFO and ACFO, respectively. Comparison with other reporting issuers may not be appropriate. The payout ratio
to FFO and the payout ratio to ACFO are calculated as declared distributions divided by FFO and ACFO, respectively.
SMARTCENTRES REAL ESTATE INVESTMENT TRUST
DECEMBER 2019 SUPPLEMENTAL INFORMATION PACKAGE 16DISTRIBUTION REINVESTMENT PLAN
Unitholders who elect to participate will have their monthly cash distributions automatically
reinvested in units of SmartCentres at a price equal to 97% of the average TSX market price
over the 10 business days preceding the monthly distribution date.
SmartCentres' DRIP will be administered by Computershare Trust Company of Canada.
Interested unitholders can also obtain an information package and the necessary registration
forms from, or direct any inquiries/concerns regarding the DRIP to, Computershare Trust
Company of Canada via telephone at 1-800-564-6253 or via mail at:
SmartCentres Real Estate Investment Trust
c/o Computershare Trust Company of Canada
100 University Avenue, 9th Floor
Toronto, ON M5J 2Y1
Attention: Dividend Reinvestment Department
DISTRIBUTION HISTORY
Per unit, paid monthly
2019 2018 2017 2016 2015
($) ($) ($) ($) ($)
January 0.15000 0.14583 0.14167 0.13750 0.13340
February 0.15000 0.14583 0.14167 0.13750 0.13340
March 0.15000 0.14583 0.14167 0.13750 0.13340
April 0.15000 0.14583 0.14167 0.13750 0.13340
May 0.15000 0.14583 0.14167 0.13750 0.13340
June 0.15000 0.14583 0.14167 0.13750 0.13340
July 0.15000 0.14583 0.14167 0.13750 0.13340
August 0.15000 0.14583 0.14167 0.13750 0.13340
September 0.15000 0.14583 0.14167 0.13750 0.13340
October 0.15417 0.15000 0.14583 0.14167 0.13750
November 0.15417 0.15000 0.14583 0.14167 0.13750
December 0.15417 0.15000 0.14583 0.14167 0.13750
Total 1.81251 1.76247 1.71252 1.66251 1.61310
SMARTCENTRES REAL ESTATE INVESTMENT TRUST
DECEMBER 2019 SUPPLEMENTAL INFORMATION PACKAGE 17PERFORMANCE OF SMARTCENTRES UNITS
AVERAGE UNIT TRADING PRICE
Per unit
2019 2018 2017 2016 2015
($) ($) ($) ($) ($)
1st Quarter 33.16 29.76 32.47 31.33 30.17
2nd Quarter 33.71 29.35 32.22 34.78 29.45
3rd Quarter 32.44 30.79 30.66 36.59 29.75
4th Quarter 31.86 30.89 29.81 31.96 31.33
YTD / Annual 32.78 30.26 31.39 33.42 30.29
Closing trading
price at end of 31.21 30.83 30.91 32.29 30.19
period
AVERAGE DAILY VOLUME OF UNITS TRADED
2019 2018 2017 2016 2015
($) ($) ($) ($) ($)
1st Quarter 353,341 237,282 221,865 288,045 200,374
2nd Quarter 249,053 193,917 274,092 198,964 242,372
3rd Quarter 283,186 204,887 181,862 226,367 218,051
4th Quarter 287,216 296,705 215,099 278,983 334,127
Annual 292,959 233,138 223,428 247,612 248,924
MARKET CAPITALIZATION SUMMARY
Date Total Units Outstanding (1) Share price per Unit Market Capitalization
($) ($)
December 31, 2019 171,283,191 31.21 5,345,748,391
December 31, 2018 161,716,843 30.83 4,985,730,270
December 31, 2017 159,720,126 30.91 4,936,949,095
December 31, 2016 155,686,295 32.29 5,027,110,466
December 31, 2015 154,088,207 30.19 4,651,922,969
(1) Total Units outstanding include Trust Units and LP Units, including Units classified as financial liabilities.
SMARTCENTRES REAL ESTATE INVESTMENT TRUST
DECEMBER 2019 SUPPLEMENTAL INFORMATION PACKAGE 18GROSS REVENUE AND AREA BY PROVINCE
GROSS REVENUE BY PROVINCE (%)
1 - Ontario - 63.0%
2 - Quebec - 13.9%
3 - British Columbia - 8.2%
4 - Saskatchewan - 3.9%
5 - Manitoba - 3.2%
6 - Alberta - 3.2%
7 - Newfoundland and Labrador - 2.7%
8 - Nova Scotia - 0.9%
9 - New Brunswick - 0.6%
10 - Prince Edward Island - 0.4%
GROSS AREA BY PROVINCE (%)
1 - Ontario - 58.4%
2 - Quebec - 15.3%
3 - British Columbia - 9.0%
4 - Saskatchewan - 4.4%
5 - Alberta - 4.3%
6 - Manitoba - 3.2%
7 - Newfoundland and Labrador - 3.0%
8 - Nova Scotia - 0.9%
9 - New Brunswick - 0.8%
10 - Prince Edward Island - 0.7%
SMARTCENTRES REAL ESTATE INVESTMENT TRUST
DECEMBER 2019 SUPPLEMENTAL INFORMATION PACKAGE 19TOP 25 TENANTS RANKED BY GROSS RENTAL
REVENUE
Average
Number of Gross Rental Remaining
Rank Tenant Stores Revenues Lease Term
(%) (years)
1 Walmart (1) 101 25.2 5.6
2 Canadian Tire, Mark's and FGL Sports 74 4.7 4.3
3 Winners, HomeSense, Marshalls 56 4.3 5.0
4 Loblaws, Shoppers Drug Mart 24 2.7 6.4
5 Lowes, RONA 9 2.3 4.3
6 Sobeys 17 2.1 4.2
7 Reitmans 86 1.9 2.2
8 Dollarama 53 1.7 3.6
9 Best Buy 21 1.7 3.4
10 LCBO 34 1.5 6.8
11 Michaels 25 1.5 3.0
12 Recipe Unlimited 54 1.4 5.9
13 Staples 21 1.3 3.6
14 Gap Inc. 26 1.2 3.2
15 Bonnie Togs 48 1.1 3.5
16 Bulk Barn 52 1.0 5.4
17 Toys R Us 7 0.9 5.4
18 CIBC 27 0.9 2.0
19 The Brick 10 0.9 3.9
20 Dollar Tree, Dollar Giant 27 0.8 3.7
21 Sleep Country 37 0.8 6.3
22 Ricki's, Cleo, Urban Barn & Warehouse One 38 0.8 4.6
23 Metro 8 0.8 4.3
24 GoodLife Fitness Clubs 11 0.8 7.0
25 Sail 3 0.7 7.1
Total 869 63.0 5.2
(1) The Trust has a total of 101 Walmart locations under lease, of which 99 are Supercentres. The Trust has 14 shopping centres with Walmart as shadow
anchors, all of which are Supercentres.
SMARTCENTRES REAL ESTATE INVESTMENT TRUST
DECEMBER 2019 SUPPLEMENTAL INFORMATION PACKAGE 20LEASE EXPIRATION SCHEDULE
Number Annualized Average
Year of Expiry of Stores Area Area Base Rent Rent
(sq. ft.) (%) ($) ($ psf)
Month-to-month and holdovers 127 392,808 1.2 8,098,000 20.60
2020 357 2,910,154 8.5 38,037,000 13.07
2021 432 3,814,234 11.2 54,355,000 14.25
2022 447 4,468,435 13.0 64,237,000 14.39
2023 553 4,428,310 12.9 77,025,000 17.46
2024 452 4,544,540 13.2 70,953,000 15.61
2025 223 2,570,864 7.5 36,830,000 14.33
2026 160 1,525,256 4.4 27,156,000 17.81
2027 139 2,237,548 6.5 32,904,000 14.76
2028 158 1,403,911 4.1 25,881,000 18.56
2029 204 2,266,510 6.6 38,007,000 16.85
2030 59 803,580 2.3 14,467,000 18.16
2031 16 395,289 1.2 5,557,000 17.12
2032 11 856,708 2.5 12,676,000 14.80
2033 9 242,168 0.7 3,503,000 14.47
2034 6 284,992 0.8 3,628,000 14.78
2035 2 165,382 0.5 2,260,000 13.66
Beyond 4 115,258 0.3 2,142,000 18.59
Vacant 225 658,964 1.9 - -
Total Retail 3,584 34,084,911 99.3 517,716,000 15.49
Total Office - 252,440 0.7
Total Retail and Office 3,584 34,337,351 100.0
Weighted Average Lease Expiry by area = 4.9 years
SMARTCENTRES REAL ESTATE INVESTMENT TRUST
DECEMBER 2019 SUPPLEMENTAL INFORMATION PACKAGE 21AREA BY AGE (RETAIL ONLY)
Age Area Area
(sq. ft.) (%)
2002 - present 25,330,929 73.8
1995 - 2001 7,494,856 21.8
Before 1995 1,511,566 4.4
Total 34,337,351 100.0
Portfolio of high quality, newly developed assets with an
average age of 15.8 years and minimal capital expenditure
requirements.
SMARTCENTRES REAL ESTATE INVESTMENT TRUST
DECEMBER 2019 SUPPLEMENTAL INFORMATION PACKAGE 22FUTURE RETAIL DEVELOPMENTS, EARNOUTS AND
MEZZANINE FINANCING
Total Gross Invested Net Yield /
Year Area Area Income Commitment To-date Commitment Cap Rate
(sq. ft.) (%) ($000s) ($000s) ($000s) ($000s) (%)
DEVELOPMENTS
Committed Developments
2020 88,648 3.4% 1,742 29,659(2) 18,013(2) 11,646 5.9%(3)
2021 and beyond 147,186 5.7% 2,512 44,345(2) 20,605(2) 23,740 5.7%(3)
Total Committed Developments 235,834 9.1% 4,254 74,004 38,618 35,386 5.7%
Uncommitted Developments
2020 219,975 8.5% 3,157 61,755(2) 35,908(2) 25,847 5.1%(3)
2021 and beyond 1,890,519 72.9% 37,519 659,459(2) 325,368(2) 334,091 5.7%(3)
Total Uncommitted Developments 2,110,494 81.4% 40,676 721,214 361,276 359,938 5.6%
Total Developments 2,346,328 90.5% 44,930 795,218 399,894(1) 395,324 5.7%
EARNOUTS
Committed Earnouts
2020 9,379 0.4% 246 3,804 3,767 37 6.5%
2021 and beyond 24,947 0.9% 588 8,670 213 8,457 6.8%
Total Committed Earnouts 34,326 1.3% 834 12,474 3,980 8,494 6.7%
Uncommitted Earnouts
2020 17,842 0.7% 307 4,560 636 3,924 6.7%
2021 and beyond 194,569 7.5% 3,972 58,787 2,744 56,043 6.8%
Total Uncommitted Earnouts 212,411 8.2% 4,279 63,347 3,380 59,967 6.8%
Total Earnouts 246,737 9.5% 5,113 75,821 7,360(1) 68,461 6.7%
Total before non-cash development cost 2,593,065 100.0% 50,043 871,039 407,254 463,785 5.7%
Non-cash Development Cost(4) 29,242(1)
Land / Parcel Sales 124,901(1)
Equity Accounted Investments 230,231(1)
Total 2,593,065 100.0% 50,043 871,039 791,628(1) 463,785 5.7%
Options through Mezzanine Financing 614,901
Total Potential Pipeline 3,207,966
(1) Under “Properties Under Development” in the MD&A for the years ended December 31, 2019, Earnouts of $48,363, Developments of $513,034 and Equity Accounted Investments
of $230,231 comprise the total amount of $791,628. The amounts in the chart above have been adjusted for Earnouts that are expected to be completed after the expiry of the
Earnout options being reclassified as Developments.
(2) Includes fair value adjustment for land.
(3) On a cost basis, the yield would be 5.5%, 5.0%, 3.4%, and 4.9%, respectively.
(4) Represents net liability currently recorded.
SMARTCENTRES REAL ESTATE INVESTMENT TRUST
DECEMBER 2019 SUPPLEMENTAL INFORMATION PACKAGE 23MAJOR MIXED-USE DEVELOPMENT INITIATIVES
Estimated Costs ($M) Estimated Gain on Final Sale
and Timing
GLA SRU 100%
Site Project Type ('000sf) / Completion % Share Share SRU Share Yield Profit % SRU Share Timing
Units Year
1. VMC (Office Towers) a. KPMG (T#1) Office 360sf 2016 50% $180 $90.0 5.7% — — —
(2)
b. PwC-YMCA (T#2) Office 113sf 2019 50% $59 $29.5 5.0%-5.5% — — —
c. Office (T#3) Office 600sf 2025 50% $432 $216.0 4.8%-5.5% — — —
d. Office (T#4) Office 500sf 2028 50% $351 $175.5 4.8%-5.5% — — —
2. New Premium Outlets Premium (JV) Retail 360sf 2022 50% $136 $68.0 8.0%-8.5% — — —
(Simon Property Group)
(1)
3. Laval Centre Jadco Apartments 338 Units 2020-2022 50% $82 $41.0 5.3%-5.8% — — —
(2 Buildings)
4. VMC (Condos) CentreCourt Transit City 1 551 Units 2020-2021 25% $187 $46.8 N/A 40%-45% 25% 2020-2021
(3)
CentreCourt Transit City 2 570 Units 2020-2021 25% $194 $48.5 N/A 40%-45% 25% 2020-2021
CentreCourt Transit City 3 631 Units 2021 25% $218 $54.5 N/A 30%-35% 25% 2021
CentreCourt Transit City 4 498 Units 2023 25% $200 $50.0 N/A 20%-25% 25% 2023
CentreCourt Transit City 5 528 Units 2023 25% $219 $54.8 N/A 20%-25% 25% 2023
(1)
5. VMC (Apartments) VMC Rental Apartments Apartments 451 Units 2023-2024 50% $225 $112.5 4.2%-4.6% — — —
6. Vaughan NW Fieldgate Low/Mid Rise 179 Units 2022-2023 50% $100-$120 $50.0-$60.0 N/A 10%-15% 50% 2022-2023
Residential
(1)
7. Ottawa Laurentian Selection Group Apartments/ 410 Units 2022 50% $150 $75.0 6.0%-7.0% — — —
(2 Buildings) Retirement
Residence
(1)
8. Multiple Locations Self-Storage (JV) Self-Storage 500sf built 2020-2025 50% $80M - $40M - $50M 6.0%-8.0% — — —
(9 approved development (SmartStop) (4 to 5 new per year $100M per per year
projects – Toronto (2 facilities each year
projects), Oshawa, Brampton year)
(2 projects), Vaughan,
Markham, Whitby, Aurora)
9. StudioCentre (Toronto) SRU-Penguin JV Mixed-Use 260sf 2023-2024 50% $100 $50.0 4.5%-5.5% — — —
(Office, Retail)
SMARTCENTRES REAL ESTATE INVESTMENT TRUST
DECEMBER 2019 SUPPLEMENTAL INFORMATION PACKAGE 24MAJOR MIXED-USE DEVELOPMENT INITIATIVES
Estimated Costs ($M) Estimated Gain on Final Sale
and Timing
GLA SRU 100%
Site Project Type ('000sf) / Completion % Share Share SRU Share Yield Profit % SRU Share Timing
Units Year
10. Pointe-Claire Rental Apartments Apartments 300 Units 2022-2023 50% $115 $57.5 4.5%-5.0% — — —
(1)
(Apartments) (2 Buildings)
11. Pointe-Claire (Condo) Condo Condo 200 Units 2024 50% $55 $27.4 N/A 10%-15% 50% 2024
(1)
12. Multiple Locations Retirement Living Retirement 600sf built 2023-2025 50% $100M per $50M per 6.0%-7.5% — — —
(6 approved projects – Residences (JV) Residences & per year year per site year per site
Vaughan (2 projects), (Revera) Seniors
Oakville (2 projects), Apartments
Markham, Barrie) (3 to 5 new
facilities each
year)
(1)
13. Barrie (Apartments) Rental Apartments JV Apartments 421 Units 2023 50% $186 $92.9 4.5%-5.0% — — —
(Phase 1)
(Greenwin)
14. Vaughan NW Condominium Towers Condo 248 Units 2024 100% $120 $120.0 N/A 10%-15% 100% 2024
(2 Buildings)
Notes:
(1) Stabilization is estimated to be 1 to 3 years after completion.
(2) Excludes 112,000 sf of YMCA, library, and community use space.
(3) Includes 11 Townhouse units that have not yet been released for sale.
Estimated Transactional FFO Gains on Sale related to parcel sales of land into Joint Ventures estimated at 1%-2% of annual FFO at SmartCentres' ownership share.
In addition to the projects set out in the table above, SmartCentres' pipeline also includes approximately 2.6 million square feet of future developments as set out in the table shown on the “Future
Earnouts and Developments” section. In addition to the above, SmartCentres has a further mixed-use development pipeline in excess of 12 million square feet in projects that are underway or active.
Further, SmartCentres will initiate activities in the short-term to work towards development in excess of 15 million square feet in mixed-use initiatives that will be completed in the longer-term.
SMARTCENTRES REAL ESTATE INVESTMENT TRUST
DECEMBER 2019 SUPPLEMENTAL INFORMATION PACKAGE 25MORTGAGES RECEIVABLE (MEZZANINE
FINANCING)
Total
Leasable Potential Area
Loan Interest Area upon Upon Exercising
Project Outstanding Committed Maturity Date Rate Option Completion Purchase Option
($000s) ($000s) (%) (%)(1) (sq. ft.) (sq. ft.)
Salmon Arm, BC(2)(3) 14,997 19,719 April 2020 4.99% — 215,431 —
Innisfil, ON(2)(4) 20,937 26,257 December 2020 6.75% — 139,744 —
Aurora (South), ON 17,005 30,543 March 2022 4.89% 50% 194,479 97,240
Mirabel (Shopping Centre), QC(5) — 18,262 December 2022 7.50% — — —
Mirabel (Option Lands), QC(6) — 5,721 December 2022 7.50% — 178,068 —
Pitt Meadows, BC 29,387 68,664 November 2023 5.30% 50% 73,900 36,950
Vaughan (7 & 427), ON 17,820 52,277 December 2023 5.24% 50% 302,029 151,015
Caledon (Mayfield), ON 9,944 14,033 April 2024 5.16% 50% 203,730 101,865
Toronto (StudioCentre), ON(2) 28,672 43,759 June 2024 5.13% 25% 911,322 227,831
Total 138,762 279,235 5.38%(7) 2,218,703 614,901
(1) The Trust has a purchase option from the borrower in these properties upon a certain level of development and leasing being achieved. As at December 31, 2019, it is
management’s expectation that the Trust will exercise these purchase options.
(2) The Trust owns a 50% interest in these properties, with the other 50% interest owned by Penguin. These loans are secured against Penguin’s interest in the property.
(3) Monthly variable rate based on a fixed rate of 6.35% on loans outstanding up to $7,237 and the banker's acceptance rate plus 1.75% on any additional loans above $7,237. In
July 2019, the loan was amended to reflect a maturity date of April 2020.
(4) In August 2018, the interest rate on this mortgage reset to the four-year Government of Canada bond rate plus 4.0%, subject to a lower limit of 6.75% and an upper limit of
7.75%. Prior to August 2018, the interest rate was based on the banker's acceptance rate plus 2.0%.
(5) The Trust owns a 33.3% interest in this property. The loan is secured against a 33.3% interest owned by Penguin, as well as a guarantee by Penguin.
(6) The Trust owns a 25% interest in this property. The loan is secured against a 25% interest owned by Penguin, as well as a guarantee by Penguin.
(7) Represents the weighted average interest rate.
Note: Of the $140.5 million of remaining loan advances available, $63.6 million is expected to be applied as interest on outstanding balances, and the remaining $76.9 is expected to
be used to fund development and related costs.
SMARTCENTRES REAL ESTATE INVESTMENT TRUST
DECEMBER 2019 SUPPLEMENTAL INFORMATION PACKAGE 26INDIVIDUAL PROPERTY SUMMARY
Owned Owned
Non-Owned
Rentable Rentable
Property Location Occupancy Anchor Area(1) Anchors
Area Anchor Area(1)
(%) (sq. ft.)
(sq. ft.) (sq. ft.)
RETAIL PROPERTIES
BRITISH COLUMBIA
Chilliwack Mall Chilliwack, BC 100.0 123,036 46,544 - Safeway
Courtenay SmartCentre Courtenay, BC 96.0 273,289 135,899 - Walmart Supercentre
Walmart Supercentre, Real
Cranbrook SmartCentre Cranbrook, BC 100.0 164,025 107,158 185,556 Canadian Superstore*, Home
Hardware*
Walmart Supercentre*, Canadian
Cowichan Commons East Duncan, BC 98.2 249,370 188,680 172,609
Tire, Home Depot
Kamloops SmartCentre Kamloops, BC 95.9 232,800 143,619 - Walmart Supercentre
Walmart Supercentre, Home
Langley SmartCentre Langley, BC 100.0 351,225 255,527 172,161 Depot*, Save-on-Foods*, London
Drugs, Best Buy
Walmart Supercentre, Thrifty
Maple Ridge SmartCentre Maple Ridge, BC 92.2 216,758 146,521 -
Foods
New Westminster SmartCentre New Westminster, BC 92.3 380,090 159,449 - Walmart Supercentre
Peachtree Square Penticton, BC 87.0 54,915 - 175,000 Walmart Supercentre*
Penticton Power Centre Penticton, BC 100.0 216,686 110,795 - Real Canadian Superstore
Walmart Supercentre, Home
Prince George SmartCentre Prince George, BC 96.3 313,390 165,350 204,247
Depot*, Canadian Tire*
Salmon Arm SmartCentre** Salmon Arm, BC 100.0 67,324 48,345 - Walmart Supercentre
Surrey West SmartCentre Surrey, BC 98.6 190,477 133,943 - Walmart Supercentre
Vernon SmartCentre Vernon, BC 99.6 266,110 144,782 50,300 Walmart Supercentre, RONA*
Subtotal British Columbia 97.0 3,099,495 1,786,612 959,873
ALBERTA
Walmart Supercentre, London
Calgary Southeast SmartCentre Calgary, AB 100.0 246,085 199,758 -
Drugs
Edmonton East SmartCentre** Edmonton, AB 95.7 180,100 94,835 - Walmart Supercentre, Safeway
SMARTCENTRES REAL ESTATE INVESTMENT TRUST
DECEMBER 2019 SUPPLEMENTAL INFORMATION PACKAGE 27INDIVIDUAL PROPERTY SUMMARY
Owned Owned
Non-Owned
Rentable Rentable
Property Location Occupancy Anchor Area(1) Anchors
Area Anchor Area(1)
(%) (sq. ft.)
(sq. ft.) (sq. ft.)
Edmonton Northeast
Edmonton, AB 95.1 274,353 161,925 - Walmart Supercentre
SmartCentre
Lethbridge II SmartCentre Lethbridge, AB 100.0 53,392 40,373 - Sobeys
Lethbridge SmartCentre Lethbridge, AB 96.1 331,151 194,564 95,000 Walmart Supercentre
Walmart Supercentre, Save-on-
St. Albert SmartCentre St. Albert, AB 97.8 251,329 197,101 91,737
Foods*, RONA*
Walmart Supercentre, Canadian
Sylvan Lake SmartCentre Sylvan Lake, AB 95.7 137,966 115,829 68,947
Tire*
Subtotal Alberta 96.9 1,474,376 1,004,385 255,684
SASKATCHEWAN
Golden Mile Shopping Centre Regina, SK 93.7 259,317 93,938 - Loblaws
Walmart Supercentre,
Regina East SmartCentre (I) Regina, SK 99.5 389,556 249,523 -
HomeSense, London Drugs
RONA, Real Canadian
Regina East SmartCentre (II) Regina, SK 100.0 198,134 107,608 130,000
Superstore*
Regina North SmartCentre Regina, SK 99.4 276,251 206,339 - Walmart Supercentre, IGA
Walmart Supercentre, Home
Saskatoon South SmartCentre Saskatoon, SK 100.0 380,642 194,210 109,084
Depot*
Subtotal Saskatchewan 98.7 1,503,900 851,618 239,084
MANITOBA
Kenaston Common
Winnipeg, MB 100.0 257,222 98,570 143,613 RONA, Costco*
SmartCentre
Winnipeg Southwest Walmart Supercentre, Home
Winnipeg, MB 96.2 494,665 281,606 95,000
SmartCentre Depot*, Safeway
Walmart Supercentre, Canadian
Winnipeg West SmartCentre Winnipeg, MB 99.3 354,679 171,146 75,240
Tire*, Sobeys
Subtotal Manitoba 98.1 1,106,566 551,322 313,853
SMARTCENTRES REAL ESTATE INVESTMENT TRUST
DECEMBER 2019 SUPPLEMENTAL INFORMATION PACKAGE 28INDIVIDUAL PROPERTY SUMMARY
Owned Owned
Non-Owned
Rentable Rentable
Property Location Occupancy Anchor Area(1) Anchors
Area Anchor Area(1)
(%) (sq. ft.)
(sq. ft.) (sq. ft.)
ONTARIO
Alliston SmartCentre Alliston, ON 100.0 170,770 151,709 - Walmart Supercentre
Walmart Supercentre, Canadian
Ancaster SmartCentre Ancaster, ON 94.7 264,783 163,794 74,018
Tire*
Walmart Supercentre, Reno
Aurora North SmartCentre(2) Aurora, ON 98.0 510,083 313,637 -
Depot
Aurora SmartCentre Aurora, ON 100.0 51,186 - - -
Barrie Essa Road Shopping
Barrie, ON 96.1 104,869 35,152 - Food Basics
Centre(2)
Barrie North SmartCentre Barrie, ON 100.0 234,701 160,727 81,373 Walmart Supercentre, Loblaws*
Walmart Supercentre, Sobeys,
Barrie South SmartCentre(2) Barrie, ON 100.0 413,784 243,629 -
Winners
Bolton SmartCentre Bolton, ON 97.1 242,444 161,864 - Walmart Supercentre
Walmart Supercentre, Home
Bracebridge SmartCentre Bracebridge, ON 100.0 142,501 115,779 90,000
Depot*
Bradford SmartCentre Bradford, ON 100.0 279,278 168,571 - Walmart Supercentre
Bramport SmartCentre (II) Brampton, ON 100.0 37,857 37,857 - No Frills
Brampton East SmartCentre Brampton, ON 100.0 360,695 243,610 - Walmart Supercentre, The Brick
Brampton North SmartCentre Brampton, ON 97.7 58,996 - 62,496 Fortinos*
Brampton Northeast
Brampton, ON 100.0 247,641 153,455 - Walmart Supercentre
SmartCentre
Kingspoint Shopping Centre Brampton, ON 96.7 184,186 78,307 - Giant Tiger, GoodLife Fitness
Walmart Supercentre*, Real
Brockville SmartCentre Brockville, ON 96.2 144,084 - 322,054 Canadian Superstore*, Home
Depot*
Burlington (Appleby)
Burlington, ON 100.0 151,115 100,646 - Toys R Us, LA Fitness
SmartCentre
Burlington North SmartCentre Burlington, ON 98.6 226,451 161,127 - Walmart Supercentre
Walmart Supercentre, RONA, LA
Cambridge SmartCentre (I)(2) Cambridge, ON 94.6 732,882 323,394 -
Fitness
Cambridge SmartCentre (II) Cambridge, ON 79.6 32,023 - 224,695 Canadian Tire*, Home Depot*
Carleton Place SmartCentre Carleton Place, ON 97.5 148,833 115,811 - Walmart Supercentre
Walmart Supercentre, Real
Chatham SmartCentre** Chatham, ON 98.4 154,545 101,053 91,275
Canadian Superstore*
SMARTCENTRES REAL ESTATE INVESTMENT TRUST
DECEMBER 2019 SUPPLEMENTAL INFORMATION PACKAGE 29INDIVIDUAL PROPERTY SUMMARY
Owned Owned
Non-Owned
Rentable Rentable
Property Location Occupancy Anchor Area(1) Anchors
Area Anchor Area(1)
(%) (sq. ft.)
(sq. ft.) (sq. ft.)
Walmart Supercentre, Home
Cobourg SmartCentre Cobourg, ON 99.0 197,928 142,634 85,433
Depot*
Cornwall SmartCentre Cornwall, ON 100.0 176,804 154,510 - Walmart Supercentre
Etobicoke (Index) SmartCentre Etobicoke, ON 96.8 188,059 107,838 - Sail, Marshalls
Walmart Supercentre, Home
Etobicoke SmartCentre(2) Etobicoke, ON 95.8 305,096 199,824 135,000
Depot*, Best Buy, Winners
Rexdale SmartCentre Etobicoke, ON 100.0 35,174 - 126,083 Walmart Supercentre*
Fergus SmartCentre Fergus, ON 100.0 109,652 95,035 - Walmart Supercentre
Fort Erie SmartCentre Fort Erie, ON 100.0 12,738 - 140,142 Walmart Supercentre*, No Frills*
Walmart Supercentre, Home
Guelph SmartCentre Guelph, ON 98.7 296,116 171,396 110,000
Depot*
Toronto Premium Outlets** Halton Hills, ON 99.4 252,625 - - -
Hamilton South SmartCentre Hamilton, ON 99.0 241,880 124,524 - Walmart Supercentre
Walmart Supercentre, Your
Huntsville SmartCentre Huntsville, ON 100.0 126,436 84,861 68,837
Independent Grocer*
Kanata SmartCentre Kanata, ON 100.0 201,548 155,739 - Walmart Supercentre
Laurentian Power Centre Kitchener, ON 100.0 35,200 - 220,978 RONA*, Zehrs*
Walmart Supercentre, Toys R
London East Argyle Mall(2) London, ON 100.0 424,990 224,281 -
Us, No Frills
Walmart Supercentre, Canadian
London North SmartCentre** London, ON 99.1 250,050 131,671 108,262
Tire*, Marshalls, Winners
London Northwest SmartCentre London, ON 100.0 36,214 - 137,316 Lowe's*
Markham East SmartCentre** Markham, ON 100.0 69,008 61,207 - Walmart Supercentre
Markham Woodside
Markham, ON 100.0 179,950 80,385 - Home Depot, Longo's*, Winners
SmartCentre**
Walmart Supercentre*, Canadian
Milton Walmart Centre** Milton, ON 97.6 116,716 - 227,896
Tire*
Burnhamthorpe SmartCentre Mississauga, ON 89.8 200,356 - - -
Creekside Crossing** Mississauga, ON 100.0 122,402 91,385 - Walmart Supercentre, Costco
Mississauga (Erin Mills)
Mississauga, ON 95.4 290,562 171,973 - Walmart Supercentre, No Frills
SmartCentre(2)
Mississauga (Go Lands) Real Canadian Superstore*,
Mississauga, ON 100.0 119,612 50,696 115,000
SmartCentre Toys R Us
SMARTCENTRES REAL ESTATE INVESTMENT TRUST
DECEMBER 2019 SUPPLEMENTAL INFORMATION PACKAGE 30INDIVIDUAL PROPERTY SUMMARY
Owned Owned
Non-Owned
Rentable Rentable
Property Location Occupancy Anchor Area(1) Anchors
Area Anchor Area(1)
(%) (sq. ft.)
(sq. ft.) (sq. ft.)
Walmart Supercentre, RONA,
Mississauga (Meadowvale)
Mississauga, ON 100.0 557,774 319,275 - Midhas Furniture Gallery,
SmartCentre(2)
Winners
Niagara Falls SmartCentre Niagara Falls, ON 99.0 249,745 183,698 - Walmart Supercentre
Real Canadian Superstore*,
401 & Weston Power Centre** North York, ON 100.0 108,406 58,071 180,000 Canadian Tire, The Brick, Best
Buy
Walmart Supercentre, Real
Oakville SmartCentre(2) Oakville, ON 100.0 461,226 314,588 -
Canadian Superstore
South Oakville Centre Oakville, ON 100.0 168,751 41,289 - Metro
Orillia SmartCentre Orillia, ON 100.0 241,659 165,902 - Walmart Supercentre
Walmart Supercentre, Canadian
Orleans SmartCentre (I) Orleans, ON 94.0 384,015 232,635 117,136
Tire*
Orleans SmartCentre (II)** Orleans, ON 100.0 41,435 - - -
Walmart Supercentre, Real
Oshawa North SmartCentre(2) Oshawa, ON 97.5 582,367 341,007 116,348 Canadian Superstore, Home
Depot*, Marshalls
Oshawa North SmartCentre (II) Oshawa, ON 100.0 163,259 34,109 - -
Ottawa (Laurentian Place)
Ottawa, ON 100.0 128,939 112,391 - Walmart Supercentre, Stantec
SmartCentre**
Walmart Supercentre, Loblaws,
Ottawa South SmartCentre** Ottawa, ON 97.5 252,003 156,471 -
Cineplex Odeon, Marshalls
Walmart Supercentre, Home
Owen Sound SmartCentre Owen Sound, ON 100.0 163,101 105,963 130,000
Depot*
Walmart Supercentre, Lowe's,
Pickering SmartCentre(2) Pickering, ON 97.7 441,179 314,838 82,000 Sobeys, Canadian Tire*, Toys R
Us
Port Elgin SmartCentre Port Elgin, ON 100.0 115,524 115,524 - Walmart Supercentre
Port Perry SmartCentre Port Perry, ON 100.0 138,789 92,473 - Walmart Supercentre
Walmart Supercentre, Food
Richmond Hill SmartCentre** Richmond Hill, ON 99.1 136,306 94,458 -
Basics
Rockland SmartCentre Rockland, ON 99.0 147,592 115,890 24,253 Walmart Supercentre, RONA*
Sarnia SmartCentre Sarnia, ON 100.0 342,617 214,513 - Walmart Supercentre
Scarborough (1900 Eglinton)
Scarborough, ON 98.5 380,090 254,693 - Walmart Supercentre, Winners
SmartCentre(2)
Walmart Supercentre, Cineplex
Scarborough East SmartCentre Scarborough, ON 97.7 282,156 225,385 -
Odeon
SMARTCENTRES REAL ESTATE INVESTMENT TRUST
DECEMBER 2019 SUPPLEMENTAL INFORMATION PACKAGE 31INDIVIDUAL PROPERTY SUMMARY
Owned Owned
Non-Owned
Rentable Rentable
Property Location Occupancy Anchor Area(1) Anchors
Area Anchor Area(1)
(%) (sq. ft.)
(sq. ft.) (sq. ft.)
Simcoe SmartCentre Simcoe, ON 100.0 139,919 111,294 - Walmart Supercentre
Hartzel Plaza St. Catharines, ON 100.0 67,972 34,522 - Food Basics
Walmart Supercentre, Canadian
Lincoln Value Centre St. Catharines, ON 98.9 307,877 214,891 -
Tire
Walmart Supercentre, Real
St. Catharines West
St. Catharines, ON 100.0 370,112 230,513 182,132 Canadian Superstore*, Canadian
SmartCentre (I)
Tire*, Best Buy
St. Catharines West
St. Catharines, ON 100.0 120,438 35,108 - The Brick
SmartCentre (II)
Walmart Supercentre, Real
St. Thomas SmartCentre St. Thomas, ON 100.0 224,390 138,567 196,212 Canadian Superstore*, Canadian
Tire*
Centennial Parkway Plaza Stoney Creek, ON 100.0 109,177 39,271 - Food Basics
Stoney Creek SmartCentre Stoney Creek, ON 100.0 257,064 228,795 - Walmart Supercentre, Toys R Us
Walmart Supercentre*, Canadian
Stouffville SmartCentre Stouffville, ON 100.0 162,968 69,283 162,633
Tire
Sudbury South SmartCentre Sudbury, ON 96.6 233,046 183,708 - Walmart Supercentre
Toronto Stockyards
Toronto, ON 100.0 8,615 - 128,194 Walmart Supercentre*
SmartCentre(2)
Westside Mall Toronto, ON 96.2 144,405 110,019 - Canadian Tire, FreshCo
Yorkgate Shopping Centre Toronto, ON 98.2 215,010 75,055 - No Frills, City of Toronto
Rutherford Village Shopping
Vaughan, ON 97.9 104,302 48,890 - Sobeys
Centre
Vaughan (400 & 7)
Vaughan, ON 97.5 243,858 124,989 100,000 Sail, The Brick, Home Depot*
SmartCentre
Waterloo SmartCentre Waterloo, ON 100.0 181,623 128,005 - Walmart Supercentre
Walmart Supercentre, Canadian
Welland SmartCentre Welland, ON 100.0 240,663 221,327 100,667
Tire*, RONA
Walmart Supercentre, Real
Whitby North SmartCentre Whitby, ON 99.5 279,153 178,841 148,571
Canadian Superstore*
Whitby Northeast SmartCentre Whitby, ON 100.0 39,249 - - -
Whitby Shores Shopping Centre Whitby, ON 100.0 85,602 39,919 - Metro
Windsor South SmartCentre Windsor, ON 98.5 231,811 129,121 - Walmart Supercentre
SMARTCENTRES REAL ESTATE INVESTMENT TRUST
DECEMBER 2019 SUPPLEMENTAL INFORMATION PACKAGE 32INDIVIDUAL PROPERTY SUMMARY
Owned Owned
Non-Owned
Rentable Rentable
Property Location Occupancy Anchor Area(1) Anchors
Area Anchor Area(1)
(%) (sq. ft.)
(sq. ft.) (sq. ft.)
Canadian Tire*, Fortinos*,
Woodbridge SmartCentre** Woodbridge, ON 95.6 216,936 32,630 142,073
Winners, Best Buy
Walmart Supercentre, Canadian
Woodstock SmartCentre Woodstock, ON 97.9 257,220 170,764 91,254
Tire*
Subtotal Ontario 98.4 18,611,166 10,916,766 4,322,331
QUEBEC
Blainville SmartCentre Blainville, QC 100.0 221,051 131,537 - Walmart Supercentre
Walmart Supercentre, Loblaws*,
Hull SmartCentre** Hull, QC 95.6 161,239 80,824 326,717 RONA*, Famous Players*, Super
C*, Winners
Kirkland SmartCentre Kirkland, QC 100.0 186,031 181,086 - Walmart Supercentre, The Brick
Lachenaie SmartCentre** Lachenaie, QC 100.0 143,325 78,432 - Walmart Supercentre
Walmart Supercentre, Canadian
Laval East SmartCentre Laval, QC 96.8 572,294 340,736 -
Tire, IGA
Walmart Supercentre, RONA,
Laval West SmartCentre Laval, QC 96.1 586,175 280,074 124,000
Canadian Tire*, IGA*
Mascouche North SmartCentre Mascouche, QC 87.1 62,801 - 120,000 RONA*
Walmart Supercentre, IGA,
Mascouche SmartCentre Mascouche, QC 99.4 407,799 261,834 -
Winners, Staples
Montreal Premium Outlets** Mirabel, QC 100.0 183,723 - - -
Montreal (Decarie)
Montreal, QC 100.0 132,434 83,858 - Walmart Supercentre, Toys R Us
SmartCentre**
Montreal North SmartCentre Montreal, QC 97.1 267,713 173,668 - Walmart Supercentre, IGA
Place Bourassa Mall Montreal, QC 91.3 267,862 130,323 - Canadian Tire, Super C
Walmart Supercentre, Home
Pointe Claire SmartCentre Pointe Claire, QC 98.4 372,760 234,402 -
Depot
Walmart Supercentre, Tanguay*,
Rimouski SmartCentre Rimouski, QC 98.8 223,696 127,087 104,973
Super C*
Walmart Supercentre, Home
Saint-Constant SmartCentre Saint-Constant, QC 98.5 361,611 202,613 95,000
Depot*, Super C
Saint-Jean SmartCentre Saint-Jean, QC 100.0 249,981 153,988 80,000 Walmart Supercentre, Maxi*
SMARTCENTRES REAL ESTATE INVESTMENT TRUST
DECEMBER 2019 SUPPLEMENTAL INFORMATION PACKAGE 33You can also read