October 2021 Road Show Presentation - IGD SiiQ
←
→
Page content transcription
If your browser does not render page correctly, please read the page content below
Road Show Presentation

                         October 2021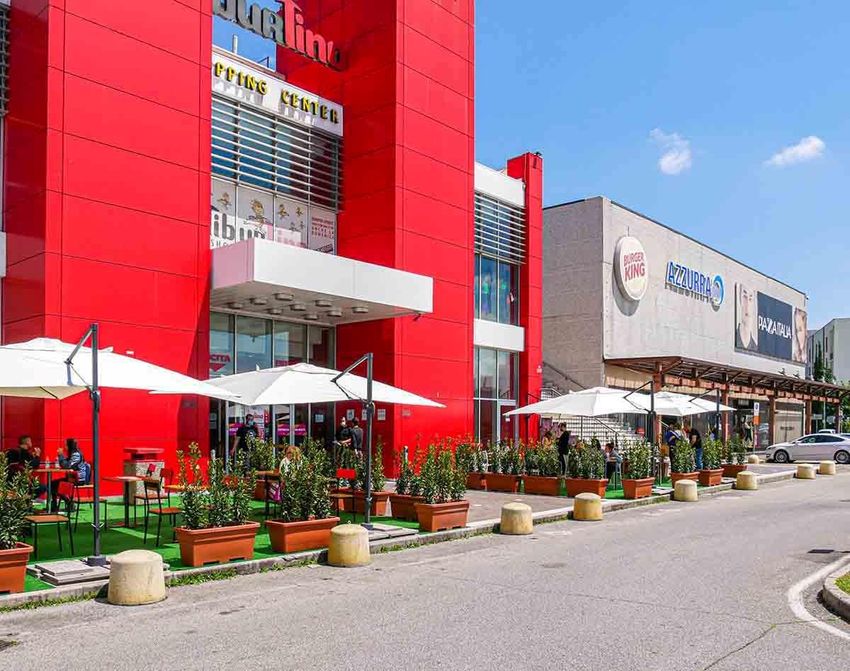
Disclaimer

  This presentation does not constitute an offer or an             These statements include financial projections and
  invitation t o subscribe for or purchase any securities.         estimates and their underlying assumptions, statements
                                                                   regarding plans, objectives and expectations with
  The securities referred t o herein have not been registered      respect t o future operations, products and services, and
  and will not be registered in the United States under the        statements regarding plans, performance.
  U.S. Securities A c t of 1933, as amended (the “Securities
  Act”), or in Australia, Canada or Japan or any other             Although the management of IGD SIIQ SPA believes
  jurisdiction where such an offer or solicitation would           that the expectations reflected in such forward-looking
  require the approval of local authorities or otherwise be        statements are reasonable, investors and holders of IGD
  unlawful. The securities may not be offered or sold in           SIIQ are cautioned that forward-looking information
  the United States or t o U.S. persons unless such                and statements are subject t o various risk and
  securities are registered under the Securities Act, or an        uncertainties, many of which are difficult t o predict
  exemption from the registration requirements of the              and generally beyond the control of IGD SIIQ; that
  Securities A c t is available. Copies of this presentation are   could cause actual results and developments t o differ
  not being made and may not be distributed or sent into           materially from those expressed in, or implied or
  the United States, Canada, Australia or Japan.                   projected by, the forward-looking statements.

  This presentation contains forwards-looking information          These risks and uncertainties include, bu t are not limited
  and statements about IGD SIIQ SPA and its Group.                 to, those contained in this presentation.

  Forward-looking statements are statements that are               Except as required by applicable law, IGD SIIQ does not
  not historical facts.                                            undertake any obligation t o update any forward-
                                                                   looking information or statements.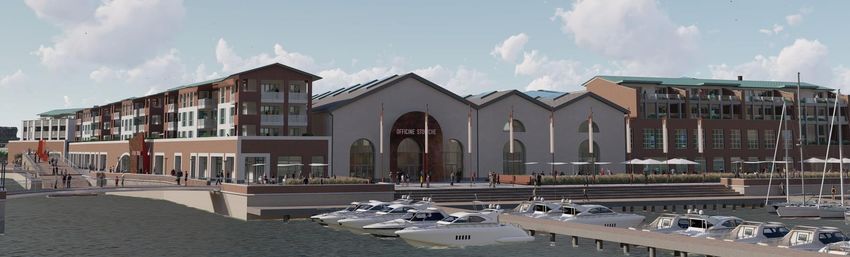
Index

   1    Introduction to
        IGD
                          Pag. 4
                                    5
                                    Financial results
                                                        Pag. 38

   2    Operating
        performances
                          Pag. 11   6   Outlook and
                                        dividend
                                                        Pag. 46

   3    Portfolio and
        projects
                          Pag. 23   7
                                    Appendix
                                                        Pag. 50

   4    Sustainability
                          Pag. 34

                                                                  3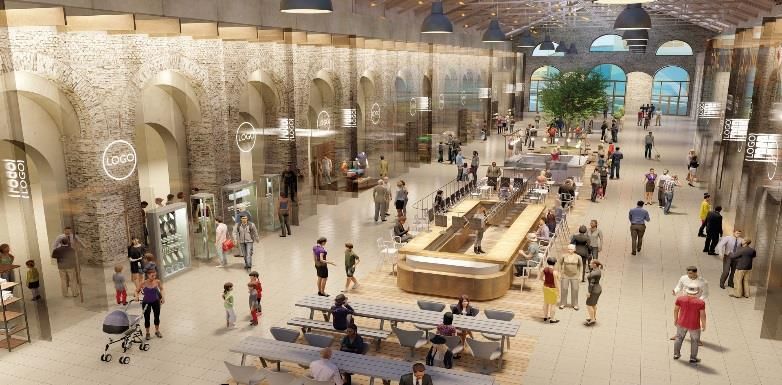
1
Introduction to IGD

IGD at a glance

IGD is one of the main players in the Italian retail real estate sector: we develop and manage shopping centres across
the country. We are also present in the retail sector in Romania
                           25 hyper/                                                                  14 shopping
27 shopping                                                                                                         Development
malls in Italy
                         supermarkets                                      c. €2.3bn                    malls in
                                                                                                                     & other(1)
                            in Italy                                                                   Romania
65% of value                                                                portfolio value                            4% of value
                           25% of value                                                               6% of value

Of which full ownership of 16 shopping
    centres (mall + hypermarket)

         5.3% EPRA NIY (2)                                                #1                            EPRA NRV:
         5.3% net initial yield topped-up                               Italian                         €10.56/share
                                                                         SIIQ
                                                                         (REIT)

         66.6% EBITDA margin(3)                                                                         FFO: €30.6mn

         95.3% financial                                                                          %     49.1% LTV
  %
         occupancy Italy
                                                                Sustainability        Financial
                                                                   Report              Report
                                                                 (6th year)          (3rd year)

                 Data as at 30/06/21 unless differently indicated
           (1)   Includes mainly the Porta a Mare project in Livorno
                                                                                                                                     5
           (2)   IGD’s portfolio average
           (3)   Margin from freehold properties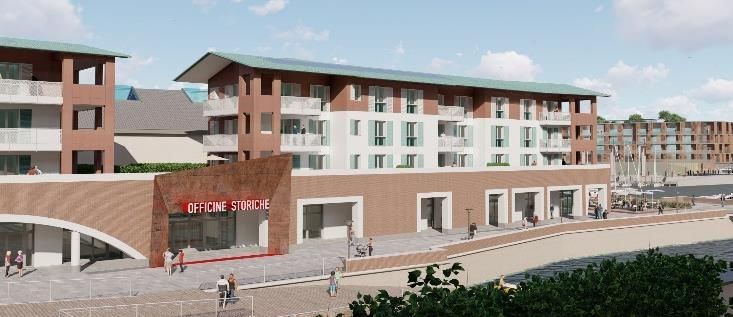
IGD Business Model
A distinctive competitive positioning in the fragmented
Italian retail real estate market

1           Well-diversified
            presence across Italy
                        39,2k                      PIL pro capite
                                                                    2   Strategic positioning
                                                                                                                3    Strong food anchor
                                                                                                                                                               4   Strong track record of
                                                                                                                                                                   direct management

                                                   €34,6k–€42,6k
                           1    30,9k
35,2k                                              €30,0k– €34,5k
                38,0k
                               5 33,1k             €20,6k– €29,9k                                                                                                           Services
                    3
        2                                          €16,8k– €20,5k
   30,3k 1
                        22 35,3k                        €28.500
            31,6k                                  Media italiana                                                                                                           Personal and
                        30,4k                                                        Ravenna
                                    7
                                 26,8k
                                                        €29.200                                                                                                             healthcare care
                           6 24,5k                  Media europea
            #              6           2
 n° di proprietà                   5 24,7k
                                           19,8k
                                                                                    4 km                                                                                    Local and
                            32,7k
                                             2
                                                      18,4k                                                                                                                 international
                                                                                                                                      Ipermercato
            20,6k
                                         18,2k      21,1k           Centro Commerciale                                                                                      brands
                                                                             ESP
                                                     17,2k

                                         17,5k
                                                                                                                                                                            Sharing economy
                                            4

                                                                                                                    The Food Hypermarket Plays a Critical        Proactive Approach, Carefully Selected
        Presence across all Italy, mainly in hte                       We strive to be the Dominant Retail
                                                                                                                  Attraction Role in Our Retail Assets Fresh     Merchandising Mix, Marketing Activity
          Northern regions. With Strategic Focus                     Destination in Mid-Sized Wealthy Italian                                                  Adapted to Each Context and Wide Offer of
                                                                      Cities, at Easy Reach from City Centre    food, Daily Shopping, Sticky Consumer Habits
         on High GDP per capita Mid-Size Cities                                                                                                                       Customer Related Services

                                                                                2 Average Gla: about 25,000 sqm
                                                                          M                                                                   Easily reachable: about 4 k m from city center

                          Modern portfolio                                          Catchment area: about 370,000                             N. Of average parking places: 2,013
                          Average age 10 years                                      inhabitants within 2 0 minutes                            Centers reached by public transport: 24 (89%)
                          (from opening/restyling
                                                                                    Average footfalls per center/year: 3.3
                                                                                    million*                                                  Centers reached by cycle path: 16 (59%)

                            * Data at 31 December 2019
                                                                                                                                                                                                           6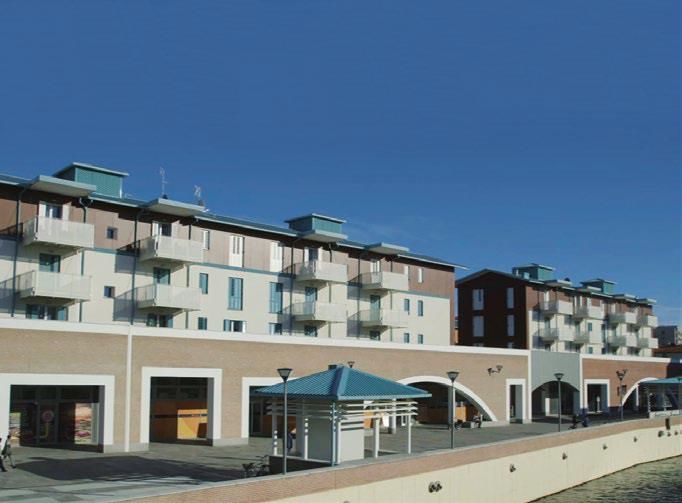
Group Structure (simplified)

                                                                  80.4% Revenues
                                              Parent Company      95% Financial debt
                                                                  86% Portfolio value

                                                                  13,.5% Revenues
       100%                                                       5% Financial debt
                                    Italian Facility Management
                                                                  6% Portfolio value

                                                                  5.5% Revenues
                             100%                                 No Financial debt
                                                      Romania
                                                                  6% Portfolio value

                             100%
                                                                  0.6% Revenues
                                        Development project in    No Financial debt
                                                      Livorno
                                                                  1% Portfolio value

     Data as at 30/06/2021
                                                                                       7
IGD’s shareholding structure

                No. of shares                                            Share capital                                     Net equity
                 110,341,903                                              € 650 Mn                                          € 1.1 Bn

                                                                                                                 Average 2021 daily trading
             Listed on STAR Segment of                                Avearage 2021 mkt                              (01/01 – 31/08):
               Italian Stock Exchange                               capitalization (01/01 –
                                                                      31/08) c. €427 mn                              c. 282,235 shares

                                                                                    Majority of institutional investors, of which ⁽1⁾
                     EUROPA PLUS (GWM)
                           4.50%
                                                                                                Italy
         Unicoop Tirreno
                                                                                    30%         Mediolanum, Banca d’Italia
             9.86%
                                                                                                 UK & Ireland
                                                                                    1%           Legal & General Group,
                                                                                                 Interactive Brokers

                                                                                                 US & Canada
                                                            Free float
                                                                                    42%          Vanguard, Blackrock
                                                             44.72%
                                                                                                 Luxembourg, Belgium, Netherlands

Coop Alleanza 3.0
                                                                                    2%           Banque et Caisse d’Epairgne,
                                                                                                 Banque Degroof
    40.92%
                                                                                                 France
                                                                                    5%           Societe Generale, BNP Paribas

                                                                                                 Rest of the world
                                                                                    20%          Codan Forsikring, Japan TRSV

                1. Internal processing by IGD                                                                                                 8
                All figures as at 31 December 2020 unless otherwise determined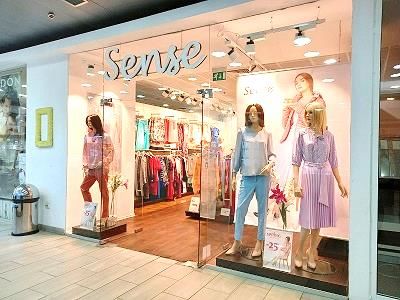
IGD Governance – Directors and Committees

IGD’s governance has been in line with the criteria of the Self Regulatory Code of Italian Stock Exchange since it was
listed. An internal Corporate Governance Code has been in use since 2008.

                                                                   CEO
 EXECUTIVE                                                         Claudio Albertini

                     CHAIRMAN                                                                                Timothy Guy
                     Rossella Saoncella       Antonio Rizzi                     Silvia Benzi                 Michele Santini
 NON EXECUTIVE
 INDEPENDENT
                    Rossella Schiavini                        Rosa Cipriotti                   Géry Robert-Ambroix

 NON EXECUTIVE             VICE CHAIRMAN
                           Stefano Dall’Ara                    Alessia Savino                       Edy Gambetti
 NON INDEPENDENT

 COMMITTEES:
                                                                                                    54.5% Male (6)
              Nominations and compensation Committee
                                                                                                    45.5% Female (5)
              Control and Risks Committee
              Committee for Related Parties Transactions                                             63.6% Independent (7)

 INTERNAL CONTROL AND RISK MANAGEMENT SYSTEM                                                        36.4% Non Independent (4)
 Held by the Ceo, including the Internal Audit and Risk Management

                                                                                                                                9
Our Top Management

Rossella Saoncella (1953) Chairman                                                     Claudio Albertini (1958) Chief Executive Officer
            •   Appointed as IGD’s Chairman on 20 April 2021                                       • Appointed in May 2009
            •   She was and executive of Conad Grouo until 1993                                    • IGD Board member since 2006
            •   She was General Manager of the Graranolo Group until 2011                          • Member of EPRA (1) Advisory Board since 2017
            •   Over the past few years she has held administrative offices                        • Member of ECSP’s (2) Nominations Committee since 2021
                for municipalities in Emilia Romagna and she has been a                            • More than 20 years of experience with Unipol Group, his last role
                Directors at HERA S.p.A.                                                             being General Manager of Unipol Merchant

Daniele Cabuli (1958) Chief Operating Officer                                          Roberto Zoia (1961) Director of Asset Management, development &
            • More than 20 years of experience in retail distribution                  network management
            • Joined IGD in 2008 as Network Management Director and has                            • Director of Asset Management and Development since 2006
              been COO since 2009                                                                  • Chairman of CNCC (3) since 2020
            • Worked for Coop Adriatica from 1986 with several roles: Head of                      • Joined GS Carrefour Italia Group in 1999 as Head of Hypermarket
              Projects in the Marketing Division (1989), Head of different                           and Shopping centres Development
              geographical areas and Hypermarket Manager (until 2003),                             • Head of Asset Management and Development for Carrefour Italia
              Director of Marketing and Commercial Development (from 2003)                           from 2005
                                                                                                   • Previously, Business Manager at Coopsette (from 1986)
Andrea Bonvicini (1963) Director of Finance Division
                                                                                       Carlo Barban (1978) Director of Administration, Legal & Corporate Affairs
              • Head of IGD Group's Finance Division since September 2009
              • In July 2012 he was appointed Director of Finance and                                • Director of Administration, Legal & Corporate Affairs since
                Treasury Department                                                                    January 2019
              • More than 20 years of professional experience in the world of                        • CEO of Winmarkt group in the period Apr 2014 – Dec 2018.
                credit, first in Cooperbanca and, after 1997, in the Bank of                           Worked in Winmarkt as Operating & Reporting Manager from
                Bologna                                                                                January 2009 with responsibilities also in administration,
                                                                                                       planning and control and finance
                                                                                                     • Previously worked as a qualified accountant and for international
Raffaele Nardi (1976) Director of Planning, Control and Investor
                                                                                                       consultancy companies
Relations
                                                                                                     • Graduated in Economics and Commerce
              • Head of the division to which 3 different departments report:
                planning, control and investor relations
              • Joined IGD in October 2010
              • Head of the Advisory Service of Unipol Merchant, bank of the
                Unipol Group, where he matured more than ten years of
                experience
              • Graduated in Business Economics

               1.
               2.
                     EPRA: European Public Real Estate Association
                     ECSP: European Counsel of Shopping Places
                                                                                                                                                                     10
               3.    CNCC: Consiglio Nazionale dei Centri Commerciali (National Council of Shopping Centers)
Titolo
titolo
2 Operating performances
note
37Operating performances in Italy
in 2020
Jan-20 Feb-20 Mar-20 Apr-20 May-20 Jun-20 Jul-20 Aug-20 Sep-20 Oct-20 Nov-20 Dec-20
Positive National Positive quick answer New restrictions*
start of the Lockdown when the restrictions
year were eased
IMPACTS ON IGD’S SC: IMPACTS ON IGD’S SC:
66 days of restrictions 21 days of restrictions
(weekends, holidays)**
IGD’S shopping centers always open
but with «non-essential» stores closed for 87 days throughout 2020
ON AVERAGE YEAR 2020 vs 2019:
Mall tenants sales -27.6%
Hypermarket sales -2.8%
Footfalls -29.5%
*Closure of cinemas, gyms, bars and restaurants + Regions variable coloring system based on changes in infection rates
** The 21 days of closure of non-essential activities on weekends and on holidays weight for approx. 40% of November and December tenant sales. 12Main trends
in the first 6 months of 2021
18/5
Jan Feb Apr May Jun
Mar Closed for 39% of the total
normal first easing of the possible days*
1H 2020 activties restr. lockdown restrictions €9.3 mn Covid one-off
impact estimated in 1H20
17/5
Jan Feb Mar Apr May Jun Closed for 36% of the total
1H 2021 towards possible days*
Restrictions and variable closures normality €7.8 mn Covid one-off
impact estimated in 1H21
1H2021 from 17/5 to 30/09
Δ progressive
vs 1H2020 vs 1H2019 vs 2020 vs 2019
FOOTFALLS +10.3% -29.4% +2.9% -15.9%
TENANT +23.4% -24.5 %
SALES
CNCC figure -29%
13
*Closing days for the «non-essential» activitiesMonthly trends 2021 vs 2019
10,0% TENANT SALES FOOTFALLS
3,7%
0,3%
0,0%
-2,4%
-10,0% -6,4%
-20,0%
-15,2% -15,4%
-24,2% -17,8%
-20,4%
-30,0% -24,3% -34,3%
-37,1% -41,4%
-40,0% -36,0%
-40,9%
-50,0% -46,1%
JAN FEB MAR APR MAY JUN JUL AUG
Good feedback on tenant sales in the
first 3 months of full operativity
(+0,01% Jun/Jul/Aug ‘21 vs
Jun/Jul/Aug ’19)
The trend already seen in the past months with fewer but more targeted visits continues:
average ticket August ‘21 equal to €25.8 (+24.0% vs Aug ’19; +1.6% vs Aug ‘20)
14Focus tenant sales
June, July and August 2021 vs 2019
* -15,8%
-19,1%
SERVICES
-20,6%
-25,2% • Positive trend
-23,8% RESTAURANTS
-24,8% confirmed for
6,3%
3,2%
14,5%
ELECTRONICS electronics,
-4,6% culture-leisure and
PERSONAL AND
-3,0%
HEALTHCARE
-4,6% household goods
7,7%
CULTURE, LEISURE,
4,7%
GIFT ITEMS
• Significant growth
6,1%
9,6% for clothing mainly
0,5% HOUSEHOLD GOODS
0,3% the most
2,4% CLOTHING
-3,1% important brands
4,6%
June July August
All types of surfaces from small to large (excluding restaurant)
are growing on average by +4.2%
Performance like-for-like June, July and August ‘21 vs ’19
15
*Weight in % of total rents 1H2021Leasing management
performance 1H2021
73.9%
MALLS of rental KEY MESSAGES
income
ITALY • Occupancy is improving in
Italy (+100bps vs FY20)
FINANCIAL and in Romania (+70bps vs
Renewals: 85
OCCUPANCY* FY20)
Turnover: 46
Downside: -1,0%
95.3% • No significant impacts on
rents in Romania with a
slight improvement
ROMANIA
Renewals: 153 FINANCIAL
OCCUPANCY
Turnover: 86
94.3%
Upside: +0,9%
26.1% • Always open
HYPERMARKETS of rental
income • SALES +1.3% vs 1H20
*malls + hypermarkets
16Collection rate
FY2020 and 1H2021*
2020 1H 2021
Collected c. 98%** Collected c.83 %***
▪ Monthly invoicing
Italian ▪ Positive impact on the
Portfolio ongoing negotiations
expected from Government
measures to support
tenants (see appendix)
Collected c.98% Collected c.93%
Romanian
Porfolio
*% on invoiced rents net of reductions and loss on receivables; figures updated at 3 September.
**95.3% collection rate gross of reductions and loss on receivables 17
***78.2% collection rate gross of reductions and loss on receivablesEffective leasing activities in Italy continues
to combat the negative impacts of Covid…
Leasing activity to re-commercialize the vacancy
mainly due to the effects of Covid
Some of the new openings
The End – Fonti del Corallo Pandora – Katanè Pepco – Centro Borgo, Centro Lame, Le Ceylon Store - ESP
Maioliche, Fonti del Corallo, La Favorita
Tramas - Puntadiferro Flor de Shamira - Casilino 3C Easy – Centro Borgo, Puntadiferrro Intimissimi - Maremà (GR)
18…and to answer to new
market trends
Introduced innovative and appealing brands
in line with the latest market trends and current needs
Restaurants Services/tech Events
Introduction of brands in line Introduction of high tech Organization of events, such
with new trends, brands and more services as fitness classes with
organization of specific areas like pharmacy and phone personal trainers outside the
and structures outside in repair shops shopping centers
many assets
Bio’s Cafè
Porta a Mare
Mi store
Tiburtino
Ristofficina TechShop
Centro d’Abruzzo Mondovicino
19Effective leasing activities in Romania continues
to combat the negative impacts of Covid…
Robust re-commercialization activity also in Winmarkt Portfolio
Sense- Galati
Venus – Ploiesti & Alexandria Madre Cucina – Ploiesti Tendresse - Ploiesti
Eurasia – Tulcea (next opening
Proline Estet – Piatra Neamt Medair- Slatina (April) Leonidas – Ploiesti (next opening
September)
(next opening August) September)
20IGD shopping centers to
serve the community
Vaccination hub: more than 100,000 doses
administered to date
• Shopping centers offer
large, organized,
supervised, regularly From 19/02- Perlaverde in
Riccione*
From 24/5 - La Torre and
from 3/6 Poseidon*
from 2/8 - ESP in Ravenna
sanitized and easy to in Palermo
reach spaces
New openings of the health and
• Ideal location for diagnostic center DYADEA (Unipol Group) in Centro Borgo (BO)
proximity healthcare
*Shopping center managed by IGD
21Our idea of shopping center
in the coming years
«Next Steps» projects: ideas for innovation
▪ The pandemic favored the acceleration of some transformations on-going in the retail world and, therefore, in the
Shopping Centers sector
• Two surveys* to better understand new visitors needs
«Next steps»
Targets
#1 Finding solutions #2 Integration of CRM #3 Personalization/
to answer to new and digital plan specificity
needs of the actions and
offering
*Carried out between the end of 2020 and February 2021: the first one over a sample of 5,000 students aged 12/19; the second 22
one over 8,100 between visitors and not in 13 IGD’s shopping centers3 Portfolio and projects
IGD: a portfolio of high
quality assets

                                                          Centro Sarca
                                North                   Sesto S.Giovanni
                                                                                Esp           Le Maioliche        Centro Borgo       Centro Lame           Puntadiferro
                                                              (MI)            Ravenna         Faenza (RA)           Bologna           Bologna                 Forlì

        IGD - Main                                      Centro Leonardo         Conè          Centro Piave
                                                                                              San Donà di
                                                                                                                     Clodì            Centro Nova
                                                                                                                                     Villanova di
                                                                                                                                                           Mondovicino
                                                                                                                                                             Sc&Rp
                                                          Imola (BO)       Conegliano (TV)                       Chioggia (VE)
        Italian Asset                                                                         Piave (VE)                            Castenaso (BO)        Mondovì (CN)

                                        Nuova Darsena      Millennium        La Favorita       Gran Rondò         Lungo Savio       Centro Luna              I Bricchi
                                                            Gallery
                                           Ferrara       Rovereto (TN)        Mantova          Crema (CR)           Cesena           La Spezia          Isola d'Asti (AT)

                      Piazza Mazzini       Tiburtino       Maremà           Centro Porto     Cttà delle Stelle   FontiFonti
                                                                                                                      del Corallo      Casilino               Centro
                                                            Maremà                                                          del
Center                   Livorno        Guidonia (RM)      Grosseto
                                                                               Grande
                                                                                              Ascoli Piceno         Livorno
                                                                                                                       Corallo
                                                                                                                                       Caslino
                                                                                                                                       Roma
                                                                                                                                                            d'Abruzzo
                                                                                                                                                         Centro d’Abruzzo
                                                           Grosseto         Porto d'Ascoli                                             Roma                  Pescara
                                                                                                                                                             Pescara
                                                                                                                      Livorno

                                                                             >75% of the market value
                        Le Porte
                                          La Torre         Katané               of Italian Malls and             Future                        Offcine Storche
                                                                                                                                              Officine Storiche
South                   di Napoli                                                                                                                   Livorno
                     Afragola (NA)        Palermo          Catania           Hypermarkets dominant⁽1⁾            Opening                          Livorno
                                                                              in respective catchment
                                                                                        areas

                                                                                                                                                                   24
                1. Dominant assets: assets that are reference points for the consumers in their catchment area in terms
                of attractivity and offer quality
                   Key assets malls with> € 7 0 m n mkt value
The main characteristics of our portfolio
2,267.9 € mn 42% of this portfolio consists of 8 “Key” assets
of which 6 are Shopping centres (mall + hypermarket)
Other 4.3%
(96.29 €mn)
Romania 6.1%
(137.52 €mn)
Romania
On average every shopping centre is 10 years old
6.1% North western Italy (last restyling/opening)
15.4%
Southern Italy
11.4%
Malls 64,9% Full ownership of 16 Shopping centres (mall+hyper) in Italy
(1,472.29 €mn) (60.8% of Italy core market value)
Central Italy
26.7%
North eastern
Italy
40.4%
18 out of 25 Hyper/Super in Italy are small
(sales areaIGD’s portfolio market value
(1/2)
Gross Initial EPRA Net Initial EPRA Net Initial Finan
FY 2020 1H 2021 Δ%
Yield Yield Yield topped up occupa
Malls Italy 1,473.30 1,472.29 (-0.07%) 6.60% 93.67
5.3% 5.3%
Hypermarkets Italy 558.97 561.78 + 0.50% 6.01% 100.0
Romania 138.64 137.52 (-0.81%) 7.49% 5.9% 6.0% 94.28
Porta a Mare + development + other 94.78 96.29
Total IGD's portfolio 2,265.69 2,267.88 + 0.10%
Leasehold properties (IFRS16) 43.32 37.69
Total IGD's portfolio including leasehold 2,309.01 2,305.57 (-0.15%)
26IGD’s portfolio market value
(2/2)
ITALY ROMANIA
€ 2,267.9mn
€ 2,265.7mn
Other 4.2% 4.6 -2.4 4.4 -3.3 0.5 -1.6 Other 4.3%
(94.78 €mn)
(96.29 €mn)
Romania 6.1%
4.4
Romania 6.1%
(138.64 €mn) 4.6 -2.4 -3.3 0.5 -1.6 (137.52 €mn)
2,265.7
Malls
65.0% 2,267.9
Malls 64,9%
(1,472.29 €mn)
(1,473.30 €mn)
2,265.7 2,267.9
Hyper 24.7% Hyper 24.8%
Asset value
(558.97 €mn)at Projects and capex Italy Change in market value Projects and capex Change in market value Projects and Capex Change in market value Asset value
(561.78 €mn)at
31/12/2020 Italy Porta Medicea Porta Medicea Romania Romania 30/06/2021
Asset
FY2020 value at Projects and capex Italy Change in market value Projects and capex Change in market value Projects and Capex Change in market value Asset value at
1H2021
31/12/2020 Italy Porta Medicea Porta Medicea Romania Romania 30/06/2021
27EPRA Metrics
Euro per share 1H 2021 FY 2020 Δ%
NRV 10.56 10.38 1.7%
NTA 10.48 10.31 1.7%
NDV 10.19 10.42 -2.1%
0.28 -0.11 0.01
10.38 10.56
EPRA NRV 31/12/2020 FFO Change in fair value assets Change in financial EPRA NRV 30/06/2021
instrument fair value and
other
Some figures may not add up due to rounding 28Flexible and sustainable
asset management
2020 2021/2022
✓ In order to strenghten the Group’s financial ✓ Priorities: non defferable activities,
solidity some projects and capex were extraordinary maintenance, update of
postponed as early March 2020. systems as well as fit out adaptations in order to
continuosly attract tenants and visitors.
✓ Lower cash-out for approx. €40mn ✓ Our asset type enables us to be flexible in
compared to what expected for the year offering spaces for different uses like flagships
for physical and/or online sales, logistics
hubs…
No major transformations/reconversions
are necessary, just few adjustmens in the
2020 Total Investments €18.3mn
merchandising mix
1H21 Total Investments €10.6mn
29Pipeline
CENTRO CASILINO PORTO GRANDE LA FAVORITA
Project
Mall Restyling and Mall Restyling and
Hypermarket Hypermarket Mall Restyling
Remodelling Remodelling
Restyling of the external Reduction in the
façade and internal areas hypermarket area and Restyling of the
together with seismic creation of new retail façade, the internal
Description improvement measures areas and the car park
units in the mall; center
on the Ground Floor and restyling (project by
First Floor Lombardini 22)
End of work 1H 2022 End of 2022 End of 2022
30Porta a Mare: an ambitious
multifunctional project Lips Molo Mediceo Arsenale
Livorno, touristic Port
(Hotel, residential, entertainment and
Officine Storiche
services for the port)
(retail, food court, residential)
Focus next slide
Piazza Mazzini
Palazzo Orlando
(retail, residential)
Retail owned by IGD and
already operational since 2016; (Offices)
residential fully sold Sold on 30/09/2019
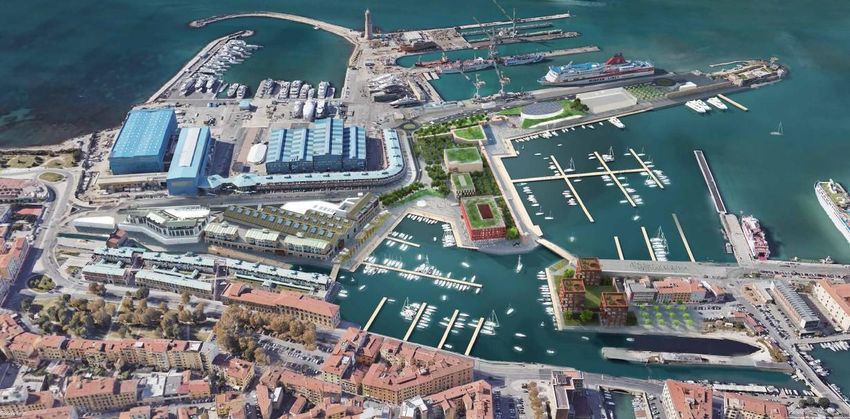
31Porta a Mare:
Officine Storiche
The heart of the project
End of work:1H2022
Total expected investment retail area : € 53 mn
(of which remaining € 11mn*)
Total surfaces: 20k sqm, of which 15k sqm
dedicated to retail
Stores: 30 + 10 restaurants + 1 fitness center
*Data at 31/03/2021
32Residential areas
Piazza Mazzini Officine storiche
73 flats already sold
42 seafront flats
(flats with garden, flats with terrace,
(15 preliminary purchase agreements signed)
duplex terraced houses)
334 Sustainability
Sustainability: committment continues
  despite the pandemic
  Most short-term goals achieved, work in progress on the medium/long-term targets.

 GREEN                    RESPONSIBLE                         ETHICAL                   ATTRACTIVE                       TOGETHER
• €1.2mn invested in     • Stable level of                 • UNIISO37001 «Anti         • Digital Plan defined and    • Dialogue with the
  energy efficiency        employment and                    bribery management          existing shopping centers     stakeholders
  measures                 Corporate Welfare Plan            system» certification       web instruments               strengthened for a more
• 19 EV charging           confirmed                         obtained in Italy           (websites and social          unitary emergency
  stations installed     • Training activity for all the   • Second renewal of three     networks) updated to          management: for ex.
• ISO14001                 employees and a new               stars Legality Rating       increase contacts with        Post lockdown surveys
  certification for 4      activity of «Virtual Team»        obtained (maximum score     visitors                      had been carried out to
  more shopping            tested                            awarded)                  • Communication Campaign        better understand the
  centers and Breeam     • Implemented measures            • Code of Conduct and         realized to reassure          visitors’ needs
  in Use certification     for the safety of                 Organizational              visitors about the safety
  for 3 more shopping      employees and visitors            Management and Control      and the offering of the
  centers                  both in the headquarters          Model updated               shopping centers post
                           and in the shopping             • Adhesion to United          lockdown
                           centers                           Nations Global Compact

                                                                                                                                       35
Some of the results achieved
Level of satisfaction of
IGD shopping centers’ visitors
3.9
(scale 1min. - 5max.)
Co2 Emissions intensity 2020-2012
(KgCo2/Mq)
-36.1% The structured engagement of all
stakeholders allows IGD to
understand their expectations and
evaluate if integrate them in its
strategy
2020 Turnover rate
ISS QuickScore evaluation on
2.3% governance risk (1 lowest risk-10 highest risk)
1 (2021)
36IGD sustainability in the national and
international context
PARTICIPATION IN NATIONAL AND INTERNATIONAL ORGANISATIONS AND EVENTS ON SUSTAINBILITY
Universities lectures
and testimonies
Member of the EPRA Member of the Chairman of the ESG Member of Impronta IGD is called to spoke
Sustanability committee Sustainability Group Commission Etica since 2010. about its CSR path at
since 2018. Impronta Etica (non- university classes and
profit organisation Masters
that aims to promote
and develop the CSR)
INTERNATIONAL AWARDS AND BENCHMARK
Stock Indices Sustainability rating (ESG) Awards (2021)
6 independent and unsolicited ratings in 2020 • Sustainability Leader 2021
(4 in 2019) (Sole 24 Ore)*
• Gaia Rating
• Refinitiv • 3° at the Confindustria contest
• MSCI «Best Performer for circular
economy» with the
• ISS ESG
5 stock indices with Waste2Value project
focus on sustainability • S&P Global
• Vigeo Eiris
• Among the 40 most green
Growing (or in line) scores companies listed on Italian
Stock Exchang according to
Refinitivv
*analysed the Corporate Social Responsabilty (CSR) of more than 400 companies in Italy. To that end, more than 30 KPIs regarding environment,
social and economic have been examined. 150 companies have been awarded. 375 Financial Results
FY 2020 and 1H2021
main results

                                                       FY 2020               1H 2021
                                                                   vs 2019              vs 1H 2020
REVENUES
 Rental Income                                         €145.6 mn    -6.2%    €73.1 mn     -2.1%
 Net Rental Income                                     €109.5mn    -19.8%    €55.5 mn     -1.4%

EBITDA
 EBITDA (Core Business )                               €99.4 mn    -20.6%    €50.6 mn    -1.6%
 EBITDA Margin (Core Business)                          65.4%      -121pts    66.3%      +20pts
 EBITDA Margin From Freehold                            65.3%                 66.6%

GROUP NET PROFIT                                       €-74.3 mn    n.a.     €19.5 mn      n.a.

Core Business Funds From Operations (FFO)              €59.3 mn    -28.8%    €30.6 mn    -6.8%
Core Business FFO per share *                            0.54                  0.28

 Results impacted by the exceptional containment measures adopted in Italy to limit the spread of
 Covid-19

                                                                                                    39
          1. Calculated on the year-end no. of share
Net Rental Income
(€mn)
Italy
-€8.6mn -19.9% -€27.1mn
-6.3% Romania -19.8%
-19.3%
-5.3 -3.3
-18.5*
136.6
FY2020 128.0
109.5
Net rental income 2019 Change in rental income Change in rental costs Net rental income 2020 adj COVID net direct impacts Net rental income 2020
Italy
-2.3%
-0.8€mn
Romania
-1.4%
-+13.2%
-2.0 -0.3 1.5
1H2021 56.3
Improvement of 2021 Covid
impact compared to prior year, 55.5
difference between the total
impact of 1H2020 (9.3 €mn)
and 1H2021 (7.8 €mn).
Net rental income 1H 2020 Change in rental income (gross of Covid discounts) Change in rental costs Change in COVID net direct impact Net rental income 1H 2021
*Covid-19 net direct impacts include Covid temporary reductions already granted for €4.4mn and Covid effects included in direct costs for €14.1mn.
40
Some figures may not add up due to rounding.Financial management
(€mn) 5.4 3.8
5.4 3.8 2.8
3.8 2.8
2.8 Total Total
€ 36.8mn € 36.2mn
-4.7%
Negative carry
31.0 5.4 29.6 3.8
€400mn bond issue + SACE
31.0 29.6 2.8
29.6 IFRS16 and
non-recurring charges
FY2020
31.0 29.6
FY 2019 FY 2020 Finacial Mgt. Adj:
FY 2019 FY 2020 -€1.4mn vs 2019 (-4.7%)
FY 2020
Financial management Adj. IFRS16 and non-recurring charges Negative Carry
management Adj. IFRS16 and non-recurring charges Negative Carry
FY 2019 FY 2020
ecurring charges Negative Carry
Total
Financial management Adj. TotalNegative Carry
IFRS16 and non-recurring charges
€ 18 mn -6.4% € 16,7mn
1,3 IFRS16 and
1,1
non-recurring charges
1H2021
16,6 15,6
Financial Mgt. Adj * : -1.0 mn vs
Financial management adj* 2020 (-6.4%)
IFRS16 and non-recurring charges
1H 2020 1H 2021
*Financial Management adj: net of IFRS16 and IFRS9 (0.9€mn), non-recurring charges
Some figures may not add up due to rounding 41Funds From Operations
(FFO)
-€5.5mn -€24.0mn
-6.6% -28.8%
-7.3
1.4 0.2 FFO p.s.
-18.5 0.54€
83.3
77.8
FY2020 59.3
FFO_2019 Change in core
business Ebitda adj*
1 Change in financial Change in taxes and
management adj other
FFO_2020 adj COVID net direct
impacts
FFO_2020
-2.3€mn
-6.8%
-0.9
-1.2 -0.1
32.9
30.6
1H2021
FFO 1H 2020 Change in core business Change in financial Change in taxes and other FFO 1H 2021
EBITDA Adj* management Adj**
1 Change in core business Ebitda Ad (fy20)j: equal to change in core business Ebitda adjusted by approx. €0.7mn of non recurring expenses.
*Change in core business Ebitda
PerAdj
recurring marketing expensens
(1Q21):dell’FFO
il calcolo equal to change core business
sono state Ebitdaleadjusted
considerate by passive
locazioni approx. 0.9mn estimated
e rettificato lowerdella
il dato leasing rents and
gestione +0.2 €mn of 2020 non-
finanziaria 42
**Financial management adj (1Q21): net of IFRS16, IFRS9, non-recurring charges net of negative carryFinancial structure
31/12/2020 30/06/2021
LTV 49.9% 49.1%
• Net debt improved in 1H2021
ICR 3.2X* 3.2X* (-€20.66 mn vs FY2020)
Average cost of • LTV is slightly decreasing
2.30% 2.22%
debt
Net Debt
Debt breakdown** 1,134.80 € mn***
SECURED
MARKET 25.0%
57.2%
BANKING
SYSTEM
42.8% L.T.
1,178.58
UNSECURED
75.0%
CASH
-43.78
*Excluding the effect of the last financial transaction; 43
**Debt calculated excluding the effect of IFRS16
***Net debt including IFRS16 effect (if excluded €1,090.4 mn)Debt maturity
Ratings
€100mn: 2.25% 7y
€400mn: 2.125% 5y
500
BBB- negative outlook
2.1%
5y*
2.65%
7y
209
209
153.6
BB+ negative outlook
9
9 9
2 9 7
2 67 53 7 44
29 25 67 53 27 6 44
29 25 27 6
2021 2022 2023 2024 2025 2026 >2026
2021 2022 2023 2024 2025 2026 >2026
Debito bancario secured debito bancario unsecured Bonds
secured bank debt unsecured bank debt Bonds
*rate and duration refers to 200€mn loan
44On-going process on disposals to
rebalance the financial structure
✓ Consistent with 2019-2021 Strategic Plan, the procedure for the disposal of
a portfolio of stand-alone hypermarkets/supermarkets was started
✓ Mandate granted to CBRE, a premiere international advisor
Asset class with a Attractive Stable cash-flow
good appeal on Net Initial yield with long-term
the market leases
The proceeds from the transaction will be used to reduce the
Loan-To-Value and strenghten the financial structure
456 Outlook and dividend
Outlook

                                                             Guidance FFO ‘21 vs ‘20

                                                                                        +7/8%
In view of the positive signs of recent
months, in a context of economic and                            +3/4%
consumption recovery and taking into
account the Covid-19 impact estimated
for the current year, the 2021 FFO
outlook has been revised from
+3/4%, announced on 25 February, to
+7/8% (not considering any disposal)

                                                                 Previous
                                                                 febbraio '21                    agosto '21
                                                                                        NEW GUIDANCE
                                                                 guidance

   There are still elements of uncertainty on this outlook, even beyond the control of the Group, such as, for
   example, the emergence of new pandemic waves and the introduction of new restrictive measures.

                                                                                                                 47
Dividend
2020 Next few years
✓ Loss of the Parent company IGD SIIQ SPA ✓ As soos as external conditions allow, IGD
✓ Safeguard of the financial stability and the intends to resume paying dividends and
investment grade profile providing its shareholders with attractive
remuneration
NO DIVIDEND IGD share remains
DISTRIBUTION a «dividend play»
Decision triggered by
exceptional circumstances
48Final remarks
Urban shopping centers with an attractive food anchor resiliency
confirmed
Operating performance recovery paving the way for a better 2H;
FFO guidance raised
Italian GDP growth expected: about +6% in 2021, +4% in 2022
49Titolo
titolo
7 Appendix
note
65Consolidated income
statement
GROUP CONSOLIDATED (a) (c) Δ
1H_CONS_2020 1H_CONS_2021 (c)/(a)
Revenues from freehold rental activities 68.7 66.9 -2.6%
Revenues from leasehold rental activities 5.9 6.2 3.9%
Total income from rental activities 74.6 73.1 -2.1%
Rents and payable leases 0.0 0.0 -0.3%
Direct costs from rental activities -18.3 -17.6 -4.2%
Net rental income 56.3 55.5 -1.4%
Revenues from services 3.1 3.3 4.4%
Direct costs from services -2.5 -2.7 6.9%
Net services income 0.6 0.6 -5.7%
HQ Personnel expenses -3.1 -3.3 8.4%
G&A Expenses -2.4 -2.1 -12.1%
CORE BUSINESS EBITDA (Operating income) 51.4 50.6 -1.6%
Core business Ebitda Margin 66.1% 66.3%
Revenues from trading 0.5 0.4 -2.2%
Cost of sale and other costs from trading -0.8 -0.7 -22.9%
Operating result from trading -0.4 -0.2 -46.3%
EBITDA 51.0 50.4 -1.2%
Ebitda Margin 65.2% 65.7%
Impairment and Fair Value adjustments -73.6 -12.5 -83.1%
Depreciation and provisions -0.5 -0.5 5.5%
EBIT -23.0 37.4 n.a.
FINANCIAL MANAGEMENT -18.0 -16.7 -6.9%
ENTRAORDINARY MANAGEMENT -0.1 0.0 n.a.
PRE-TAX RESULT -41.1 20.7 n.a.
Taxes 2.2 -1.3 n.a.
NET RESULT OF THE PERIOD -38.8 19.5 n.a.
(Profit/Loss) for the period related to third parties 0.0 0.0 n.a.
GROUP NET RESULT -38.8 19.5 n.a.
51Funds From Operations
(FFO)
Funds from Operations CONS_2020 CONS_2021 Δ 2020 Δ%
Core business Ebitda 51.4 50.6 -0.8 -1.6%
IFRS16 Adjustments (payable leases) -4.3 -4.2 0.1 -1.6%
Financial management Adj -13.9 -15.2 -1.2 8.9%
*
Extraordinary management Adj 0.0 0.0 0.0 n.a.
Gross margin from trading 0.0 0.0 ** 0.0 n.a.
Current taxes for the period Adj -0.5 -0.6 -0.1 22.9%
FFO 32.7 30.6 -2.1 -6.4%
Una tantum Marketing 0.2 0.0 -0.2 n.a.
FFO 32.9 30.6 -2.2 -6.8%
52Reclassified balance
sheet
Sources - Uses of funds (€/000) 30/06/2021 31/12/2020 Δ Δ%
Fixed assets 2,229,892 2,234,484 -4,591 -0.2%
Assets under construction 42,757 42,674 82 0.2%
Other non-current assets 17,714 17,374 340 2.0%
Other non-current liabilities -29,767 -30,371 604 -2.0%
NWC 33,435 30,421 3,014 9.9%
Net deferred tax (assets)/liabilities -11,774 -10,286 -1,489 14.5%
TOTAL USE OF FUNDS 2,282,257 2,284,296 -2,039 -0.1%
Net equity 1,136,234 1,114,442 21,792 2.0%
Net (assets)/liabilities for derivative instruments 11,220 14,396 -3,176 -22.1%
Net debt 1,134,803 1,155,458 -20,655 -1.8%
TOTAL SOURCES 2,282,257 2,284,296 -2,039 -0.1%
GEARING RATIO (€000)
1.03 0.99
1,125,417 1,144,569
1,155,458 1,134,803
2020 2021
Net debt Adj. Net equity
53EPRA Net Asset Value
30/06/2021 31/12/2020
Net Asset Value EPRA NRV EPRA NTA EPRA NDV EPRA NRV EPRA NTA EPRA NDV
IFRS Equity attributable to shareholders 1.136.236 1.136.236 1.136.236 1.114.442 1.114.442 1.114.442
Exclude:
v) Deferred tax in relation to fair value gains of IP 17.743 17.743 16.989 16.989
vi) Fair value of financial instruments 11.220 11.220 14.396 14.396
viii.a) Goodwill as per the IFRS balance sheet (8.283) (8.283) (8.533) (8.533)
viii.b) Intangibles as per the IFRS balance sheet (100) (36)
Include:
ix) Fair value of fixed interest rate debt (3.086) 43.625
NAV 1.165.199 1.156.816 1.124.867 1.145.827 1.137.258 1.149.534
Fully diluted number of shares 110.341.903 110.341.903 110.341.903 110.341.903 110.341.903 110.341.903
NAV per share 10,56 10,48 10,19 10,38 10,31 10,42
Change % vs 31/12/2020 1.7% 1.7% -2.1%
54Other Epra metrics
EPRA Performance Measure 30/06/2021 31/12/2020
EPRA NRV (€'000) 1.165.199 1.145.827
EPRA NRV per share € 10,56 € 10,38
EPRA NTA 1.156.816 1.137.258
EPRA NTA per share € 10,48 € 10,31
EPRA NDV 1.124.867 1.149.534
EPRA NDV per share € 10,19 € 10,42
EPRA Net Initial Yield (NIY) 5,8% 5,8%
EPRA 'topped-up' NIY 5,8% 5,9%
EPRA Vacancy Rate Gallerie Italia 6,3% 7,6%
EPRA Vacancy Rate Iper Italia 0,0% 0,0%
EPRA Vacancy Rate Totale Italia 4,7% 5,7%
EPRA Vacancy Rate Romania 5,7% 6,5%
EPRA Performance Measure 30/06/2021 30/06/2020
EPRA Cost Ratios (including direct vacancy costs) 19,7% 18,9%
EPRA Cost Ratios (excluding direct vacancy costs) 16,9% 16,5%
EPRA Earnings (€'000) € 33.493 € 32.772
EPRA Earnings per share € 0,3 € 0,3
55More financial highlights
31/12/2020 30/06/2021
Gearing ratio
1.03X 0.99X
Average lenght of long term debt 3.2 years 2.9 years
Hedging long term debt + bond 93.0% 92.9%
Share of M/L debt 98.3% 85.3%
Uncommitted credit lines
granted 151€ mn* 151€ mn*
Uncommitted credit lines
available 151€ mn 151€ mn
Committed credit lines granted
60 € mn 60 € mn
and available
Encumbered assets 1,434.9€ mn 1,431.8€ mn
* Some banks allowed us to transform them in medium/long-term not granted credit lines. 56Contratti e key tenants
Italia
Malls
Product Turnover
TOP 10 Tenant Contracts
category Impact N 183 N 206 N 279
N 144 N 587
clothing 2.9% 14
18.8% 46.1%
10.5% 10.1% 14.5%
clothing 2.7% 10
2021 2022 2023 2024 >2024
electronics 2.0% 8
Average residual maturity: 4.0 years
clothing 1.6% 23 Total contracts: 1,399 of which 85 renewals with the same tenant
and 46 signed with a new tenant
Downside -1.0%
personal care 1.6% 16
Rotation Rate 3.0% (% new tenants on tot. contracts)
clothing 1.6% 28
Hypermarkets
jewellery 1.4% 26 N 25
shoes 1.3% 5
jewellery 1.3% 20
clothing 1.3% 9
Average residual maturity: 14.2 anni
Total 17.7% 159
Total contracts: 25
57Contratti e key tenants
Romania
Product Turnover
TOP 10 Tenant Contracts
category Impact
Winmarkt
supermarket 10.7% 11
N 142 N 252 N 60 N 26 N 67
clothing 6.5% 6
clothing 5.4% 10
clothing 4.4% 11
drugstore 2.7% 5
personal care 2.2% 4
jewellery 2.0% 5
Average residual maturity: 4.6 years
offices 1.7% 1
Total contracts: 547 of which 153 renewals with the same tenant
restaurants 1.4% 1 and 86 signed with a new tenant
Upside 0.93%
entertainment 1.2% 1 Rotation Rate 15.7% (% new tenants on tot. contracts)
Total 38.2% 55
58Merchandising &
Tenants Mix
Italia Romania
Household
Restaurant Culture, leisure, gift Household goods
goods
9% 7% items 5% Supermarkets
Culture, leisure,
3% 11% Electronics
gift items Electronics Personal care
7% 12% 2%
4%
Personal care
Service
5%
10%
Service Merchandising
7%
Mix* Restaurant
7%
Entertainment
4% Clothing
Other 41%
4%
Clothing
50%
Entertainment
13%
Local brands International
13% brands
Local brands 39%
International 44%
brands
39%
Tenant
Mix*
National
brands
National brands
47%
17%
*internal processing on GLA sqm 59Italian Portfolio:
hypermarkets and shopping malls
27 shopping malls 25 hypermarkets Tenants of hypermarkets
Centro D'Abruzzo - Pescara Centro D'Abruzzo - Pescara Coop Alleanza 3.0
Clodì - Chioggia Clodì - Chioggia Coop Alleanza 3.0
Porto Grande - Porto d'Ascoli (AP) Porto Grande - Porto d'Ascoli (AP) Coop Alleanza 3.0
ESP - Ravenna ESP - Ravenna Coop Alleanza 3.0
Centro Borgo - Bologna Centro Borgo - Bologna Coop Alleanza 3.0
Conè Retail Park - Conegliano (TV) Conè Retail Park - Conegliano (TV) Coop Alleanza 3.0
Le Maoliche - Faenza Le Maoliche - Faenza Coop Alleanza 3.0
Full ownership
Lungo Savio - Cesena Lungo Savio - Cesena Coop Alleanza 3.0
16 shopping centres Città delle Stelle - Ascoli Piceno Città delle Stelle - Ascoli Piceno Coop Alleanza 3.0
(mall + hypermarket) Katanè - Catania Katanè - Catania Coop Alleanza 3.0
Centro Lame - Bologna Centro Lame - Bologna Coop Alleanza 3.0
Centro Leonardo - Imola (BO) Centro Leonardo - Imola (BO) Coop Alleanza 3.0
La Torre - Palermo La Torre - Palermo Coop Alleanza 3.0
Casilino - Roma Casilino - Roma Uncoop Tirreno
Le Porte d Napoli - Afragola(NA) Le Porte d Napoli - Afragola(NA) Distribuzione Centro Sud Srl (ipercoop)
Tiburtino - Guidonia (RM) Tiburtino - Guidonia (RM) Distribuzione Centro Sud Srl (ipercoop)
Millennium Gallery - Rovereto (TN)
Puntadiferro - Forlì (FC)
Centroluna - Sarzana (SP)
La Favorita - Mantova
Maremà - Grosseto
11 shopping malls Centro Sarca - Sesto S. Giovanni (MI) Hypermkts not owned by IGD
Mondovicino Retail Park - Mondovì (CN)
Gran Rondò (Crema)
Piazza Mazzini (Livorno)
I Bricchi - Isola d'Asti (AT)
Darsena City - Ferrara
Supermkt Civita Castellana (Viterbo) Unicoop Tirreno
Supermkt Cecina (Livorno) Unicoop Tirreno
Hypermkt Le Fonti del Corallo - Livorno Unicoop Tirreno
Hypermkt Schio-Schio (Vicenza) Hypermkt Coop Alleanza 3.0
9 hypermarkes Malls not owned by IGD LUGO - Lugo (RA) Coop Alleanza 3.0
Hypermkt IL MAESTRALE - Senigallia (AN) Coop Alleanza 3.0
Hypermkt MIRALFIORE - Pesaro Coop Alleanza 3.0
Supermkt AQUILEJA - Ravenna Arca SpA (Famila)
Hypermkt I MALATESTA - Rimini Coop Alleanza 3.0
60Strong repositioning
of the Romanian Portfolio
1 5 9 13
2 6 10 14
1 7
2 Bistrita Piatra Neamt 8
Cluj-Napoca Vaslui
7 11
3 9
3
Turda Galati
14
4 10 1
13 12
Ramnicu Valcea 1
Buzau Braila Tulcea
Ploiesti
5
4 8 12
Slatina Bucuresti - Hq
6
Alexandria
661
1The main shareholders:
«Coop world»
7 Legal entities throughout Italy
«Coop world» key data(1):
17 Regions covered by Coop Turnover ~ EUR 14.7 bil € (12.5 % of italian large scale retail) 2
No. of stores: ~1,150
Employees ~48,000
Members ~ 6.4 Mn people
Coop Alleanza 3.0 (3) Unicoop Tirreno (4)
Revenues ~4.0bn € ~875mn €
N° of stores ~375 ~94
Employees s ~19,000 3,450
Members ~2.3 mn ~607,000
Deposits from
members
~3.2bn € ~605mn €
Strategic investments in listed companies:
UNIPOL GRUPPO
FINANZIARIO IGD SIIQ SPA
(Insurance and banking)
1. Data at 31/12/2020
2. Source: Nielsen, survey GNLC 2020 62
3. Data at 31/12/2020; sources:: Coop Alleanza 3.0
4. Data at 31/12/2020; sources; Unicoop Tirreno financial reportsGovernment’s support measures:
«Sostegni» and «Sostegni Bis» decrees
Measures provided for by Measures provided for by
Decree «Sostegni» Decree «Sostegni bis»
DL 41/2021 DL 73/2021
Non-repayable contributions provided by the Tax credit for rents of non-residential
Government properties confirmed:
• Condition: 2020 turnover decrease equal to at least - • Retail activities with revenues >15€ million: 40%
30% compared to 2019 for leases and 20% on company leases for each of the
• Turnover limit: support to companies with a turnover months from January to May 2021
up to 10€ million • Retail activities with revenuesRaffaele Nardi Director of Planning, Control and investor relations raffaele.nardi@gruppoigd.it Claudia Contarini, Investor Relator T. +39 051 509213 claudia.contarini@gruppoigd.it Elisa Zanicheli, IR Team T. +39. 051 509242 elisa.zanicheli@gruppoigd.it Federica Pivetti, IR Team T. +39. 051 509260 federica.pivetti@gruppoigd.it Follow us on
You can also read