Impaired learning from regret and disappointment in alcohol use disorder - Nature
←
→
Page content transcription
If your browser does not render page correctly, please read the page content below
www.nature.com/scientificreports
OPEN Impaired learning from regret
and disappointment in alcohol use
disorder
Caterina Galandra1, Chiara Crespi2*, Gianpaolo Basso3 & Nicola Canessa1,4
The development of alcohol habits is considered a form of maladaptive reinforced learning, with
sustained alcohol use resulting in the strengthening of associative links between consumption
and either rewarding, or the lack of aversive, experiences. Despite recent efforts in characterizing
decision-making skills in alcohol-use-disorder (AUD), it is still unknown whether impaired behavioural
learning in AUD patients reflects a defective processing and anticipation of choice-related, cognitively
mediated, emotions such as regret or relief for what might have been under a different choice.
We administered a Wheel-of-Fortune (WoF) task to 26 AUD patients and 19 healthy controls, to
investigate possible alterations in adjusting choices to the magnitude of experienced regret/relief,
and in other facets of decision-making performance such as choice latency. AUD patients displayed
both longer deliberation time than healthy controls, and impaired adaptations to previous outcome-
related negative emotions. Although further evidence is needed to unveil the cognitive mechanisms
underlying AUD patients’ abnormal choice, the present results highlight important implications for
the clinical practice, e.g. in terms of cognitive treatments aiming to shape faulty perceptions about
negative emotions associated with excessive alcohol exposure.
Decision-making involves several cognitive processes underlying the selection of the optimal choice among the
existing alternatives1,2, including the assessment of risk when their potential outcomes are probabilistic rather
than certain3. Considerable neurobiological evidence shows a close relationship between the computational
and emotional facets of decision-making under risk, because the evaluation of prospective outcomes entails the
anticipation of their rewarding or punishing affective c onsequences4,5.
Emotions are indeed considered to potentiate the appetitive or aversive drives generated by such anticipatory
processes, thus modulating choice behaviour and adaptive behavioural learning6–8. In particular, Mellers’9 Deci-
sion affect theory emphasized the role of positive or negative affective states such as satisfaction or disappoint-
ment for outcomes better or worse than expected, r espectively10,11. These basic feelings do not entail a sense of
responsibility for probabilistic outcomes occurring regardless of one’s own decisions. Outcome evaluation and
subsequent choices, however, are also shaped by the awareness that things might have been better or worse under
a different choice, i.e. by the experience and anticipation of relief or regret, r espectively9. These complex, cogni-
tively mediated, emotions result from spontaneous counterfactual comparisons between the outcomes of selected
vs. rejected options12, promoting the avoidance of the aversive experience of regret in subsequent choices7,8,13–15.
The salience of such comparisons is enhanced both by the feeling of responsibility for one’s own outcomes16 and
by the ease with which an alternative outcome can be mentally represented. The closeness between actual and
counterfactual outcomes, resulting in so-called near-miss outcomes17, potentiates the affective and behavioural
impact of regret-based l earning18. The affective salience of near-miss outcomes is also considered to potentiate
motivations towards maladaptive b ehaviours19 and might thus contribute to abnormal choices in pathological
conditions. Indeed, the development of computational models of choice-related affects boosted the investiga-
tion of impaired decision-making in different neuro-psychiatric diseases, such as Parkinson’s d isease20, obses-
21 22
sive–compulsive disorder or d epression . In particular, altered decision-making under risk represents a core
phenotype in addictions, including alcohol use disorder (AUD)23,24.
1
Istituti Clinici Scientifici Maugeri IRCCS, Cognitive Neuroscience Laboratory, 27100 Pavia, Italy. 2Department
of Brain and Behavioral Sciences, University of Pavia, Piazza Botta 6, 27100 Pavia, Italy. 3University of
Milano-Bicocca, 20126 Milan, Italy. 4NEtS Center, Scuola Universitaria Superiore IUSS Pavia, 27100 Pavia,
Italy. *email: chiara.crespi@unipv.it
Scientific Reports | (2020) 10:12104 | https://doi.org/10.1038/s41598-020-68942-y 1
Vol.:(0123456789)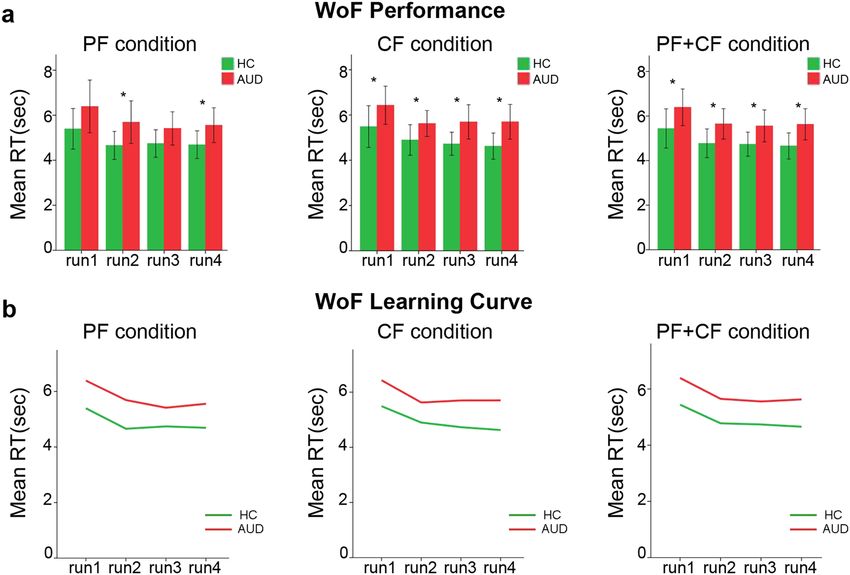
www.nature.com/scientificreports/
Neurobiological models of addiction suggest that decision-making impairments in AUD may reflect defec-
tive behavioural adaptations to changes in reward contingencies, i.e. to “reward prediction errors” coding the
difference between expected and actual o utcomes25. The formation of alcohol habits is considered a result of
maladaptive reinforced learning, strengthening the association between consumption and either rewarding, or
the lack of aversive experiences26. The driving role of negative reinforcement, i.e., the need to escape the aver-
sive state associated with the craving for a lcohol27, might thus be increased both by the experience of regret,
computationally coded as a “fictive prediction error”25, and by near-miss outcomes19. However, only few stud-
ies have investigated regret processing and/or anticipation in pathological p opulations28,29, including problem
30
gambling but not AUD.
On this basis, we investigated possible alterations in adjusting choices to experienced disappointment, regret
and near-miss outcomes in AUD patients compared with healthy controls. We used a Wheel of Fortune (WoF)
task31, that allows to assess the extent to which choice behaviour is influenced by these variables, in addition to
expected value8. In this task, subjects are repeatedly asked to choose between two gambles, depicted as wheels
of fortune associated with specific paired combinations of monetary outcomes and levels of probability. The task
was divided in two conditions associated with separate blocks. In the “partial feedback” (PF) condition, the spin-
ning arrow and the related outcome were presented for the selected wheel only. In the “complete feedback” (CF)
condition the spinning arrows and the associated outcomes appeared both in the selected and rejected wheels
(see Sect. 4.2 for a detailed description of the task). Based on previous evidence of altered WoF performance in
pathological populations6,29, we predicted that AUD patients’ choice behaviour would reflect a) decreased integra-
tion of anticipated regret, and b) increased influence of near-miss outcomes, compared with healthy controls. We
also explored possible group differences concerning other aspects of decision-making performance, including
response time (RT), overall financial performance (W) and number of time-outs (TO; i.e. trials in which subjects
did not respond within the available time-window). Information processing speed is indeed considered a pos-
sible marker of cognitive decline in several neurological d iseases32,33, with a prominent role in age-related motor
34
slowing as w ell . Moreover, previous studies investigating alcohol-related decision-making impairments have
shown increased choice latency as a possible marker of psychomotor s lowing35,36, highlighting the “output” stage
of decision-making as the most vulnerable to chronic alcohol consumption. Based on our previous findings, we
thus predicted slower choice latencies in AUD patients compared with controls.
Results
WoF task performance and learning curve. Mann–Whitney U tests on PF and CF mean values high-
lighted, for both conditions, slower RTs in AUD patients compared with healthy controls (PF: p = 0.031r = − 0.328;
CF: p = 0.012, r = − 0.397) (Table 1c). Instead, neither W (p = 0.339) or TO (p = 0.495) variables were signifi-
cantly different across groups (Table1c). We found a positive correlation only between CF RTs and age (r = 0.262,
p = 0.041). ANCOVA confirmed a significantly slower performance, in AUD patients, in CF trials after removing
age effect (p = 0.045, η2 = 0.092; Table 1c). This finding was confirmed by additional analyses comparing perfor-
mance across runs. AUD patients were slower than controls in all CF runs, but only in PF runs 2 (p < 0.015) and
4 (p < 0.38) (Table 2a, Fig. 1a). When testing the overall RTs regardless of condition, we confirmed AUD patients’
slower performance in all runs (Table 2a, Fig. 1a).
Although we observed significant RT differences across runs in both groups (Table 2b), the analyses on
learning curves showed fastest task performance at run 2 in the whole sample (AUD: p = 0.001, r = 0.715; HC:
p = 0.005, r = 0.726), suggesting no group difference in the amount of time needed to stabilize performance
(Table 2c, Fig. 1b).
Choice behaviour. We tested two models of choice, incorporating the effect of different choice variables on
decision-making behaviour. In the former, we modelled the effects of anticipating disappointment (d) and regret
(r), alongside the maximization of expected value (e), under the assumption that individuals should aim to max-
imize EV while also learning to avoid the negative feelings associated with disappointment and/or regret (see
details in8). The results of this model showed that, for both groups, choices in the PF condition were significantly
modulated only by the maximization of expected value. In the CF condition, instead, healthy controls displayed
a significant modulation by anticipated disappointment (β = 0.0000283, p < 0.036) but not regret (β = 0.0019097,
p < 0.087), while neither variables were associated with significant effects in AUD patients (Table 3).
The second model aimed to investigate the modulation of choice behaviour by the affective experience associ-
ated with a near-miss outcome (NM) in the previous trial, in addition to the maximization of expected value (e).
The results revealed group-specific modulations of choice behaviour depending on the experimental condition
(Table 4). Choices in the PF condition were driven only by the maximization of expected value in healthy con-
trols (β = 0.0008, p < 0.0001), but also by previous experiences of near-miss outcomes in AUD patients (β = 0.28,
p < 0.006). The contrary was true for the CF condition, in which choices were guided only by expected value in
AUD patients (β = 0.000191, p < 0.0001), and also by past experiences of near-miss outcomes on the unchosen
gamble in healthy controls (β = − 0.28, p < 0.023).
Discussion
Alcohol use disorder is one of the most prevalent psychiatric conditions worldwide. The Diagnostic and Statisti-
cal Manual of Mental Disorders—fifth edition—defined AUD as a chronic relapsing condition characterized by
excessive alcohol consumption despite its devastating consequences on individuals’ physical, social and cognitive
functioning47. In particular, the revised diagnostic criteria for AUD highlighted the impairment in behavioural
control, an important high-order cognitive function implicated also in decision-making process.
Scientific Reports | (2020) 10:12104 | https://doi.org/10.1038/s41598-020-68942-y 2
Vol:.(1234567890)www.nature.com/scientificreports/
AUD (mean, ± SD)
N = 26 HC (mean, ± SD) N = 19 DF T/chi2* p-value
a. Demographic variables
Sex (female/male) 10/16 8/11 1 0.061* 0.805
Age 46.5 (± 8.25) 45.105 (± 8.69) 43 − 0.548 0.548
Education (years) 10.88 (± 3.51) 10.63 (± 3.06) 43 − 0.252 0.802
AUD – female AUD – male
AUD (mean, ± SD) (mean, ± SD) (mean, ± SD)
N = 26 N = 10 N = 16 U p-value
b. Alcohol use variables
Disease Duration
10.77 (± 6.78) 11.78 (± 6.72) 10.14 (± 6.96) 67 0.492
(years)
Daily Alcohol Use 15.42 (± 7.93) 14.85 (± 5.59) 15.78 (± 9.25) − 76 0.853
Abstinence (day) 14.27 (± 3.91) 13.50 (± 3.31) 14.75 (± 4.28) 65 0.452
Partial feedback AUD (mean, ± SD) HC (mean, ± SD)
condition N = 26 N = 19 DF U p-value r
(c) WoF group comparison (Mann–Whitney)
RT (ms) 5,653.54 (± 1765.94) 4,872.31 (± 1,327.22) 43 166 0.031 − 0.328
W 55.36 (± 16.92) 53.98 (± 14.19) 43 229 0.339 − 0.073
To 1 (± 2.26) 0.58 (± 0.77) 43 246.5 0.495 − 0.002
Complete feedback AUD (mean, ± SD) HC (mean, ± SD)
condition N = 26 N = 19 DF U p-value r
RT (ms) 57,800.04 (± 1,402.48) 4,930.25 (± 1,222.80) 43 149 0.012 − 0.397
W 66.96 (± 22.94) 72.79 (± 17.24) 43 200 0.140 0.190
To 0.68 (± 0.99) 0.63 (± 0.76) 43 221.5 0.254 0.103
DF F p-value η2
d. WoF group comparison controlling for Age (ANCOVA)
RT (partial feedback
1.42 2.292 0.138 0.052
condition)
RT (complete feedback
1.42 4.262 0.045 0.092
condition)
Table 1. Demographic and clinical variables. Section (a) reports demographic variables concerning gender,
age and education for both AUD patients and healthy controls. Section (b) reports clinical information about
alcohol use history and daily dose in AUD patients. Section (c) reports information about partial and complete
feedback conditions (mean, standard deviation), concerning response time, gain and time-out variables
obtained at the WoF task for AUD patients and healthy controls. Section (d) reports information about group
differences in RT, corrected for the effect of age (ANCOVA). (*) indicates results from chi square test; all other
analyses of group differences are based on non-parametric Mann–Whitney U tests for independent samples.
PF = partial feedback; CF = complete feedback; AUD = AUD patients; HC = healthy controls; SD = standard
deviation; DF = degree of freedom; T = Student’s t-test; chi2 = chi square test; U = Mann–Whitney U Test;
r = Rank biserial correlation; η2 = partial eta squared; FDR = False Discovery Rate adjustment applied on raw
p-values. Bold values denote statistical significance at the p < 0.05 level.
Alcohol-related decision-making impairments are increasingly investigated by focusing on possible alterations
of the computational facets of choice b ehaviour25,26. While previous studies have highlighted altered reinforce-
ment learning as a core component of the typical vicious circle linking craving, immediate rewarding effects
and long-term negative consequences, it is still unknown whether such impairments also involve choice-related,
cognitively mediated, emotions such as regret and relief, which have been shown to support adaptive behavioural
learning in healthy individuals8. We addressed this issue with a cognitively demanding decision-making task
incorporating several choice variables, such as expected value, satisfaction for a gain or disappointment for a
loss, complex emotions, such as regret or relief, and the influence of previously experienced near-miss outcomes.
AUD patients and healthy controls did not differ in terms of overall payoff, number of time-outs or learning
curve throughout the task, with RTs stabilizing at the second run in both groups. AUD patients, however, were
significantly slower than healthy controls in making their choices both in PF and CF conditions. In line with the
role played by information processing speed in higher-order cognitive t asks37, these results confirm previous
reports of alcohol-related increased deliberation t ime35,36,38, likely reflecting a generalized executive impairment
extending to the output stages of decision-making39–42. However, when controlling for possible age effect in
CF trials we observed significantly longer RTs in AUD patients compared with healthy controls. The results of
behavioural modelling allowed assessing whether AUD patients’ sensitivity to this condition, over and beyond
possible age effect, reflects a defective incorporation of anticipated negative emotions in choice behaviour.
In line with our hypothesis, AUD patients chose by maximizing expected value, but failed to minimize both
disappointment and regret. Unlike healthy controls, who displayed a significant anticipation of disappointment,
they thus neglected the affective consequences of their choices when evaluating gambles. This impairment might
contribute to AUD patients’ behavioural alterations in everyday life. The ability to anticipate negative emotions
Scientific Reports | (2020) 10:12104 | https://doi.org/10.1038/s41598-020-68942-y 3
Vol.:(0123456789)www.nature.com/scientificreports/
AUD (mean, ± SD) HC (mean, ± SD)
N = 26 N = 19 U p-value r
a. RT group comparison
PF condition
Run 1 6,390.13 (± 2,899.26) 5,395.01 (± 1871.74) 192 0.103 − 0,223
Run 2 5,690.02 (± 2,338.19) 4,657.01 (± 1,292.31) 153 0.015 − 0.381
Run 3 5,414.42 (± 1828.43) 4,741.81 (± 1,263.20) 192 0.103 − 0.223
Run 4 5,555.93 (± 1915.30) 4,690.32 (± 1,277.79) 170 0.038 − 0.312
CF condition
Run 1 6,432.83 (± 2087.83) 5,490.92 (± 1916.46) 168 0.034 − 0.320
Run 2 5,624.74 (± 1,421.98) 4,897.60 (± 1,400.54) 151 0.013 − 0.389
Run 3 5,698.05 (± 1875.40) 4,729.53 (± 1,057.46) 161 0.024 − 0.348
Run 4 5,701.78 (± 1901.15) 4,626.46 (± 1,207.30) 166 0.031 − 0.328
PF + CF conditions
Run 1 6,391.99 (± 2036.10) 5,440.88 (± 1,830.93) 169 0.036 − 0.361
Run 2 5,649.65 (± 1687.29) 4,737.23 (± 1,338.20) 154 0.016 − 0.377
Run 3 5,555.91 (± 1775.22) 4,737.48 (± 1,122.26) 175 0.049 − 0.291
Run 4 5,629.13 (± 1729.84) 4,657.61 (± 1,213.96) 169 0.036 − 0.316
PF + CF PF CF
χ2 p-value χ2 p-value χ2 p-value
b. Friedman Test
AUD 12.60 0.006 7.062 0.070 5.862 0.119
HC 7.737 0.052 10.137 0.017 9.379 0.025
PF + CF (AUD) PF (AUD) CF (AUD)
Z p-value r Z p-value r Z p-value r
c. Wilcoxon Test
Run1-Run2 − 3.187 0.001 0.715 − 2.400 0.016 0.538 − 1.968 0.049 0.442
Run2-Run3 − 0.724 0.469 0.162 − 0.495 0.620 0.111 − 0.851 0.395 0.191
Run3-Run4 − 0.292 0.770 0.066 − 0.013 0.990 0.003 − 0.470 0.638 0.105
PF + CF (HC) PF (HC) CF(HC)
Z p-value r Z p-value r Z p-value r
Run1-Run2 − 2.777 0.005 0.726 − 2.817 0.005 0.737 − 2.294 0.022 0.600
Run2-Run3 − 0.201 0.841 0.053 − 0.765 0.445 − 0.200 − 1.046 0.295 0.274
Run3-Run4 − 0.523 0.601 0.137 − 0.080 0.936 0.021 − 0.402 0.687 0.105
Table 2. Performance analysis. Section (a) reports data on run-specific group differences for partial-
and complete-feedback conditions, or both (non-parametric Mann-Whitney U test). Section (b) reports
information about RT differences across the 4 experimental runs. Section (c) reports the results of Wilcoxon
tests aimed to unveil learning abilities. PF=partial feedback; CF=complete feedback; AUD=AUD patients;
HC=healthy controls; SD=standard deviation; χ2= Friedman test; Z=Wilcoxon Test; r=Rank biserial
correlation. Bold values denote statistical significance at the p < 0.05 level.
is indeed considered a powerful motivator to change behavioural strategies in order to reach better o utcomes43
associated with healthy behaviours. The defective estimation, and/or incorporation, of “reward” and “fictive”
prediction errors might thus represent the computational basis of AUD patients’ neglect for the affective conse-
quences of their choices. Since the associated emotions of disappointment and regret are considered to enhance
adaptive behavioural learning from past experiences, driving motivated behaviour away from risk, the observed
impairment is thus likely to promote patients’ inability to learn from the negative consequences of chronic alco-
hol consumption, and thus the maintenance of AUD. Unlike previous studies, we did not observe a significant
minimization of anticipated regret in healthy c ontrols6,8. This negative finding might be explained by the higher
age mean and standard deviation in our sample (Table 1) compared with previous studies on regret processing7,29.
The hypothesis of a defective incorporation of affective information in AUD patients’ evaluative processes
was supported by a second model of choice, testing the effect of near-miss outcomes alongside expected value.
While both groups chose by maximizing expected value, they displayed different modulations by the emotional
experience associated with near-miss outcomes, biasing only the PF condition in AUD patients, and only the
CF condition in healthy controls. To date, near-miss outcomes have been interpreted either as frustrating events
reinforcing maladaptive behaviours to diminish the associated negative emotional state45, or as positive rein-
forcers mentally represented as actual appetitive o utcomes46. The former interpretation fits with the role played
by negative reinforcement in AUD, i.e., by the need to escape the aversive state associated with the craving for
alcohol27. In either case, however, near-miss outcomes are known to exert their effect by potentiating the affective
load attached to what might have been under a different fate in the PF condition, or a different choice in the CF
Scientific Reports | (2020) 10:12104 | https://doi.org/10.1038/s41598-020-68942-y 4
Vol:.(1234567890)www.nature.com/scientificreports/
Figure 1. Task performance and learning curve. Panels (a) and (b) depict group differences in run-specific RTs
and in learning curves, respectively, for partial- and complete-feedback conditions, or both.
HC AUD
Coeff Std Error z p-value Coeff Std Error z p-value
Partial feedback condition
e 0.0001851 0.0000116 15.96 < 0.0001 e 0.0001651 0.00000884 18.67 < 0.0001
d − 0.00000227 0.00000791 − 0.29 < 0.402 d − 0.000000816 0.00000652 − 0.13 < 0.901
Complete feedback condition
e 0.0001549 0.0000195 7.93 < 0.0001 e 0.0001818 0.0000174 10.46 < 0.0001
d 0.0000283 0.0000135 2.09 < 0.036 d 0.00000749 0.0000114 0.66 < 0.511
r 0.0019097 0.0011156 1.71 < 0.087 r − 0.0002403 0.0009492 − 0.25 < 0.800
Table 3. Choice behaviour at the WoF task: Model 1. The table reports the results of a model of choice
integrating the effects of anticipated disappointment (d) and regret (r) in addition to the maximization of
expected value (e). Bold values denote statistical significance at the p < 0.05 level.
HC AUD
Coeff Std.Error Z p-value Coeff Std.Error Z p-value
Partial feedback condition
e 0.0007845 0.0000112 16.4 < 0.0001 e 0.0001717 8.98E−06 19.13 < 0.0001
NM_C 0.0268493 0.1215746 0.22 < 0.825 NM_C 0.279621 0.1018746 2.74 < 0.006
Complete feedback condition
e 0.0001987 0.0000129 15.38 < 0.0001 e 0.000191 0.0000108 17.62 < 0.0001
NM_C 0.1536473 0.1362582 1.13 < 0.259 NM_C 0.1549444 0.1154768 1.34 < 0.180
NM_UC − 0.2819862 0.1239845 −2.27 < 0.023 NM_UC − 0.1460421 0.2498032 0.21 < 0.835
Table 4. Choice behaviour at the WoF task: Model 2. The table reports the results of a model of choice
integrating the effects of previous experiences of near miss outcome associated with the chosen (NM_C)
and unchosen (NM_UC) gambles, in addition to the maximization of expected value (e). Bold values denote
statistical significance at the p < 0.05 level.
Scientific Reports | (2020) 10:12104 | https://doi.org/10.1038/s41598-020-68942-y 5
Vol.:(0123456789)www.nature.com/scientificreports/
one. Regardless of a specific interpretation, this finding confirms that the defective integration of information
concerning the unselected option represents a consistent trait of AUD patients’ decision-making processes,
decreasing the chances of learning from previous negative experiences.
There are limitations to this study. First, the accurate case–control matching for demographic variables and
our stringent inclusion criteria resulted in a small-to-moderate sample size. Moreover, the lack of specific meas-
ures of information processing speed did not allow establishing a causal connection between the executive
and computational impairments displayed by AUD patients. The present results should thus be considered as
preliminary evidence in need of further support from studies including larger samples and additional neuro-
cognitive variables. Finally, here we focused our attention only on the computational aspects of cognitive-based
emotions of regret and relief, disappointment and satisfaction, neglecting the role of individual differences in
perception and interpretation of such complex affective states. Further investigations are needed in order to
assess the relationships between the impaired ability of AUD patients in implementing cognitive-based emotions
during decision-making and their relative subjective feelings. To the best of our knowledge, however, this is the
first study investigating AUD patients’ decision-making performance by modelling the anticipation of complex
emotions resulting from counterfactual thinking31. Although preliminary and in need of further supporting
evidence, our results highlight the defective implementation, and thus avoidance, of disappointment and regret
as a component of AUD patients’ alterations in learning from negative experiences. Future research might build
on these results by addressing gender differences, the neural bases of these alterations, as well as the development
and assessment of treatment protocols specifically focused on the implementation of emotional experiences in
choice-related behaviours.
Materials and methods
Participants. Twenty-six adult AUD patients (10 females; mean age: 46.50 years ± 8.25; range: 29–64; mean
education: 10.88 years ± 3.51) and 19 age- and education-matched healthy control subjects (8 females; mean
age: 45.11 years ± 8.69; range: 27–57; mean education: 10.63 years ± 3.05) participated in the study. A chi-square
test confirmed that the distribution of males and females was not significantly different across AUD patients
and healthy controls (p = 0.805). AUD patients were enrolled from the Functional Rehabilitation Unit of ICS
Maugeri-Pavia (Italy), and healthy controls were recruited via local advertisement. There was no significant
demographic difference between AUD patients and healthy controls (Table 1). Average disease duration in AUD
patients ranged from 1 to 26 years (mean: 10.77 years ± 6.78). Inclusion criteria for AUD patients were: 1) age
between 20 and 60 years; 2) a diagnosis of alcohol dependence according to DSM-V diagnostic criteria. Exclu-
sion criteria for both AUD patients and control subjects were: (1) presence or history of neurological or psychi-
atric disorders other than AUD, or any comorbid disorder except for nicotine dependence; (2) family history
of neurological or psychiatric disorders; (3) current use of any psychotropic substance or medication; (4) past
brain injury or loss of consciousness; (5) major medical disorders (e.g. kidney or liver diseases, severe diabetes
and/or malnutrition); (6) inability to undergo the neuropsychological assessment. Healthy controls were also
excluded in case of presence or history of alcohol abuse. AUD patients joined the experimental protocol after
being detoxified for at least 10 days, via medically supported standard treatments. However, they had ceased
benzodiazepine treatment at least 8 days before scanning. Healthy participants were at least abstinent 10 days
before scanning. All participants provided written informed consent to the experimental procedure, which was
approved by the local Ethical Committee of ICS Maugeri-Pavia. The investigation was conducted in accordance
with the latest version of the Declaration of Helsinki (see a lso35,39–42).
Wheel of Fortune (WoF) Task. The WoF task is an experimental paradigm adapted from Mellers and
colleagues31, previously used to investigate the contribution of choice-related emotions such as satisfaction/
disappointment and relief/regret to decision-making under risk6,8,29. Subjects are repeatedly asked to choose
between two gambles, depicted as wheels of fortune, on the left and right halves of the screen. Each wheel is
divided in two sectors, i.e. green (left) and red (right), always associated with the best and worse outcomes,
respectively (Fig. 2). In each gamble, the possible outcomes involve paired combinations of 200, 50, − 50 and
− 200 (arbitrary units), associated with 3 different levels of probability (20–80, 50–50 and 80–20) represented by
the size of the green/red sectors. Therefore, the possible counterfactual combinations of wins and losses result in
four potential levels of regret and relief (± 100, ± 150, ± 250 and ± 400) when subjects are shown the outcomes of
both the selected and unselected gambles (CF). Thus, if the computational process results in a positive outcome
they will experience relief, otherwise regret. In this condition, indeed, they can evaluate not only the financial
consequences of their decision, but also the outcome they might have obtained, if they had selected the alterna-
tive gamble. In the PF condition, instead, only the outcome of the selected gamble is shown, thus resulting in
satisfaction or disappointment for the best or worse outcome, respectively, without a sense of personal respon-
sibility.
In the present study, the gambles were shown for 4.5 s, during which subjects could evaluate them and make
a decision. Next, the appearance of an asterisk in the centre of the screen prompted them to choose, by pressing
one of two buttons on a keyboard with their right index or middle fingers. Subjects had 2 s to choose the gam-
ble, otherwise they received an “out of time” message, and a new trial started. Once selected, the chosen gamble
was highlighted by a yellow contour, that would remain on the screen up to the end of the trial, and 2 s after
the appearance of the asterisk a white arrow appeared in a random position in both wheels (CF) or only in the
selected one (PF). One second later, the arrow(s) started spinning clock-wise, with different and random initial
speed(s), and stopped after exactly 4 s, indicating the final outcome(s), that remained on the screen for 3 s. The
spatial distance between the resting position of the spinning arrow and the boundary between the green and red
sectors was used to code three possible values of “closeness” of near-miss outcomes (see below).
Scientific Reports | (2020) 10:12104 | https://doi.org/10.1038/s41598-020-68942-y 6
Vol:.(1234567890)www.nature.com/scientificreports/
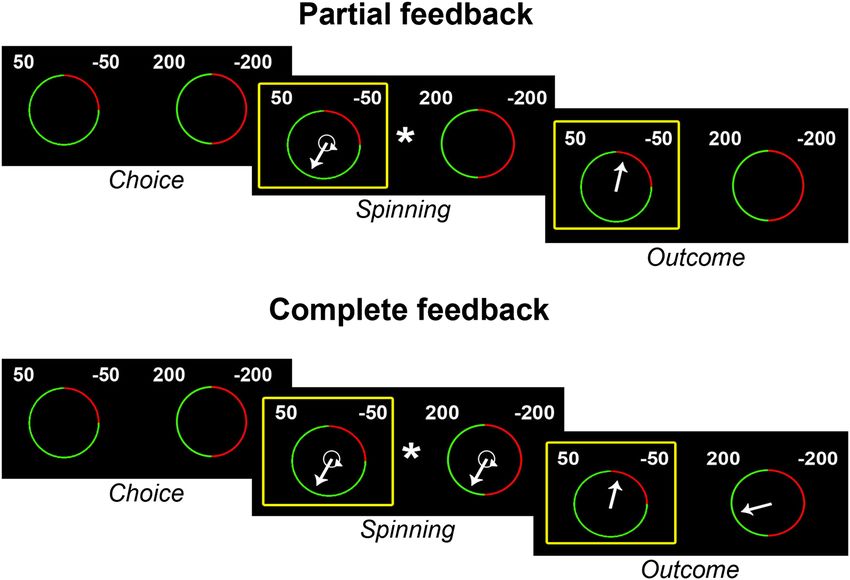
Figure 2. Wheel of fortune (WoF) task. Subjects are repeatedly asked to choose between two gambles, depicted
as wheels of fortune associated with specific paired combinations of monetary outcomes (200, 50, − 50 and
− 200) and levels of probability represented by the size of the green/red sectors (20–80, 50–50 and 80–20).
The possible counterfactual combinations of wins and losses result in four potential levels of regret and relief
(± 100, ± 150, ± 250 and ± 400) when subjects are shown the outcomes of both the selected and unselected
gambles (CF). In the PF condition, instead, only the outcome of the selected gamble is shown, thus resulting
in satisfaction or disappointment for the best or worse outcome. The gambles were shown for 4.5 s, during
which subjects could evaluate them and make a decision. Next, the appearance of an asterisk in the centre of
the screen prompted them to choose a gamble, which was highlighted by a yellow contour. Two seconds after
the appearance of the asterisk a white arrow appeared in a random position in both wheels (CF) or only in the
selected wheel (PF). One second later, the arrow(s) started spinning clock-wise, with different and random
initial speed(s), and stopped after exactly 4 s, indicating the final outcome(s), that remained on the screen for
3 s.
Each participant performed 192 trials overall, blocked in 4 runs of 24 trials per condition. The order of CF
and PF blocks was counterbalanced across subjects. Because of the complexity of the task and in order to make
participants confident with answer’s procedure, each subject performed a training session before to start.
Definition of choice variables. We used the following variables to investigate possible group differences
in task performance and choice behaviour: response time to select the gamble (RT); number of time-outs (TO);
expected value (EV, i.e. the sum of the value of the two possible gamble outcomes, each weighted by the cor-
responding probability); gain (W, the value associated with the outcome); disappointment (d, the negative emo-
tion associated with the difference between the actual and unobtained outcomes of the selected gamble); regret
(r, negative emotion associated with the difference between the outcomes of the selected and rejected gambles);
near-miss outcomes (NM; the degree of “closeness” of non-win outcomes).
For each variable we computed: a) the overall mean value in PF and CF conditions separately; b) the mean
value in each of the 4 PF and CF runs; c) the mean value for each of the 4 runs regardless of the experimental
condition.
Analysis of choice performance. To evaluate task performance, we considered RT, TO and W varia-
bles as representative indexes of subjects’ ability to perform the WoF task. Thus, we first checked for possible
group differences by means of Mann–Whitney non-parametric U tests on the overall PF and CF mean values,
separately. We then checked for age and education effects by means of correlation analyses. For those variables
showing both between-group differences and a significant effect of age and/or education, we ran an Analysis of
Covariance (ANCOVA) to assess the stability of results after removing their effects. We applied a primary statis-
tical threshold of p < 0.05, one-tailed due to a priori hypotheses of alcohol-related impairment23.
Scientific Reports | (2020) 10:12104 | https://doi.org/10.1038/s41598-020-68942-y 7
Vol.:(0123456789)www.nature.com/scientificreports/
To investigate possible effects of chronic alcohol consumption on learning curves, we then explored group
differences among runs. Namely, for the variables showing significant group differences in the previous analysis
we performed additional Mann–Whitney non-parametric U tests on run-specific mean values regardless of
condition, as well as PF and CF mean values separately. Based on the considerable executive load of the WoF task,
we also assessed possible group differences in learning abilities in terms of time needed for task execution. To
this purpose, we first applied the Friedman test within each group, to highlight significant RT differences along
the four runs. We then performed post-hoc analyses (Wilcoxon signed-rank test) to identify the specific run at
which each group reached the maximum (i.e. fastest) performance. For each statistical analysis we performed
also effect size calculation, i.e. Glass rank biserial correlation for non-parametric tests and partial eta squared
for ANCOVA. Statistical analyses were performed with SPSS (IBM Corp. Released 2015. IBM SPSS Statistics for
Macintosh Version 23.0. Armonk, NY: IBM Corp.) and JASP (https://jasp-stats.org/).
Analysis of choice behaviour. We applied regression analyses, using a panel logit procedure with an indi-
vidual random effect, to unveil the contribution of different choice-related emotions to decision-making perfor-
mance. The panel data analysis modelled each subject as unit, and each trial as time variable. The random-effects
model was used as the default model, and the parameters were estimated by maximum likelihood. We tested two
models of choice, incorporating the effect of different choice variables on decision-making behaviour.
In the former, we modelled the effects of anticipating disappointment (d) and regret (r), alongside the maxi-
mization of expected value (e) (see details i n8). The probability of choosing gamble 1 is:
(1)
Pr g1st = 1 − Pr g2st = F[dst ; rst ; est ]
where s = subject, t = time and F[θ] denotes the function eθ/(1 + eθ). The variables d and r, as described in Eqs. 2
and 3, indicate the process of minimizing future disappointment and future regret, respectively; e indicates the
result of maximizing expected values. x1 and y1 represent the better and worst outcome of gamble 1 (g1), and x2
and y2 represent the better and worst outcome of gamble 2 (g2). The probability of x1 is p and the probability of
y1 is 1 – p; the probability of x2 is q, and the probability of y2 is 1 – q.
(2)
d = y2 − x2 ∨ 1 − q − y1 − x1 ∨ 1 − p
r = y2 − x1 − y1 − x2 (3)
(4)
e = EV g1 − EV g2 = px 1 + 1 − p y1 − qx 2 + 1 − q y2
In the CF condition, the optimal behaviour depends on the subject’s ability to minimize disappointment (d;
Eq. 2) and regret (r; Eq. 3), while maximizing expected value (e; Eq. 4). In the PF condition, instead, subjects can
only integrate in their evaluative process the effect of anticipated disappointment and maximization of expected
values (see details in8).
The second model aimed to investigate the modulation of choice behaviour by the affective experience asso-
ciated with a near-miss outcome (NM) in the previous trial, in addition to the maximization of expected value
(e). Therefore, choice behaviour depends a) both on the maximization of expected value (Eq. 4) and near-miss
outcome of both gambles in the CF condition; b) only on expected value and near-miss of the chosen gamble in
the PF condition. The probability of choosing g1 is:
Pr g1st = 1 − Pr g2st = F[NM st ; est ]
where the NM regressor included three possible values, depending on the proportional distance between the rest-
ing position of the spinning arrow and the boundaries between the best and worse gamble outcomes. Therefore,
the participants could experience a "clear" outcome, when the arrow stopped in the central area of the best or
worse gamble segments; a full near-miss outcome, when it stopped very close to the boundary between them;
and a partial near-miss outcome, when it stopped in an approximately intermediate area between the former
positions.
The analysis of choice behaviour was carried out with STATA (StataCorp. 2019. Stata Statistical Software:
Release 13. College Station, TX: StataCorp LLC.).
Received: 2 March 2020; Accepted: 25 June 2020
References
1. Ernst, M. & Paulus, M. P. Neurobiology of decision making: a selective review from a neurocognitive and clinical perspective. Biol.
Psychiatry 58, 597–604 (2005).
2. Liu, X., Hairston, J., Schrier, M. & Fan, J. Common and distinct networks underlying reward valence and processing stages: a
meta-analysis of functional neuroimaging studies. Neurosci. Biobehav. Rev. 35, 1219–1236 (2011).
3. Rogers, R. D. et al. Choosing between small, likely rewards and large, unlikely rewards activates inferior and orbital prefrontal
cortex. J. Neurosci. 19, 9029–9038 (1999).
4. Brand, M., Labudda, K. & Markowitsch, H. J. Neuropsychological correlates of decision-making in ambiguous and risky situations.
Neural Networks 19, 1266–1276 (2006).
5. Lawrence, A., Clark, L., Labuzetta, J. N., Sahakian, B. & Vyakarnum, S. The innovative brain. Nature 456, 168–169 (2008).
6. Camille, N. et al. The involvement of the orbitofrontal cortex in the experience of regret. Science (80-) 304, 1167–1170 (2004).
Scientific Reports | (2020) 10:12104 | https://doi.org/10.1038/s41598-020-68942-y 8
Vol:.(1234567890)www.nature.com/scientificreports/
7. Coricelli, G., Dolan, R. J. & Sirigu, A. Brain, emotion and decision making: the paradigmatic example of regret. Trends Cogn. Sci.
11, 258–265 (2007).
8. Coricelli, G. et al. Regret and its avoidance: a neuroimaging study of choice behavior. Nat. Neurosci. 8, 1255–1262 (2005).
9. Mellers, B. A., Schwartz, A., Ho, K. & Ritov, I. Decision affect theory: emotional reactions to the outcomes of risky options. Psychol.
Sci. 8, 423–429 (1997).
10. Bell, D. E. Disappointment in decision making under uncertainty. Oper. Res. 33, 1–27 (1985).
11. Loomes, G. & Sugden, R. Disappointment and dynamic consistency in choice under uncertainty. Rev. Econ. Stud. 53, 271 (1986).
12. Byrne, R. M. J. Counterfactual thought. Annu. Rev. Psychol. 67, 135–157 (2016).
13. Canessa, N., Motterlini, M., Alemanno, F., Perani, D. & Cappa, S. F. Learning from other people’s experience: a neuroimaging study
of decisional interactive-learning. Neuroimage 55, 353–362 (2011).
14. Canessa, N., Motterlini, M., Dio, D. D., Perani, C. & Scifo, D. Understanding others’ regret: a fMRI study. PLoS ONE 4, 7402 (2009).
15. Chua, H. F., Gonzalez, R., Taylor, S. F., Welsh, R. C. & Liberzon, I. Decision-related loss: regret and disappointment. Neuroimage
47, 2031–2040 (2009).
16. Bell, D. E. Regret in decision making under uncertainty. Oper. Res. 30, 961–981 (1982).
17. Clark, L., Lawrence, A. J., Astley-Jones, F. & Gray, N. Gambling near-misses enhance motivation to gamble and recruit win-related
brain circuitry. Neuron 61, 481–490 (2009).
18. Cohen, M. D. Economics: learning with regret. Science 319, 1052–1053 (2008).
19. Dixon, M. J. et al. Psychophysiological arousal signatures of near-misses in slot machine play. Int. Gambl. Stud. 11, 393–407 (2011).
20. Kjær, S. W., Damholdt, M. F. & Callesen, M. B. A systematic review of decision-making impairments in Parkinson’s disease:
Dopaminergic medication and methodological variability. Basal Ganglia 14, 31–40 (2018).
21. Grassi, G. et al. Think twice: Impulsivity and decision making in obsessive–compulsive disorder. J. Behav. Addict. 4, 263–272
(2015).
22. Leahy, R. L. Depressive decision making: Validation of the portfolio theory model. J. Cogn. Psychother. Int. Q. 15, 341–362 (2001).
23. Galandra, C., Basso, G., Cappa, S. & Canessa, N. The alcoholic brain: neural bases of impaired reward-based decision-making in
alcohol use disorders. Neurological Sciences 39, 423–435 (2018).
24. Koob, G. F. Theoretical Frameworks and Mechanistic Aspects of Alcohol Addiction: Alcohol Addiction as a Reward Deficit Dis-
order. In Behavioral neurobiology of alcohol addiction 3–30 (Springer, Berlin, Heidelberg, 2011).
25. Park, S. Q. et al. Prefrontal cortex fails to learn from reward prediction errors in alcohol dependence. J. Neurosci. 30, 7749–7753
(2010).
26. Verdejo-Garcia, A., Chong, T. T. J., Stout, J. C., Yücel, M. & London, E. D. Stages of dysfunctional decision-making in addiction.
Pharmacol. Biochem. Behav. 164, 99–105 (2018).
27. Koob, G. F. Addiction is a reward deficit and stress surfeit disorder. Front. Psychiatry 4, 72 (2013).
28. Larquet, M., Coricelli, G., Opolczynski, G. & Thibaut, F. Impaired decision making in schizophrenia and orbitofrontal cortex lesion
patients. Schizophr. Res. 116, 266–273 (2010).
29. Simioni, S. et al. Multiple sclerosis decreases explicit counterfactual processing and risk taking in decision making. PLoS ONE 7,
e50718 (2012).
30. Tochkov, K. The effects of anticipated regret on risk preferences of social and problem gamblers. Judgment Decis. Making 4, 227
(2009).
31. Mellers, B., Schwartz, A. & Ritpv, D. Emotion-based choice. J. Exp. Psychol.: Gen. 128, 332 (1999).
32. Charlton, R. A., Morris, R. G., Nitkunan, A. & Markus, H. S. The cognitive profiles of CADASIL and sporadic small vessel disease.
Neurology 66, 1523–1526 (2006).
33. Van Schependom, J. et al. Reduced information processing speed as primum movens for cognitive decline in MS. Mult. Scler. J.
21, 83–91 (2015).
34. Ebaid, D., Crewther, S. G., MacCalman, K., Brown, A. & Crewther, D. P. Cognitive processing speed across the lifespan: beyond
the influence of motor speed. Front. Aging Neurosci. 9, 62 (2017).
35. Galandra, C. et al. Decreased information processing speed and decision-making performance in alcohol use disorder: combined
neurostructural evidence from VBM and TBSS. Brain Imaging Behav. https://doi.org/10.1007/s11682-019-00248-8 (2020).
36. Lawrence, A. J., Luty, J., Bogdan, N. A., Sahakian, B. J. & Clark, L. Problem gamblers share deficits in impulsive decision-making
with alcohol-dependent individuals. Addiction 104, 1006–1015 (2009).
37. Salthouse, T. A. The processing-speed theory of adult age differences in cognition. Psychol. Rev. 103, 403 (1996).
38. Czapla, M. et al. The impact of cognitive impairment and impulsivity on relapse of alcohol-dependent patients: implications for
psychotherapeutic treatment. Addict. Biol. 21, 873–884 (2016).
39. Galandra, C. et al. Abnormal fronto-striatal intrinsic connectivity reflects executive dysfunction in alcohol use disorders. Cortex
115, 27–42 (2019).
40. Galandra, C. et al. Salience network structural integrity predicts executive impairment in alcohol use disorders. Sci. Rep. 8, 14481
(2018).
41. Crespi, C. et al. Microstructural damage of white-matter tracts connecting large-scale networks is related to impaired executive
profile in alcohol use disorder. NeuroImage Clin. 25, 102141 (2020).
42. Crespi, C. et al. Executive impairment in Alcohol Use Disorder reflects structural changes in large-scale brain networks: a joint
Independent Component Analysis on grey-matter and white-matter features. Front. Psychol 10, 2479 (2019).
43. Ritov, I. Probability of regret: anticipation of uncertainty resolution in choice. Organ. Behav. Hum. Decis. Process. 66, 228 (1996).
44. Brewer, N. T., DeFrank, J. T. & Gilkey, M. B. Anticipated regret and health behavior: a meta-analysis. Heal. Psychol. 35, 1264–1275
(2016).
45. Reid, R. L. The psychology of the near miss. J. Gambl. Behav. 2, 32–39 (1986).
46. Dixon, M. R. & Schreiber, J. E. Near-miss effects on response latencies and win estimations of slot machine players. Psychol. Rec.
54, 335–348 (2004).
47. The diagnostic and statistical manual of mental disorders (5th ed.). American Psychiatric Association. Arlington, (2013).
Acknowledgements
We wish to thank Dr. Giovanni Vittadini for his valuable contribution in patient recruitment and clinical
assessment.
Author contributions
C.G., G.B. and N.C. participated in study design and data collection; C.G., C.C. and N.C. performed data analysis
and interpretation; C.G. drafted the main manuscript; All authors reviewed the manuscript.
Competing interests
The authors declare no competing interests.
Scientific Reports | (2020) 10:12104 | https://doi.org/10.1038/s41598-020-68942-y 9
Vol.:(0123456789)www.nature.com/scientificreports/
Additional information
Correspondence and requests for materials should be addressed to C.C.
Reprints and permissions information is available at www.nature.com/reprints.
Publisher’s note Springer Nature remains neutral with regard to jurisdictional claims in published maps and
institutional affiliations.
Open Access This article is licensed under a Creative Commons Attribution 4.0 International
License, which permits use, sharing, adaptation, distribution and reproduction in any medium or
format, as long as you give appropriate credit to the original author(s) and the source, provide a link to the
Creative Commons license, and indicate if changes were made. The images or other third party material in this
article are included in the article’s Creative Commons license, unless indicated otherwise in a credit line to the
material. If material is not included in the article’s Creative Commons license and your intended use is not
permitted by statutory regulation or exceeds the permitted use, you will need to obtain permission directly from
the copyright holder. To view a copy of this license, visit http://creativecommons.org/licenses/by/4.0/.
© The Author(s) 2020
Scientific Reports | (2020) 10:12104 | https://doi.org/10.1038/s41598-020-68942-y 10
Vol:.(1234567890)You can also read