THE CLINICAL SIGNIFICANCE OF THE T2-FLAIR MISMATCH SIGN IN GRADE II AND III GLIOMAS: A POPULATION-BASED STUDY - DIVA
←
→
Page content transcription
If your browser does not render page correctly, please read the page content below
Corell et al. BMC Cancer     (2020) 20:450
https://doi.org/10.1186/s12885-020-06951-w

 RESEARCH ARTICLE                                                                                                                                  Open Access

The clinical significance of the T2-FLAIR
mismatch sign in grade II and III gliomas: a
population-based study
Alba Corell1,2* , Sandra Ferreyra Vega2, Nickoleta Hoefling3,4, Louise Carstam1,2, Anja Smits2,5,
Thomas Olsson Bontell6,7, Isabella M. Björkman-Burtscher3,4, Helena Carén8 and Asgeir Store Jakola1,2,9

  Abstract
  Background: The T2-FLAIR mismatch sign is an imaging finding highly suggestive of isocitrate dehydrogenase
  mutated (IDH-mut) 1p19q non-codeleted (non-codel) gliomas (astrocytomas). In previous studies, it has shown
  excellent specificity but limited sensitivity for IDH-mut astrocytomas. Whether the mismatch sign is a marker of a
  clinically relevant subtype of IDH-mut astrocytomas is unknown.
  Methods: We included histopathologically verified supratentorial lower-grade gliomas (LGG) WHO grade II-III retrospectively
  during the period 2010–2016. In the period 2017–2018, patients with suspected LGG radiologically were prospectively
  included, and in this cohort other diagnoses than glioma could occur. Clinical, radiological and molecular data were
  collected. For clinical evaluation we included all patients with IDH-mut astrocytomas. In the 2010–2016 cohort DNA
  methylation analysis with Infinium MethylationEPIC BeadChip (Illumina) was performed for patients with an IDH-mut
  astrocytoma with available tissue. We aimed to examine the association of the T2-FLAIR mismatch sign with clinical factors
  and outcomes. Additionally, we evaluated the diagnostic reliability of the mismatch sign and its relation to methylation
  profiles.
  Results: Out of 215 patients with LGG, 135 had known IDH-mutation and 1p19q codeletion status. Fifty patients had an
  IDH-mut astrocytoma and 12 of these (24.0%) showed a mismatch sign. The sensitivity and specificity of the mismatch sign
  for IDH-mut detection were 26.4 and 97.6%, respectively. There were no differences between patients with an IDH-mut
  astrocytoma with or without mismatch sign when grouped according to T2-FLAIR mismatch sign with respect to baseline
  characteristics, clinical outcomes and methylation profiles. The overall interrater agreement between neuroradiologist and
  clinical neurosurgeons for the T2-FLAIR mismatch sign was significant when all 215 MRI examination assessed (κ = 0.77, p <
  0.001, N = 215).
  Conclusion: The T2-FLAIR mismatch sign in patients with an IDH-mut astrocytoma is not associated with clinical
  presentation or outcome. It seems unlikely that the IDH-mut astrocytomas with mismatch sign represent a specific subentity.
  Finally, we have validated that the T2-FLAIR mismatch sign is a reliable and specific marker of IDH-mut astrocytomas.
  Keywords: Astrocytoma, Oligodendroglioma, Biomarkers, Decision making, prognosis

* Correspondence: alba.corell@vgregion.se
1
 Department of Neurosurgery, Sahlgrenska University Hospital, Gothenburg,
Sweden
2
 Department of Clinical Neuroscience, Institute of Neuroscience and
Physiology, University of Gothenburg, Sahlgrenska Academy, Gothenburg,
Sweden
Full list of author information is available at the end of the article

                                       © The Author(s). 2020 Open Access This article is licensed under a Creative Commons Attribution 4.0 International License,
                                       which permits use, sharing, adaptation, distribution and reproduction in any medium or format, as long as you give
                                       appropriate credit to the original author(s) and the source, provide a link to the Creative Commons licence, and indicate if
                                       changes were made. The images or other third party material in this article are included in the article's Creative Commons
                                       licence, unless indicated otherwise in a credit line to the material. If material is not included in the article's Creative Commons
                                       licence and your intended use is not permitted by statutory regulation or exceeds the permitted use, you will need to obtain
                                       permission directly from the copyright holder. To view a copy of this licence, visit http://creativecommons.org/licenses/by/4.0/.
                                       The Creative Commons Public Domain Dedication waiver (http://creativecommons.org/publicdomain/zero/1.0/) applies to the
                                       data made available in this article, unless otherwise stated in a credit line to the data.
Corell et al. BMC Cancer (2020) 20:450 Page 2 of 10 Background We aimed to evaluate clinical parameters including ex- Lower-grade gliomas (LGG) are intra-axial neoplasms of tent of resection with regard to mismatch sign. In addition, the brain, including WHO grade II and III astrocytomas we analyzed if IDH-mut astrocytomas with mismatch sign and oligodendrogliomas according to the WHO 2016 had similar methylation profiles compared to samples with- classification and The Cancer Genome Atlas Research out mismatch sign. Finally, we provide interrater variability Network [1, 2]. These subgroups are based upon deter- between neurosurgeons and neuroradiologist and the sensi- mination of mutation in the isocitrate dehydrogenase tivity and specificity of the mismatch sign. genes 1 or 2 (IDH1 and IDH2), and 1p19q codeletion status [3, 4]. In addition to providing tumor classifica- tion, these markers also provide important prognostic Methods information [1, 2, 4–6]. All patients in the Västra Götaland region in Sweden with Biomarkers are the fundamental keystones of personal- newly diagnosed primary intracranial intra-axial tumors are ized management strategies, but the traditional bio- managed in a multidisciplinary team (MDT) with weekly markers analyzed in tumor tissue come into play only conferences at the Sahlgrenska University Hospital. The after the surgical procedure. Thus, in the neurosurgical neurosurgical department at the Sahlgrenska University decision making, image-based biomarkers are of particu- Hospital in Gothenburg covers the population of approxi- lar interest to identify relevant subgroups of patients. mately 1.7 million inhabitants. The newly described imaging feature of T2-FLAIR (fluid Our cohort consists of two components; one retrospect- attenuation inversion recovery) mismatch sign has ive cohort and one prospective. For patient selection see gained increased attention, since it is a widely available flowchart in Fig. 1. We performed a retrospective collec- and simple potential imaging marker to predict IDH- tion of clinical and radiological data between 2010 and mutated (IDH-mut) 1p19q non-codeleted (non-codel) 2016, searching operation logs and pathology database, gliomas (astrocytoma) with high specificity [7, 8]. The thus covering all patients with a histopathological diagno- T2-FLAIR mismatch sign (further also referred to as sis of a supratentorial infiltrating WHO grade II or III gli- mismatch sign) is characterized by a hyperintense signal oma with magnetic resonance imaging (MRI) [1, 16]. on T2-weighted sequences and a hypointense signal on In the years 2017 and 2018, we included patients pro- FLAIR sequences with a hyperintense peripheral rim, see spectively based on a high suspicion of LGG grade II and Supplementary Figs. 1, 2 and 3 as examples. III, referred either to the MDT conference or directly to DNA methylation analysis is in the frontline of diagnostic the neurosurgical department. In principle, our cohort technology in gliomas [9–11]. The tumors showing a mis- consists of lesions indicative of primary brain tumor match sign on MRI differ radiologically from gliomas with- with hyperintense signal in T2 weighted images, but out the mismatch sign with their distinct features. This with no significant contrast enhancement. In this cohort, raises questions regarding underlying biology. Studies so other histopathological diagnoses may be encountered far, however, have not indicated that this radiological (e.g. other tumor subgroups or even non-neoplastic le- marker is reflected by a specific biological signature [7, 12]. sions). The rationale for “blindly” including these pa- An important question remains whether IDH-mut as- tients was to enable the evaluation of the mismatch sign trocytomas with or without mismatch sign reflect differ- in a group with rather similar MRI appearance, but also ences of clinical relevance, including resectability, based differential diagnoses of LGG, in contrast to most previ- on the T2-weighted appearance being homogeneous and ous studies that used histopathology as selection [7, 17]. well demarcated or not. For instance, if IDH-mut astro- We used MRI images from all patients in the retro- and cytomas with mismatch sign can be depicted by neuro- prospective cohorts to perform the interrater evaluation of imaging as more “resectable”, this tool would provide the T2-FLAIR mismatch sign (N = 215). In further clinical important information prior to surgery, where the extent evaluations, we analyzed the mismatch sign in patients of resection is of particular importance for patients with with known IDH-mut gliomas without 1p19q codeletion IDH-mut astrocytomas [13, 14]. In addition, institu- from both cohorts (N = 50). The DNA methylation was tional experience from neurosurgeons over the years performed in patients from the retrospective cohort with has led to speculations about differences in texture in IDH-mut non-codel gliomas (N = 29). some tumors, being softer or more gelatinous and Clinical variables such as patients’ age, sex, symptoms perhaps easier to remove. Since size, location and at diagnosis and Karnofsky functional status [18] were proximity to critical structures are of such importance recorded. For basic radiological variables we included in surgical decision-making, the identification of an main lobe involved, tumor border (absent, mild/moder- imaging marker pointing towards factors affecting re- ate or conspicuous) and eloquence [19]. We analyzed section, could indeed alter surgical management, espe- patients with IDH-mut astrocytomas divided into two cially in complicated cases [15]. groups, with or without mismatch sign.
Corell et al. BMC Cancer     (2020) 20:450                                                                     Page 3 of 10

 Fig. 1 Flowchart of patient inclusion

Image acquisition                                                T2-FLAIR mismatch analysis
MRI examinations reviewed in this project were per-              The MRI scans were evaluated for the T2-FLAIR mis-
formed at different hospitals as part of the clinical pre-       match sign as done by Patel et al [7]. Evaluation was in-
operative work up in these tumor patients. MRI systems           dependently performed by a neurosurgical resident
used for image acquisition included both 1.5 T and 3.0 T         (AC), a senior neurosurgeon (ASJ) and a board certified
scanners from different vendors (GE Healthcare, US;              neuroradiologist (NH). In case of disagreement between
Philips, The Netherlands; Siemens Healthcare, Germany)           the clinicians a consensus reading was performed be-
and with different software releases. 2D sequences with          tween the neurosurgeons and interrater agreement was
accepted slice thicknesses ≤5 mm were predominant. For           calculated. The consensus was then compared to the in-
T2-weighted sequences, median repetition time was                dependent reading of the neuroradiologists (interrater
4000 milliseconds (ms) and median echo time was 100              agreement) and in case of disagreement, a final consen-
ms. For FLAIR examinations, median repetition time               sus reading was performed with a senior neuroradiolo-
was 9000 ms, median echo time was 122 ms, and median             gist (IBB).
inversion time was 2500 ms. All scanners underwent
regular maintenance by the vendors and sequences were
optimized by the hospitals for clinical evaluation of brain      Tumor segmentation
lesions such as brain tumors.                                    Both T2 and FLAIR sequences were used for tumor vol-
                                                                 ume segmentation, depending on which sequence the
                                                                 tumor was more clearly visible. FLAIR was often used in
Image evaluation                                                 the preoperative MRI. Due to surgically-induced arti-
Images were analyzed for: main lobe involved (frontal,           facts, T2 was sometimes preferred in the postoperative
temporal, parietal, occipital, insula), side (right, left, bi-   MRI and evaluation was done on a case-by-case basis.
lateral), border (absent, mild/moderate or conspicuous),         This selection was done up-front, and we did not seg-
eloquence [19], T2-FLAIR mismatch (yes/no), and size             ment both T2 and FLAIR sequences with later selection
(volume by tumor segmentation).                                  of the more “beneficial” one.
Corell et al. BMC Cancer (2020) 20:450 Page 4 of 10
The tumor volume was evaluated by semi-automatic data independent sample t-test or Mann-Whitney U test
segmentation performed with the open-source software were used as appropriate based upon data distribution.
“3DSlicer”, version 4.6.2 [20]. For the segmentation of Interrater agreement between the clinical assessment by
tumor volume, we used the tools “LevelTracingEffect”, neurosurgeons and neuroradiologist for the presence or
“WandEffect”, “DrawEffect” and “PaintEffect” in the absence of the mismatch sign was assessed with Cohen’s
“Editor” module when appropriate. Tumor volumes were kappa statistic (k) [25]. We considered > 0.6 to be substan-
computed by the segmentation of hyperintensive areas tial agreement, 0.41–0.6 moderate agreement, 0.21–0.4
on the T2 or FLAIR sequence on MRI examinations. fair agreement and ≤ 0.2 slight agreement [25]. To evaluate
Areas attributed to mainly edema without convincing the interrater agreement, we used all patients in the retro-
signs of tumor invasion were excluded. In the gliomas spective and prospective cohort, regardless of molecular
with T2-FLAIR mismatch sign we used the outer margin status. Finally, we present sensitivity and specificity for
of the peripheral rim on FLAIR images as the outer T2-FLAIR mismatch sign as a marker to identify IDH-
tumor border. Segmentation was performed by the mut astrocytomas.
neurosurgical resident (AC) with quality control in all
cases from a senior neurosurgeon (ASJ) and neuroradio- Ethics statement
logical expertise used in selected cases. This project was approved by the regional ethical com-
mittee in the region of Västra Götaland (DNR 1067–16
DNA methylation array and DNR 363–17).
DNA from formalin-fixed paraffin embedded (FFPE) tu-
mors from patients included in the retrospective cohort Results
was isolated with the QIAamp® DNA FFPE kit (Qiagen, Clinical factors and outcomes
Hilden, Germany) according to the supplier’s instruc- Our patient cohort included retro- and prospectively
tions with the addition of an extra digestion step with 135 patients with available MRI images and known sta-
proteinase K overnight. DNA concentration was mea- tus of IDH-mutation and 1p19q codeletion. The retro-
sured with the Qubit Fluorometer (Life technologies™, spective part of the cohort included 82 patients with
Carlsbad, CA, USA). Between 500 and 1000 ng DNA mean age of 45.0 years (SD 14.3) and 37 patients (45.1%)
was bisulfite-converted with the EZ DNA methylation were females. The majority of this cohort underwent re-
kit (D5001, Zymo Research, Irvine, CA, USA) and the section, as opposed to biopsy only (N = 77, 93.9%).
methylation levels of restored bisulfite-converted DNA In the prospective part, we evaluated 58 patients with a
was determined with the Infinium MethylationEPIC suspected LGG. This included both neoplastic and non-
BeadChip (Illumina®, San Diego, CA, USA) according to neoplastic diagnoses, such as limbic encephalitis. Of
the protocols provided by the supplier. these, 53 patients had known status of IDH-mutation
Methylation analysis and normalization was performed and 1p19q codeletion. In this cohort, 22 patients were
as previously described [21]. Briefly, methylation data female (41.5%) and the mean age was 47.9 years (SD
were processed with the statistical software R (version 15.7). Resection was the most common surgical treat-
3.6.1) using the Minfi [22] and ChAMP [22–24] pack- ment (n = 46, 86.8%). The most common histopatho-
ages. IDH mutational status was acquired using a pub- logical diagnoses were WHO grade II or III astrocytoma
lished DNA methylation-based classifier [9]. 1p19q (N = 27, 50.9%), oligodendroglioma (N = 21, 36.9%) and
codeletion status was acquired through copy number glioblastoma (N = 4, 7.5%). Other diagnoses included
variations inferred from the array. Correlation between non-neoplastic lesions such as limbic encephalitis. In
the T2-FLAIR mismatch sign and DNA-methylation addition, one patient (1.9%) had other diagnosis (DNET).
profiles was evaluated by unsupervised hierarchical clus- The mismatch sign was not present in any of the non-
tering of the 5000 most variable CpG sites including neoplastic diagnoses, or in the patient with DNET.
only patients with IDH-mut non-codel gliomas (N = 29). In total there were 50 patients with IDH-mut astrocy-
toma. These were grouped based upon presence of T2-
Statistics FLAIR mismatch sign (N = 12, 24.0%) or absence (N = 38,
All statistical analyses were done with SPSS, version 24.0 76.0%). In Table 1 we present comparison between these
(Chicago, IL, USA). Statistical significance level was set to groups with respect to baseline characteristics, radiological
p < 0.05 and all tests were two-sided. Central tendencies variables and clinical outcome. The only significant differ-
were presented as means ± standard deviation (SD), or ence was a more conspicuous tumor border in the group
median and first quartile (Q1) to third quartile (Q3) if with mismatch sign (p = 0.02). There were no differences
skewed. Categorical data were analyzed with Pearson’s chi regarding tumor location, pre- and postoperative volumes,
square test, but in 2 × 2 tables Fishers exact test was used symptoms or type of surgery. Importantly, there were no
when appropriate due to small sample. For continuous differences between groups with respect to the extent ofCorell et al. BMC Cancer (2020) 20:450 Page 5 of 10
Table 1 Presentation and outcomes in patients diagnosed between 2010 and 2018 with IDH-mut astrocytomas (N = 50), presented
in relation to the T2-FLAIR mismatch sign presence or absence
Mismatch (N = 12, 24.0%) No mismatch (N = 38, 76.0%) P-value
Age, years, mean (SD) 35.7 (12.6) 41.9 (14.4) 0.06
Female, n (%) 7 (58.3) 16 (42.1) 0.51
Main lobe involved, n (%)
Frontal 7 (58.3) 17 (44.7) 0.51
Temporal 3 (25.0) 13 (34.2) 0.73
Parietal 2 (16.7) 7 (18.4) 1.00
Insula 0 (0.0) 1 (2.6) 1.00
Image findings, n (%)
Right side 6 (50.0) 15 (39.5) 0.74
Left side 6 (50.0) 23 (60.5) 0.74
Bilateral/midline 0 (0.0) 5 (13.2) 0.32
Conspicuous border 9 (75.0) 12 (31.6) 0.02
Eloquence 8 (66.7) 30 (78.9) 0.45
Symptom at diagnosisa, n (%)
Asymptomatic 0 (0.0) 3 (7.9) 1.00
Seizure 9 (75.0) 28 (73.7) 1.00
ICP related 3 (25.0) 11 (28.9) 1.00
Deficit(s) 0 (0.0) 5 (13.2) 0.32
Language deficit 2 (16.7) 2 (5.3) 0.24
Visual deficit 2 (16.7) 4 (10.5) 0.62
Cognitive changes 3 (25.0) 8 (21.1) 1.00
Other symptoms 1 (8.3) 10 (26.3) 0.25
Type of surgery, n (%)
Resection 11 (91.7) 37 (97.4) 0.43
Volumetric measurements
Preoperative volume, ml, median (Q1-Q3) 47.4 (29.71–113.61) N = 11 63.3 (26.52–115.32) N = 37 0.91
Postoperative volume, ml, median (Q1-Q3) 5.9 (1.67–14.81) N = 11 5.0 (0.34–16.42) N = 37 0.99
Extent of resection, median % (Q1-Q3) 87.9 (73.60–96.63) N = 11 89.2 (48.50–99.75) N = 37 0.91
WHO grade, n (%)
WHO grade II 5 (41.7) 24 (63.2) 0.31
WHO grade III 6 (50.0) 13 (34.2) 0.50
WHO grade IV 1 (8.3) 1 (2.6) 0.43
a
More than one symptom at presentation possible. Other symptoms included paresthesia, vertigo, dysphagia, among others
resection (87.9% with mismatch sign and 89.2% without mismatch sign (see Fig. 2a-b and 3a-b). In the prospective
mismatch sign, p = 0.91) or survival (median of 85 months cohort, the lesion of 5 patients (8.6%) showed a mismatch
in cohort with mismatch sign vs 65 months without mis- sign, all of them being IDH-mut astrocytoma whereof one
match sign, p = 0.91). being WHO grade IV (glioblastoma, see Fig. 4a-b). One
patient with a DNET did not show a positive T2-FLAIR
Diagnostic properties mismatch sign.
Nine patients (10.9%) in the retrospective part of the co- In the joint cohort with known molecular status, in-
hort showed mismatch signs and all of them had IDH-mu- cluding both IDH-mutation and 1p19q codeletion (N =
tated gliomas. There were no patients with a glioma with 135), the specificity for IDH-mut astrocytomas was
IDH-wild type and mismatch sign in the retrospective co- 97.6% and the sensitivity was 26.4%. The positive
hort. However, we identified two patients with 1p19q predictive value (PPV) was 85.7% and the negative pre-
codeletion (codel) tumors (oligodendrogliomas) and dictive value (NPV) was 67.7%.Corell et al. BMC Cancer (2020) 20:450 Page 6 of 10
Fig. 2 a-b: a) FLAIR sequence demonstrating a relative hypointense signal with the exception of a hyperintense peripheral rim. b) T2W sequence
demonstrating homogenous hyperintensive signal with a conspicuous border. This glioma was considered to have a mismatch sign and was
diagnosed with an IDH-mutated and 1p19q codeleted glioma (i.e. oligodendroglioma)
Interrater agreement hierarchical clustering with respect to the 5000 most devi-
We evaluated 215 cases for the mismatch sign and it ating CpG sites in the methylation array grouped the
was found in 17 cases (7.9%), absent in 189 cases IDH-mut astrocytomas into two main clusters as demon-
(87.9%), while 9 cases were discordant (4.2%), as demon- strated in Fig. 6. However, patients with mismatch sign
strated in Fig. 5. The total number of patients with mis- did not cluster together.
match sign was 21 (9.8%) after we reached consensus for
the 9 discordant cases (discordant cases are presented in
Supplementary material). The interrater agreement for Discussion
the mismatch sign between clinical neurosurgeons was In this study there were no differences between IDH-
at a kappa value of 0.74 (p = 0.064), and between clinical mut astrocytomas with or without the mismatch sign
neurosurgeons and neuroradiologist 0.77 (p < 0.001). with respect to extent of resection or any other clinical
outcome parameter. Further, IDH-mut non-codel gli-
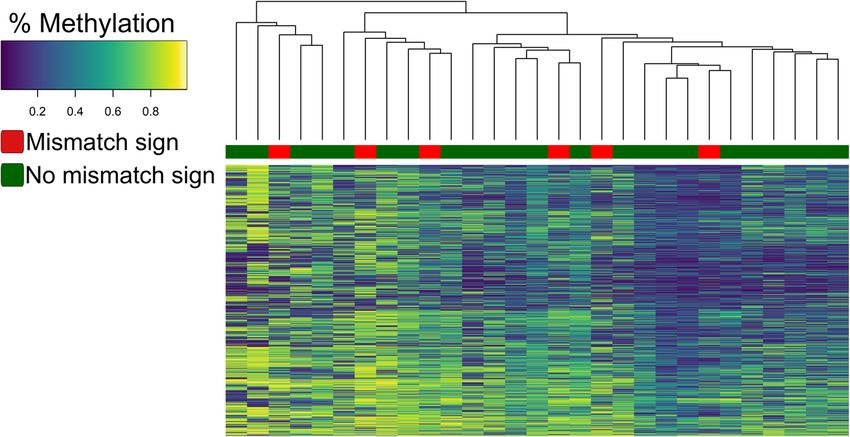
Molecular markers and genome-wide DNA methylation omas (astrocytomas) with mismatch sign did not harbor
array, retrospective cohort a unique methylation profile. The only difference we
DNA methylation profiling was performed for IDH-mut found between the patients with IDH-mut astrocytomas
astrocytomas in the retrospective cohort where sufficient with mismatch sign and those without was related to the
tumor tissue was available (N = 29) to determine of pa- imaging finding itself. However, we validate that the T2-
tients with a mismatch sign (N = 6) clustered together in- FLAIR mismatch sign has substantial interrater agree-
dicating a particular biological profile. Unsupervised ment and high specificity for IDH-mut astrocytomas.
Fig. 3 a-b: a) FLAIR sequence demonstrating a relative hypointense signal with the exception of a hyperintense peripheral rim. b) T2W sequence
demonstrating homogenous hyperintensive signal with a conspicuous border. This glioma was considered to have a mismatch sign and was
diagnosed with an IDH-mutated and 1p19q codeleted glioma (i.e. oligodendroglioma)Corell et al. BMC Cancer (2020) 20:450 Page 7 of 10 Fig. 4 a-b: a) FLAIR sequence demonstrating a relative hypointense signal with the exception of a hyperintense peripheral rim. b) T2W sequence demonstrating homogenous hyperintensive signal with a conspicuous border. This glioma was considered to have a mismatch sign and the histopathological diagnosis was glioblastoma (i.e. astrocytoma WHO grade IV, IDH-mut) The clinical implications of mismatch sign are currently between groups, hence mismatch sign should not be limited to this particular association. taken as a factor influencing extent of resection in IDH- During surgery it is evident that gliomas may vary in mut astrocytomas. To our knowledge, this is the first texture and appearance, and with the radiological image study investigating the clinical factors and extent of re- of homogenous signal on T2-weighted sequences and section in relation to the mismatch sign. One previous seemingly conspicuous tumor border, the question was study evaluated the association between survival and the raised whether the extent of the resection is related to mismatch sign, with a median follow-up of 65.7 months, the mismatch sign. This may be of particular import- and found no differences in overall survival between ance, since the IDH-mut astrocytoma group seems to be groups [7]. This finding that mismatch sign does not in- the one benefitting most from extensive surgery [13, 14, dicate a particular prognostic group is further corrobo- 26]. In our cohort, the extent of resection did not differ rated by our data. Fig. 5 Overview over MRI mismatch sign assessment and agreement among raters
Corell et al. BMC Cancer     (2020) 20:450                                                                                              Page 8 of 10

 Fig. 6 Unsupervised hierarchical clustering analysis on methylation levels for the 5000 most deviating CpG sites in the EPIC methylation array. A
 value of 0.2 indicated low percentage of methylation and 0,8 a high percentage of methylation. Clustering of the DNA-methylation profiles for
 the IDH-mut astrocytomas in the retrospective cohort (N = 29) did not identify a T2-FLAIR mismatch-methylation associated phenotype

   Our results on interrater variability validate the data                  useful in a clinical setting for individual cases [12, 17, 28,
from Broen et al, who found a kappa value of 0.75,                          29]. Adding advanced imaging parameters like apparent dif-
which is considered a substantial interrater agreement                      fusion coefficient (ADC) and cerebral blood volume (CBV)
[17, 25]. According to the literature, a kappa value                        to the mismatch sign may further improve the diagnostic
within the range of 0.56–0.79 is moderate to substantial                    capabilities of IDH-mut astrocytomas, although at the cost
[7, 17, 25, 27]. Thus, the collective experience so far is                  of increased complexity [30–33].
that the T2-FLAIR mismatch sign can reliably be de-                           In an effort to understand the biological importance of
tected in clinical practice [7, 17, 27].                                    the mismatch sign, we used DNA methylation analyses
   It should be noted that we tested the diagnostic proper-                 and unsupervised hierarchical clustering in a small sub-
ties of the mismatch sign with different patient selections,                sample of patients with IDH-mut astrocytoma from the
which is a strength compared to a pure histopathological                    retrospective cohort. Clustering analysis could not distin-
selection in previous studies [7, 12, 17]. In our selection                 guish between samples with mismatch sign from those
based upon histopathology, we identified two patients with                  without. Thus, this could indicate that the mismatch sign
mismatch sign who had IDH-mut codel glioma, unlike pre-                     did not have a common overall methylation profile. The
vious studies by Broen et al and Patel et al who presented a                only other in-depth analysis of biology so far was per-
100% specificity for IDH-mut astrocytomas [7, 17]. How-                     formed by Patel el al, who found no convincing differ-
ever, later reports had made similar findings to ours, and                  ences in biology, including methylation analysis [34].
the overall specificity reported in the literature is therefore             Finally, since survival is consistently reported not to differ
in the range of 96.0–100.0% [7, 8, 12, 17, 28]. The mis-                    between groups with or without mismatch sign [7], it
match sign has been found occasionally in IDH-mut codel                     seems unlikely that the patients with mismatch sign con-
gliomas, but also in pediatric low-grade brain tumors. This                 stitute a specific type of IDH-mut astrocytomas.
far, the mismatch sign has been reported in pilomyxoid
astrocytoma, LGG harboring MYB rearrangement, oligo-
dendroglioma (IDH-mut codel), and even in one patient                       Strength and limitations
with a non-neoplastic lesion [8].                                           Strengths of this study include the both histopatho-
   In our selection of patients with radiologically suspected               logical and image-based selection in the evaluation of
LGG other tumor diagnoses may also be encountered. In-                      the T2-FLAIR mismatch sign. Our prospective cohort of
deed, one patient in this prospective cohort with T2-FLAIR                  patients with suspected LGG reflects clinical neuro-
mismatch sign had an IDH-mut glioblastoma, suggesting                       oncology practice, where also other relevant diagnoses
that the mismatch sign is not grade specific. Importantly,                  may be encountered at times. The small sample size is
there were no other differential diagnoses beyond diffuse                   one limitation, especially for the methylation subsample
gliomas that presented with the mismatch sign. Although                     analyses. For survival analyses, a longer follow-up would
of low sensitivity (27.1–51.0%), the specificity for IDH-mut                have been preferable, as a part of the cohort recently
astrocytomas renders the evaluation of mismatch sign                        underwent surgical treatment. Since this was an
Corell et al. BMC Cancer         (2020) 20:450                                                                                                         Page 9 of 10

exploratory study of clinical factors associated with the                          Hospital and funding from the Swedish Research Council (2017–00944). The
mismatch sign, we did not adjust for multiple compari-                             sponsors had no role in the design or conduct of this research.
                                                                                   Open access funding provided by University of Gothenburg.
sons and thereby increasing the chance of false positive
associations simply by chance. However, we did not find                            Availability of data and materials
any significant association, even without this adjustment.                         The datasets used and analyzed during the current study are available from
                                                                                   the corresponding author on reasonable request.

Conclusion                                                                         Ethics approval and consent to participate
The T2-FLAIR mismatch sign in patients with IDH-mut                                This project was approved by the regional ethical committee in the region
                                                                                   of Västra Götaland (DNR 1067–16 and DNR 363–17).
astrocytomas was not found to be associated with clin-
ical variables such as presenting symptoms, extent of re-                          Consent for publication
section, or survival. Methylation analysis further                                 Not applicable. Informed consent waived by the ethical committee.
strengthens the previous indications that the IDH-mut
                                                                                   Competing interests
astrocytomas with mismatch sign does not compromise                                All authors certify that they have no affiliations with or involvement in any
a specific subentity. Finally, we validate the T2-FLAIR                            organization or entity with any financial interest (such as honoraria;
mismatch sign as a reliable marker with high specificity                           educational grants; participation in speakers’ bureaus; membership,
                                                                                   employment, consultancies, stock ownership, or other equity interest; and
of IDH-mut astrocytomas, but with limited sensitivity.                             expert testimony or patent-licensing arrangements), or non-financial interest
                                                                                   (such as personal or professional relationships, affiliations, knowledge or be-
                                                                                   liefs) in the subject matter or materials discussed in this manuscript.
Supplementary information
Supplementary information accompanies this paper at https://doi.org/10.
                                                                                   Author details
1186/s12885-020-06951-w.                                                           1
                                                                                    Department of Neurosurgery, Sahlgrenska University Hospital, Gothenburg,
                                                                                   Sweden. 2Department of Clinical Neuroscience, Institute of Neuroscience and
 Additional file 1: Supplementary material. “Data discordant cases T2-             Physiology, University of Gothenburg, Sahlgrenska Academy, Gothenburg,
 FLAIR mismatch sign”                                                              Sweden. 3Department of Radiology, Sahlgrenska University Hospital,
 Additional file 2: Supplementary Fig. 1a-b. I a) FLAIR sequence                   Gothenburg, Sweden. 4Department of Radiology, Institute of Clinical
 demonstrating a relative hypointense signal with the exception of a               Sciences, Sahlgrenska Academy, University of Gothenburg, Gothenburg,
 hyperintense peripheral rim. b) T2W sequence demonstrating                        Sweden. 5Department of Neuroscience, Neurology, Uppsala University,
 homogenous hyperintensive signal with a conspicuous border. This                  Uppsala, Sweden. 6Department of Clinical Pathology and Cytology,
 glioma was considered to have a mismatch sign.                                    Sahlgrenska University Hospital, Gothenburg, Sweden. 7Department of
                                                                                   Physiology, Institute of Neuroscience and Physiology, University of
 Additional file 3: Supplementary Fig. 2a-b. a) FLAIR sequence                     Gothenburg, Sahlgrenska Academy, Gothenburg, Sweden. 8Sahlgrenska
 demonstrating a relative hypointense signal with the exception of a               Cancer Center, Department of Laboratory Medicine, Institute of Biomedicine,
 hyperintense peripheral rim. b) T2W sequence demonstrating                        Sahlgrenska Academy, University of Gothenburg, Gothenburg, Sweden.
 homogenous hyperintensive signal with a conspicuous border. This                  9
                                                                                    Department of Neuromedicine and Movement Science, NTNU, Trondheim,
 glioma was considered to have a mismatch sign.                                    Norway.
 Additional file 4: Supplementary Fig. 3a-b. a) FLAIR sequence
 demonstrating hyperintensive signal with diffuse border. b) T2W                   Received: 12 December 2019 Accepted: 11 May 2020
 sequence demonstrating hyperintensive signal with diffuse border. This
 glioma was considered not to have a mismatch sign.
                                                                                   References
                                                                                   1. Louis DN, Perry A, Reifenberger G, von Deimling A, Figarella-Branger D,
Abbreviations
                                                                                       Cavenee WK, Ohgaki H, Wiestler OD, Kleihues P, Ellison DW. The 2016 World
ADC: Apparent diffusion coefficient; CBV: Cerebral blood volume;
                                                                                       Health Organization classification of tumors of the central nervous system: a
Codel: 1p19q codeleted; DNET: Dysembryoplastic neuroepithelial tumor;
                                                                                       summary. Acta Neuropathol. 2016;131(6):803–20.
FLAIR: Fluid-attenuated inversion recovery; IDH1 and 2: Isocitrate
                                                                                   2. Brat DJ, Verhaak RG, Aldape KD, Yung WK, Salama SR, Cooper LA, Rheinbay
dehydrogenase genes 1 and 2; IDH-mut: Isocitrate dehydrogenase gene
                                                                                       E, Miller CR, Vitucci M, Morozova O, et al. Comprehensive, integrative
mutation; LGG: Lower-grade gliomas, defined as WHO grade II and grade III
                                                                                       genomic analysis of diffuse lower-grade Gliomas. N Engl J Med. 2015;
diffuse gliomas; MDT: Multidisciplinary team; MRI: Magnetic resonance
                                                                                       372(26):2481–98.
imaging; NPV: Negative predictive value; Non-codel: 1p19q non-codeleted;
                                                                                   3. Claus EB, Walsh KM, Wiencke JK, Molinaro AM, Wiemels JL, Schildkraut JM,
NPV: Negative predictive value; Mismatch sign: T2-FLAIR mismatch sign
                                                                                       Bondy ML, Berger M, Jenkins R, Wrensch M. Survival and low-grade glioma:
                                                                                       the emergence of genetic information. Neurosurg Focus. 2015;38(1):E6.
Acknowledgments                                                                    4. Etxaniz O, Carrato C, de Aguirre I, Queralt C, Munoz A, Ramirez JL, Rosell R,
We would like to thank Tomás Gómez Vecchio, research assistant at the                  Villa S, Diaz R, Estival A, et al. IDH mutation status trumps the Pignatti risk
institute of Neuroscience and Physiology, Sahlgrenska Academy,                         score as a prognostic marker in low-grade gliomas. J Neuro-Oncol. 2017;
Gothenburg, Sweden, for assistance with data management.                               135(2):273–84.
                                                                                   5. Sun H, Yin L, Li S, Han S, Song G, Liu N, Yan C. Prognostic significance of
Authors’ contributions                                                                 IDH mutation in adult low-grade gliomas: a meta-analysis. J Neuro-Oncol.
AC, AS, LC, ASJ, NH and IBB performed the clinical and radiological data               2013;113(2):277–84.
collection and analysis. SFV, HC and TOB performed laboratory analysis and         6. Eckel-Passow JE, Lachance DH, Molinaro AM, Walsh KM, Decker PA, Sicotte
collected tissue for analysis. AC performed the statistical analyses. AC, AS and       H, Pekmezci M, Rice T, Kosel ML, Smirnov IV, et al. Glioma groups based on
AJ drafted the manuscript. All authors substantively revised the manuscript            1p/19q, IDH, and TERT promoter mutations in tumors. N Engl J Med. 2015;
and have approved the submitted version.                                               372(26):2499–508.
                                                                                   7. Patel SH, Poisson LM, Brat DJ, Zhou Y, Cooper L, Snuderl M, Thomas C,
Funding                                                                                Franceschi AM, Griffith B, Flanders AE, et al. T2-FLAIR mismatch, an imaging
This study received financial support in the form of ALF-grant (ALFGBG-                biomarker for IDH and 1p/19q status in lower-grade Gliomas: a TCGA/TCIA
716671 and ALFGBG2018–03591), funds of the Sahlgrenska University                      project. Clin Cancer Res. 2017;23(20):6078–85.
Corell et al. BMC Cancer (2020) 20:450 Page 10 of 10
8. Johnson DR, Kaufmann TJ, Patel SH, Chi AS, Snuderl M, Jain R. There is an 29. Ranganathan P, Aggarwal R. Common pitfalls in statistical analysis:
exception to every rule-T2-FLAIR mismatch sign in gliomas. Neuroradiology. understanding the properties of diagnostic tests - part 1. Perspect Clin Res.
2019;61(2):225–7. 2018;9(1):40–3.
9. Capper D, Jones DTW, Sill M, Hovestadt V, Schrimpf D, Sturm D, Koelsche C, 30. Cho HH, Lee SH, Kim J, Park H. Classification of the glioma grading using
Sahm F, Chavez L, Reuss DE, et al. DNA methylation-based classification of radiomics analysis. PeerJ. 2018;6:e5982.
central nervous system tumours. Nature. 2018;555(7697):469–74. 31. Gui C, Lau JC, Kosteniuk SE, Lee DH, Megyesi JF. Radiology reporting of low-
10. Wiestler B, Capper D, Sill M, Jones DT, Hovestadt V, Sturm D, Koelsche C, grade glioma growth underestimates tumor expansion. Acta Neurochir.
Bertoni A, Schweizer L, Korshunov A, et al. Integrated DNA methylation and 2019;161(3):569–76.
copy-number profiling identify three clinically and biologically relevant 32. Jakola AS, Reinertsen I. Radiological evaluation of low-grade glioma: time to
groups of anaplastic glioma. Acta Neuropathol. 2014;128(4):561–71. embrace quantitative data? Acta Neurochir. 2019;161(3):577–8.
11. Christensen BC, Smith AA, Zheng S, Koestler DC, Houseman EA, Marsit CJ, 33. Lee MK, Park JE, Jo Y, Park SY, Kim SJ, Kim HS. Advanced imaging
Wiemels JL, Nelson HH, Karagas MR, Wrensch MR, et al. DNA methylation, parameters improve the prediction of diffuse lower-grade gliomas subtype,
isocitrate dehydrogenase mutation, and survival in glioma. J Natl Cancer IDH mutant with no 1p19q codeletion: added value to the T2/FLAIR
Inst. 2011;103(2):143–53. mismatch sign. Eur Radiol. 2020;30(2):844–54.
12. Juratli TA, Tummala SS, Riedl A, Daubner D, Hennig S, Penson T, Zolal A, 34. de Souza CF, Sabedot TS, Malta TM, Stetson L, Morozova O, Sokolov A, Laird
Thiede C, Schackert G, Krex D, et al. Radiographic assessment of contrast PW, Wiznerowicz M, Iavarone A, Snyder J, et al. A distinct DNA methylation
enhancement and T2/FLAIR mismatch sign in lower grade gliomas: shift in a subset of Glioma CpG Island Methylator phenotypes during tumor
correlation with molecular groups. J Neuro-Oncol. 2019;141(2):327–35. recurrence. Cell Rep. 2018;23(2):637–51.
13. Delev D, Heiland DH, Franco P, Reinacher P, Mader I, Staszewski O,
Lassmann S, Grau S, Schnell O. Surgical management of lower-grade glioma
in the spotlight of the 2016 WHO classification system. J Neuro-Oncol. 2019;
Publisher’s Note
Springer Nature remains neutral with regard to jurisdictional claims in
141(1):223–33.
published maps and institutional affiliations.
14. Wijnenga MMJ, French PJ, Dubbink HJ, Dinjens WNM, Atmodimedjo PN,
Kros JM, Smits M, Gahrmann R, Rutten GJ, Verheul JB, et al. The impact of
surgery in molecularly defined low-grade glioma: an integrated clinical,
radiological, and molecular analysis. Neuro-oncology. 2018;20(1):103–12.
15. Ferroli P, Broggi M, Schiavolin S, Acerbi F, Bettamio V, Caldiroli D, Cusin A,
La Corte E, Leonardi M, Raggi A, et al. Predicting functional impairment in
brain tumor surgery: the big five and the Milan complexity scale. Neurosurg
Focus. 2015;39(6):E14.
16. Louis DN, Ohgaki H, Wiestler OD, Cavenee WK, Burger PC, Jouvet A,
Scheithauer BW, Kleihues P. The 2007 WHO classification of tumours of the
central nervous system. Acta Neuropathol. 2007;114(2):97–109.
17. Broen MPG, Smits M, Wijnenga MMJ, Dubbink HJ, Anten M, Schijns O,
Beckervordersandforth J, Postma AA, van den Bent MJ. The T2-FLAIR mismatch
sign as an imaging marker for non-enhancing IDH-mutant, 1p/19q-intact
lower-grade glioma: a validation study. Neuro-Oncology. 2018;20(10):1393–9.
18. Mor V, Laliberte L, Morris JN, Wiemann M. The Karnofsky performance status
scale. An examination of its reliability and validity in a research setting.
Cancer. 1984;53(9):2002–7.
19. Chang EF, Smith JS, Chang SM, Lamborn KR, Prados MD, Butowski N,
Barbaro NM, Parsa AT, Berger MS, McDermott MM. Preoperative prognostic
classification system for hemispheric low-grade gliomas in adults. J
Neurosurg. 2008;109(5):817–24.
20. Fedorov A, Beichel R, Kalpathy-Cramer J, Finet J, Fillion-Robin JC, Pujol S,
Bauer C, Jennings D, Fennessy F, Sonka M, et al. 3D slicer as an image
computing platform for the quantitative imaging network. Magn Reson
Imaging. 2012;30(9):1323–41.
21. Wenger A, Ferreyra Vega S, Kling T, Bontell TO, Jakola AS, Caren H.
Intratumor DNA methylation heterogeneity in glioblastoma: implications for
DNA methylation-based classification. Neuro-Oncol. 2019;21(5):616–27.
22. Aryee MJ, Jaffe AE, Corrada-Bravo H, Ladd-Acosta C, Feinberg AP, Hansen KD, Irizarry
RA. Minfi: a flexible and comprehensive bioconductor package for the analysis of
Infinium DNA methylation microarrays. Bioinformatics. 2014;30(10):1363–9.
23. Triche TJ Jr, Weisenberger DJ, Van Den Berg D, Laird PW, Siegmund KD.
Low-level processing of Illumina Infinium DNA methylation BeadArrays.
Nucleic Acids Res. 2013;41(7):e90.
24. Fortin JP, Triche TJ Jr, Hansen KD. Preprocessing, normalization and
integration of the Illumina HumanMethylationEPIC array with minfi.
Bioinformatics. 2017;33(4):558–60.
25. Landis JR, Koch GG. The measurement of observer agreement for
categorical data. Biometrics. 1977;33(1):159–74.
26. Jakola AS, Skjulsvik AJ, Myrmel KS, et al. Surgical resection versus watchful
waiting in low-grade gliomas. Ann Oncol. 2017;28(8):1942–48.
27. Batchala PP, Muttikkal TJE, Donahue JH, Patrie JT, Schiff D, Fadul CE,
Mrachek EK, Lopes MB, Jain R, Patel SH. Neuroimaging-based classification
algorithm for predicting 1p/19q-Codeletion status in IDH-mutant lower
grade Gliomas. AJNR Am J Neuroradiol. 2019;40(3):426–32.
28. Lasocki A, Gaillard F, Gorelik A, Gonzales M. MRI features can predict 1p/19q
status in intracranial Gliomas. AJNR Am J Neuroradiol. 2018;39(4):687–92.You can also read