Deep learning predicts postsurgical recurrence of hepatocellular carcinoma from digital histopathologic images - Nature
←
→
Page content transcription
If your browser does not render page correctly, please read the page content below
www.nature.com/scientificreports
OPEN Deep learning predicts postsurgical
recurrence of hepatocellular
carcinoma from digital
histopathologic images
Rikiya Yamashita1,2, Jin Long2, Atif Saleem3, Daniel L. Rubin1,2,4 & Jeanne Shen2,3,4*
Recurrence risk stratification of patients undergoing primary surgical resection for hepatocellular
carcinoma (HCC) is an area of active investigation, and several staging systems have been proposed to
optimize treatment strategies. However, as many as 70% of patients still experience tumor recurrence
at 5 years post-surgery. We developed and validated a deep learning-based system (HCC-SurvNet)
that provides risk scores for disease recurrence after primary resection, directly from hematoxylin
and eosin-stained digital whole-slide images of formalin-fixed, paraffin embedded liver resections.
Our model achieved concordance indices of 0.724 and 0.683 on the internal and external test cohorts,
respectively, exceeding the performance of the standard Tumor-Node-Metastasis classification
system. The model’s risk score stratified patients into low- and high-risk subgroups with statistically
significant differences in their survival distributions, and was an independent risk factor for post-
surgical recurrence in both test cohorts. Our results suggest that deep learning-based models can
provide recurrence risk scores which may augment current patient stratification methods and help
refine the clinical management of patients undergoing primary surgical resection for HCC.
Hepatocellular carcinoma (HCC) is the most prevalent primary liver malignancy and the fourth leading cause
of cancer-related death w orldwide1,2. Despite advances in prevention, surveillance, early detection, and treat-
ment, its incidence and cancer-specific mortality continue to rise, with the majority of patients still presenting
at advanced s tages1,2. To stratify patients according to their expected outcome in order to optimize treatment
strategies, several staging systems, such as the American Joint Committee on Cancer (AJCC)/International
Union against Cancer (UICC) Tumor-Node-Metastasis (TNM)3 and the Barcelona Clinic Liver Cancer (BCLC)
systems4, have been proposed and validated. However, as many as 70% of patients still have tumor recurrence
within 5 years post-treatment2,5–7, including both true recurrence due to intrahepatic metastasis and de novo
primary cancers arising in the background liver, as the majority of HCCs occur in patients with underlying
chronic liver disease that directly contributes to the development of HCC. Therefore, further refinement and
improvement of recurrence risk stratification is warranted.
Histopathologic assessment plays a key role in recurrence risk stratification, as it evaluates human-recog-
nizable morphologic features associated with tumor recurrence, such as histopathologic grade and vascular
invasion8–11. Prognostic nomograms for prediction of recurrence after curative liver resection for HCC have
been proposed using clinicopathologic variables12. However, histopathologic features are interpreted by patholo-
gists, which is subject to reproducibility problems (an example being inter- and intra-observer variability in the
assessment of microvascular i nvasion13). On the other hand, recent advances in computer vision, deep learning,
and other forms of machine learning have enabled the identification of histomorphologic patterns and features
informative of disease outcomes which are not readily recognizable by the human eye, and which are reproduc-
ible. Thus, there has been much interest in applying computer vision methods to histologic images for automated
outcome prediction14–21. Mobadersany et al.14 and Zhu et al.15 applied convolutional neural networks, a type of
deep learning network, to predict patient survival directly from histopathologic images of brain and lung cancers,
respectively. In these two studies, to achieve direct survival prediction from histopathologic images, the negative
1
Department of Biomedical Data Science, Stanford University School of Medicine, 1265 Welch Road, Stanford,
CA 94305, USA. 2Center for Artificial Intelligence in Medicine and Imaging, Stanford University, 1701 Page Mill
Road, Palo Alto, CA 94304, USA. 3Department of Pathology, Stanford University School of Medicine, 300 Pasteur
Drive, Stanford, CA 94305, USA. 4These authors contributed equally: Daniel L. Rubin and Jeanne Shen. *email:
jeannes@stanford.edu
Scientific Reports | (2021) 11:2047 | https://doi.org/10.1038/s41598-021-81506-y 1
Vol.:(0123456789)
www.nature.com/scientificreports/

                                            Figure 1.  Overview of HCC-SurvNet. All WSI were preprocessed by discarding non tissue-containing
                                            white background using thresholding, then partitioned into non-overlapping tiles of size 299 × 299 pixels
                                            and color normalized. A tumor tile classification model was developed using the Stanford-HCCDET dataset,
                                            which contained WSI with all tumor regions manually annotated. The tumor tile classification model was
                                            subsequently applied to each tissue-containing image tile in the TCGA-HCC (n = 360 WSI) and Stanford-HCC
                                            (n = 198 WSI) datasets for inference. The 100 tiles with the highest predicted probabilities of being tumor tiles
                                            were input into the downstream risk prediction model to yield tile-based risk scores, which were averaged to
                                            generate a WSI-level risk score for recurrence. WSI, whole-slide image.

                                            partial log-likelihood was used as the loss function, which enabled the models to output the risk values of the
                                            Cox proportional hazard model’s exponential part. Saillard et al.21 recently developed a deep learning-based
                                            model for the prediction of overall survival after surgical resection in patients with HCC, using digital whole-
                                            slide images. However, no studies to date have sought to predict post-surgical recurrence of HCC directly from
                                            histopathologic images using deep learning.
                                                In this study, we developed and independently validated a deep convolutional neural network for predicting
                                            risk scores for the recurrence-free interval (RFI) after curative-intent surgical resection for HCC, directly from
                                            digital whole-slide images (WSI) of hematoxylin and eosin (H&E)-stained, formalin-fixed, paraffin embedded
                                            (FFPE) primary liver resections. We built on and extended the aforementioned prior work by applying the nega-
                                            tive partial log-likelihood as a loss function, so that the model outputs risk scores for post-surgical recurrence.
                                            In doing so, we present a fully automated approach to HCC recurrence risk prognostication on histopathologic
                                            images, which can be adopted for use in clinical settings to refine treatment and follow-up plans.

                                            Results
                                            An overall framework for the deep learning-based system for predicting the risk score for RFI, hereafter referred
                                            to as HCC-SurvNet, is shown in Fig. 1. The system consists of two stages, i.e. tumor tile classification and risk
                                            score prediction.

                                            Tumor tile classification. To develop a deep convolutional neural network (CNN) to automatically detect
                                            tumor-containing tiles within WSI, we used the Stanford-HCCDET (n = 128,222 tiles from 36 WSI) dataset. All
                                            tumor regions in each WSI in the Stanford-HCCDET dataset were manually annotated by the reference patholo-
                                            gist (J.S.). Each WSI was preprocessed and tiled into image patches. Using these ground truth labels and image
                                            tiles, we trained and tested a CNN using 78% of WSI (100,976 tiles from 28 WSI) in the Stanford-HCCDET for
                                            training, 11% (15,834 tiles from 4 WSI) for validation, and 11% (11,412 tiles from 4 WSI) for internal testing,
                                            with no patient overlap between any of these three sets. The final optimized tumor versus non-tumor tile classi-
                                            fier was externally tested on 30 WSI (n = 82,532 tiles) randomly sampled from the TCGA-HCC dataset.
                                                Among the tiles in the internal test set, 25.7% (2932 of 11,412 tiles) were tumor positive, whereas 48.8%
                                            (40,288 out of 82,532 tiles) were tumor positive in the external test set. The accuracies of tumor tile classification
                                            were 92.3% and 90.8% on the internal and external test sets, respectively. The areas under the receiver-operating-
                                            characteristic-curve (AUROCs) were 0.952 (95% CI 0.948, 0.957) and 0.956 (95% CI 0.955, 0.958) for the internal
                                            and external test sets, respectively. Model outputs showed a statistically significant difference between tiles with
                                            a ground truth of tumor versus non-tumor, on both the internal and external test sets (p < 0.0001 and p < 0.0001,
                                            respectively) (Figs. 2, 3).

                                            Risk score prediction. Datasets. To develop a risk score prediction model, we used two datasets: the
                                            TCGA-HCC and Stanford-HCC datasets, originating from two independent data sources, the Cancer Genome
                                            Atlas (TCGA)-LIHC diagnostic slide collection and the Stanford Department of Pathology slide archive, respec-
                                            tively. The TCGA-HCC was further split into TCGA-HCC development and test datasets.
                                                The TCGA-HCC development dataset (containing the training and validation sets) consisted of 299 patients
                                            (median age of 60 years, with an interquartile range (IQR) of 51–68 years, 69% male and 31% female). The fre-
                                            quencies of risk factors for HCC were: 32% for hepatitis B virus infection, 15% for hepatitis C virus infection,
                                            34% for alcohol intake, and 4.9% for NAFLD. The AJCC (8th edition) stage grouping was IA in 2.7%, IB in 41%,
                                            II in 29%, IIIA in 20%, IIIB in 5.4%, IVA in 1.0%, and IVB in 0.3% of the patients, respectively. One hundred

          Scientific Reports |   (2021) 11:2047 |                https://doi.org/10.1038/s41598-021-81506-y                                                     2

Vol:.(1234567890)
www.nature.com/scientificreports/
Figure 2. Performance of the tumor tile classification model on the internal test set. The AUROC for tumor tile
classification was 0.952 (95% CI 0.948, 0.957) on the internal test set (a). Model outputs differed significantly
between tiles with a ground truth of tumor versus non-tumor (p value < 0.0001) (b). *The 95% CI for AUC
is shown in parentheses in the ROC plot. **Error bars represent 95% CI in the bar chart. The p value was
computed using the Wilcoxon rank sum test. AUC, area under the ROC curve; CI, confidence interval; ROC,
receiver operating characteristic.
Figure 3. Performance of the tumor tile classification model on the external test set. The AUROC for tumor tile
classification was 0.956 (95% CI 0.955, 0.958) on the external test set (a). Model outputs differed significantly
between tiles with a ground truth of tumor versus non-tumor (p value < 0.0001) (b). *95% CI for AUC is shown
in parentheses in the ROC plot. **Error bars represent 95% CI in the bar chart. The p value was computed using
the Wilcoxon rank sum test. AUC, area under the ROC curve; CI, confidence interval; ROC, receiver operating
characteristic.
Scientific Reports | (2021) 11:2047 | https://doi.org/10.1038/s41598-021-81506-y 3
Vol.:(0123456789)www.nature.com/scientificreports/
and fifty-one patients experienced disease recurrence during follow-up (median follow-up time of 12.2 months)
(Table 1).
The TCGA-HCC test dataset consisted of 53 patients (median age of 61 years, with an IQR of 51–68 years,
62% male and 38% female). The frequencies of risk factors for HCC were: 33% for hepatitis B virus infection,
16% for hepatitis C virus infection, 39% for alcohol intake, and 10% for NAFLD. The AJCC stage grouping was
IA in 1.9%, IB in 46%, II in 31%, IIIA in 17%, IIIB in 1.9%, and IVB in 1.9% of the patients. Twenty-five patients
experienced recurrence during follow-up (median follow-up time of 12.7 months) (Table 1). None of the clin-
icopathologic features were significantly associated with shorter RFI upon univariable Cox regression analysis,
while a Batts–Ludwig22 fibrosis stage > 2 showed borderline significance (hazard ratio (HR) = 2.7 (95% confidence
interval (CI) 0.98, 7.7), p = 0.0543) (Table 2).
The Stanford-HCC dataset consisted of 198 patients (median age of 64 years, with an IQR of 57–69 years, 79%
male and 21% female). The frequencies of risk factors for HCC were: 26% for hepatitis B virus infection, 52% for
hepatitis C virus infection, 8.6% for alcohol intake, and 7.1% for NAFLD. The overall AJCC stage grouping was IA
in 22%, IB in 21%, II in 34%, IIIA in 5.6%, IIIB in 3.5%, and IVA in 1.0% of the patients, respectively. Sixty-two
patients experienced disease recurrence during follow-up (median follow-up time of 24.9 months) (Table 1). The
clinical and pathologic features associated with shorter RFI were AJCC stage grouping > II [HR = 4.4 (95% CI 2.3,
8.3), p < 0.0001], greatest tumor diameter > 5 cm [HR = 3.5 (95% CI 2.1, 5.8), p < 0.0001], histologic grade > moder-
ately differentiated [HR = 2.1 (95% CI 1.2, 3.9), p = 0.0128], presence of microvascular invasion [HR = 3.9 (95% CI
2.4, 6.5), p < 0.0001], presence of macrovascular invasion [HR = 5.3 (95% CI 2.1, 13), p < 0.0001], positive surgical
margin [HR = 6.8 (95% CI 1.6, 28), p = 0.009], and fibrosis stage > 2 [HR = 0.33 (95% CI 0.2, 0.55), p < 0.0001]
using univariable Cox regression analysis (Table 2).
HCC‑SurvNet performance for RFI prediction. The tumor tile classification model was applied to each tissue-
containing image tile in the TCGA-HCC development (n = 299 WSI) and test (n = 53 WSI) datasets and the Stan-
ford-HCC dataset (n = 198 WSI). From each WSI, the 100 tiles with the highest probabilities for the tumor class
were selected for input into the subsequent risk score model. Figure 4 shows examples of tiles with probabilities
in the top 100 for containing tumor, overlaid onto the original WSI. A MobileNetV223 pre-trained on ImageNet24
was modified by replacing the fully-connected layers, and fine-tuned by transfer learning with on-the-fly data
augmentation on the tiles from the TCGA-HCC development dataset (n = 307 WSI from 299 patients), where
the model input was a 299 × 299 pixel image tile, and the output was a continuous tile-level risk score from the
hazard function for RFI. The negative partial log-likelihood of the Cox proportional hazards model was used as a
loss function14,15. The model’s performance was evaluated internally on the TCGA-HCC test dataset (n = 53 WSI
from 53 patients), and externally on the Stanford-HCC dataset (n = 198 WSI from 198 patients). All tile-level risk
scores from a patient were averaged to yield a patient-level risk score.
We assessed HCC-SurvNet’s performance using Harrell’s25 and Uno’s26 concordance indices (c-indices). On
the internal test set (TCGA-HCC test dataset, n = 53 patients), Harrell’s and Uno’s c-indices were 0.724 and
0.724, respectively. On the external test set (Stanford-HCC, n = 198 patients), the indices were 0.683 and 0.670,
respectively. We observed statistically significant differences in the survival distributions between the low- and
high-risk subgroups, as stratified by the risk scores predicted by HCC-SurvNet, on both the internal and external
test sets (log-rank p value: 0.0013 and < 0.0001, respectively) (Figs. 5, 6).
Histograms of HCC-SurvNet’s risk scores, along with the threshold used for risk group stratification, are
shown in Supplementary Fig. 1. On univariable Cox proportional hazards analysis, the HCC-SurvNet risk
score was a predictor of the RFI, for both the internal [HR = 6.52 (95% CI 1.83, 23.2), p = 0.0038] and external
[HR = 3.72 (95% CI 2.17, 6.37), p < 0.0001] test sets (Table 2). A continuous linear association between HCC-
SurvNet’s risk score and the log relative hazard for RFI was observed by analysis of the internal and external test
cohorts by univariable Cox proportional hazards regression with restricted cubic splines (Supplementary Fig. 2),
validating the use of HCC-SurvNet’s risk score as a linear factor in the Cox analyses.
On multivariable Cox proportional hazards analysis, HCC-SurvNet’s risk score was an independent predic-
tor of the RFI, for both the internal [HR = 7.44 (95% CI 1.60, 34.6), p = 0.0105] and external [HR = 2.37 (95% CI
1.27, 4.43), p = 0.00685] test sets (Table 3).
No other clinicopathologic variable was statistically significant on the internal test set. Microvascular invasion
[HR = 2.84 (95% CI 1.61, 5.00), p = 0.000294] and fibrosis stage [HR = 0.501 (95% CI: 0.278, 0.904), p = 0.0217]
showed statistical significance on the external test set, along with HCC-SurvNet’s risk score. Schoenfeld’s global
test showed p values greater than 0.05 on both the internal (p = 0.083) and external (p = 0.0702) test sets. On
mixed-effect Cox regression analysis with the TCGA institution as a random effect, HCC-SurvNet’s risk score
was an independent predictor (p = 0.014), along with the histologic grade (p = 0.014) and macrovascular inva-
sion (p = 0.013). In the external test (Stanford-HCC) cohort, HCC-SurvNet’s risk score was positively associated
with the AJCC stage grouping, greatest tumor diameter, and microvascular invasion, and negatively associated
with fibrosis stage (Table 4). HCC-SurvNet’s risk score yielded a significantly higher Harrell’s c-index (0.72 for
the internal and 0.68 for the external test cohort) than that obtained using the AJCC Stage grouping (0.56 for
the internal and 0.60 for the external test cohort), on both the internal and external test cohorts (p = 0.018 and
0.025, respectively).
Discussion
Building upon recent advances in deep learning, we have developed a system for predicting RFI after curative-
intent surgical resection in patients with HCC, directly from H&E-stained FFPE WSI. The system outputs an
RFI risk score by first applying a deep CNN to automatically detect tumor-containing tiles. Then, a second model
outputs a continuous risk score based on analysis of the top 100 tumor-containing tiles from each WSI. In the
Scientific Reports | (2021) 11:2047 | https://doi.org/10.1038/s41598-021-81506-y 4
Vol:.(1234567890)www.nature.com/scientificreports/
TCGA-HCC development cohort
(n = 299) TCGA-HCC test cohort (n = 53) Stanford-HCC (n = 198)
Patient characteristic Training and validation set Internal test set External test set
Age (at surgery) (years) 60 (51, 68) 61 (51, 68) 64 (57, 69)
Gender
Male 206 (69%) 33 (62%) 157 (79%)
Female 93 (31%) 20 (38%) 41 (21%)
Hepatitis B virus infection
Negative 195 (68%) 33 (67%) 147 (74%)
Positive 90 (32%) 16 (33%) 51 (26%)
Unknown 14 4 0
Hepatitis C virus infection
Negative 243 (85%) 41 (84%) 96 (48%)
Positive 42 (15%) 8 (16%) 102 (52%)
Unknown 14 4 0
Alcohol intake
Negative 188 (66%) 30 (61%) 181 (91%)
Positive 97 (34%) 19 (39%) 17 (8.6%)
Unknown 14 4 0
Non-alcoholic fatty liver disease
Negative 271 (95.1%) 44 (90%) 184 (93%)
Positive 14 (4.9%) 5 (10%) 14 (7.1%)
Unknown 14 4 0
AJCC stage grouping
IA 8 (2.7%) 1 (1.9%) 44 (22%)
IB 121 (41%) 24 (46%) 66 (33%)
II 85 (29%) 16 (31%) 68 (34%)
IIIA 60 (20%) 9 (17%) 11 (5.6%)
IIIB 16 (5.4%) 1 (1.9%) 7 (3.5%)
IVA 3 (1.0%) 0 (0%) 2 (1%)
IVB 1 (0.3%) 1 (1.9%) 0 (0%)
Unknown 5 1 0
Largest tumor diameter (mm) 65 (35, 100) 55 (34, 100) 30 (18, 50)
Unknown 5 0 0
Tumor multifocality
Negative 207 (69%) 38 (73%) 142 (72%)
Positive 91 (31%) 14 (27%) 56 (28%)
Unknown 1 1 0
Histologic grade
Well-differentiated 46 (15%) 5 (9.4%) 63 (32%)
Moderately-differentiated 162 (54%) 32 (60%) 108 (55%)
Poorly-differentiated 89 (30%) 16 (30%) 26 (13%)
Undifferentiated 2 (0.7%) 0 (0%) 1 (0.5%)
Microvascular invasion
Negative 196 (67%) 36 (68%) 147 (74%)
Positive 95 (33%) 17 (32%) 51 (26%)
Unknown 8 0 0
Macrovascular invasion
Negative 271 (93%) 49 (92%) 188 (96%)
Positive 21 (7.2%) 4 (7.5%) 8 (4.1%)
Unknown 7 0 0
Surgical margin status
Negative 249 (94%) 45 (88%) 192 (97%)
Positive 17 (6.4%) 6 (12%) 5 (2.5%)
Unknown 33 2 0
Fibrosis stage
0 77 (33%) 13 (30%) 38 (19%)
1 11 (4.8%) 2 (4.5%) 13 (6.6%)
Continued
Scientific Reports | (2021) 11:2047 | https://doi.org/10.1038/s41598-021-81506-y 5
Vol.:(0123456789)www.nature.com/scientificreports/
TCGA-HCC development cohort
(n = 299) TCGA-HCC test cohort (n = 53) Stanford-HCC (n = 198)
Patient characteristic Training and validation set Internal test set External test set
2 25 (11%) 4 (9.1%) 15 (7.6%)
3 26 (11%) 6 (14%) 13 (6.6%)
4 91 (40%) 19 (43%) 119 (60%)
Unknown 69 9 0
Recurrence
No 148 (49%) 28 (53%) 136 (69%)
Yes 151 (51%) 25 (47%) 62 (31%)
Length of follow-up (months) 12 (4, 24) 13 (6, 20) 25 (9, 48)
Risk score 0.07 (− 0.26, 0.30) − 0.31 (− 0.46, − 0.15)
Table 1. Patient characteristics for the Stanford-HCC and TCGA-HCC datasets. Values presented: median
(IQR); n (%).
TCGA-HCC test cohort (n = 53) Stanford-HCC (n = 198)
Internal test set External test set
Patient characteristics Hazard ratio (95% CI) p value Hazard ratio (95% CI) p value
Risk score (binarized) 6.52 (1.83, 23.2) 0.0038 3.72 (2.17, 6.37) < 0.0001
Age (at surgery)
> 60 years 0.83 (0.38, 1.8) 0.65 1.1 (0.64, 1.8) 0.77
Gender
Female 0.99 (0.44, 2.2) 0.98 0.99 (0.53, 1.9) 0.98
Hepatitis B virus infection
Positive 0.57 (0.22, 1.5) 0.25 1.1 (0.62, 1.9) 0.78
Hepatitis C virus infection
Positive 1.2 (0.4, 3.6) 0.74 0.66 (0.4, 1.1) 0.11
Alcohol intake
Positive 0.89 (0.37, 2.2) 0.80 0.19 (0.027, 1.4) 0.10
Non-alcoholic fatty liver disease
Positive 1.6 (0.46, 5.4) 0.48 1.8 (0.81, 3.9) 0.15
AJCC stage grouping
> II 1.3 (0.49, 3.6) 0.58 4.4 (2.3, 8.3) < 0.0001
Largest tumor diameter (mm)
> 50 1.1 (0.52, 2.5) 0.74 3.5 (2.1, 5.8) < 0.0001
Tumor multifocality
Positive 1.3 (0.53, 3.4) 0.53 1.1 (0.64, 1.9) 0.71
Histologic grade
> Moderately-differentiated 1.1 (0.44, 2.6) 0.90 2.1 (1.2, 3.9) 0.013
Microvascular invasion
Positive 1.4 (0.6, 3.1) 0.46 3.9 (2.4, 6.5) < 0.0001
Macrovascular invasion
Positive 1.6 (0.46, 5.4) 0.48 5.3 (2.1, 1.3) 0.00043
Surgical margin
Positive 0.74 (0.22, 2.5) 0.63 6.8 (1.6, 28) 0.0090
Fibrosis stage
>2 2.7 (0.98, 7.7) 0.054 0.33 (0.2, 0.55) < 0.0001
Table 2. Univariable Cox proportional hazards analysis of the risk of recurrence. CI, confidence interval.
internal and external test cohorts, we observed statistically significant differences in the survival distributions
between the low- and high-risk subgroups, as stratified by the risk score predicted by the system. The results
of multivariable analyses indicate that the HCC-SurvNet risk score could help supplement established clinico-
pathologic predictors of RFI, thereby improving recurrence risk stratification.
In the present study, HCC-SurvNet significantly outperformed the standard AJCC/UICC staging system
in predicting the post-surgical HCC recurrence risk. Shim et al.12 reported the performance of a prognostic
Scientific Reports | (2021) 11:2047 | https://doi.org/10.1038/s41598-021-81506-y 6
Vol:.(1234567890)www.nature.com/scientificreports/
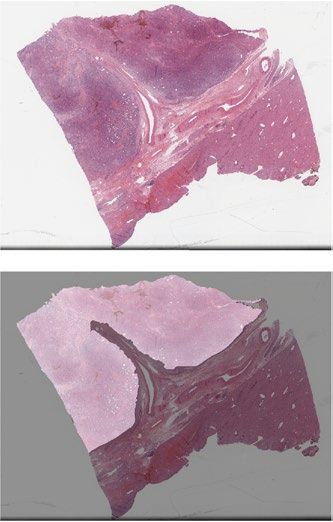
Figure 4. Top 100 tiles selected by the tumor tile classification model. Spatial distribution of the top 100 tiles
classified as being tumor tiles by the tumor tile classification model. The top row represents examples from the
TCGA-HCC test dataset, and the bottom row represents examples from the Stanford-HCC dataset. The top 100
tiles were subsequently used for development of the survival prediction model. WSI, whole-slide image.
Risk score + Low + High
1.00 +++++
+++ +
+ + ++
0.75 +
+
Survival probability
+ +
+
++
0.50 +
+ + +
Log rank
0.25 +
p = 0.0013 +
0.00
0 12 24 36 48 60 72 84
Time in months
Number at risk
Risk score
19 11 9 6 5 4 2 0
34 16 3 0 0 0 0 0
0 12 24 36 48 60 72 84
Time in months
Figure 5. Kaplan–Meier plots for the high- and low-risk subgroups in the internal (TCGA-HCC) test set. The
Kaplan–Meier plot shows the difference in the survival distributions for the low- and high-risk subgroups,
stratified based on the risk scores predicted by HCC-SurvNet on the internal test set (log-rank p value = 0.0013).
Scientific Reports | (2021) 11:2047 | https://doi.org/10.1038/s41598-021-81506-y 7
Vol.:(0123456789)www.nature.com/scientificreports/
Risk score + Low + High
1.00 +
++
++++++
+ +++++
+++
+++++++
+ ++
++++++++++
++++ + +
++++++
0.75 +
+++++
+
++++++++
+++++
++++ + +
++
Survival probability
++ + + ++
+
+ + ++ + ++ + + + + +
0.50
+ ++ ++
+
Log rank
0.25
+
p < 0.0001
+
0.00
0 12 24 36 48 60 72 84 96 108 120
Time in months
Number at risk
166 121 88 69 46 25 19 14 7 2 1
Risk score
32 16 13 9 3 2 1 1 0 0 0
0 12 24 36 48 60 72 84 96 108 120
Time in months
Figure 6. Kaplan–Meier plots for the high- and low-risk subgroups in the external (Stanford-HCC) test set.
The Kaplan–Meier plot shows the difference in the survival distributions for the low- and high-risk subgroups,
stratified based on the risk scores predicted by HCC-SurvNet on the external test set (log-rank p value < 0.0001).
TCGA-HCC test cohort (n = 53) Stanford-HCC (n = 198)
Internal test set External test set
Patient characteristics Hazard ratio (95% CI) p value Hazard ratio (95% CI) p value
Risk score (binarized) 7.44 (1.60, 34.6) 0.011 2.37 (1.27, 4.43) 0.00685
AJCC stage grouping
> II 0.30 (0.043, 2.11) 0.23 1.57 (0.63, 3.91) 0.331
Largest tumor diameter (mm)
> 50 1.09 (0.33, 3.60) 0.89 1.32 (0.67, 2.60) 0.425
Histologic grade
> Moderately-differentiated 2.82 (0.98, 8.1) 0.054 1.36 (0.69, 2.69) 0.377
Microvascular invasion
Positive 1.98 (0.59, 6.64) 0.27 2.84 (1.61, 5.00) 0.000294
Macrovascular invasion
Positive 3.76 (0.77, 18.4) 0.10 1.42 (0.42, 4.86) 0.575
Surgical margin
Positive 0.51 (0.079, 3.3) 0.47 4.45 (0.84, 23.7) 0.0797
Fibrosis stage
>2 0.80 (0.20, 3.1) 0.74 0.50 (0.28, 0.90) 0.0217
Table 3. Multivariable Cox proportional hazards analysis of the risk of recurrence. CI, confidence interval.
nomogram for recurrence prediction after curative liver resection in HCC patients, which yielded a c-index of
0.66 for 2-year recurrence on an independent validation cohort. Although a direct comparison with the perfor-
mance of their nomogram is not possible, as their patient cohort was different from ours, our risk score appears
to have a performance that is on par with, or slightly better than, the prognostic nomogram.
Advances in deep learning, and other forms of machine learning, have led to the identification of histomor-
phologic features informative of disease outcomes, and prior works have applied these methods to automated
outcome prediction14–21. The automatic extraction of such features directly from WSI has the potential to add
value to current treatment planning paradigms by increasing both the accuracy of prognostic risk stratification
and the objectivity and reproducibility of biomarker assessment. Mobadersany et al.14 and Zhu et al.15 previously
Scientific Reports | (2021) 11:2047 | https://doi.org/10.1038/s41598-021-81506-y 8
Vol:.(1234567890)www.nature.com/scientificreports/
Stanford-HCC (n = 198) Spearman’s correlation
Patient characteristics Low-risk group (N = 166) High-risk group (N = 32) ρ (95% CI) p value
Age (at surgery) 64 (57, 69) 64 (57, 69) − 0.017 (− 0.15, 0.12) 0.82
Gender 0.036 (− 0.11, 0.18) 0.62
Male 133 (80%) 24 (75%)
Female 33 (20%) 8 (25%)
Hepatitis B virus infection − 0.033 (− 0.17, 0.10) 0.64
Negative 121 (73%) 26 (81%)
Positive 45 (27%) 6 (19%)
Hepatitis C virus infection − 0.082 (− 0.22, 0.063) 0.25
Negative 80 (48%) 16 (50%)
Positive 86 (52%) 16 (50%)
Alcohol intake − 0.024 (− 0.18, 0.13) 0.74
Negative 152 (92%) 29 (91%)
Positive 14 (8.4%) 3 (9.4%)
Non-alcoholic fatty liver disease − 0.0014 (− 0.10, 0.092) 0.99
Negative 152 (92%) 32 (100%)
Positive 14 (8.4%) 0 (0%)
AJCC stage grouping 0.24 (0.086, 0.37) 0.00079
IA 43 (26%) 1 (3.1%)
IB 53 (32%) 13 (41%)
II 57 (34%) 11 (34%)
IIIA 7 (4.2%) 4 (12%)
IIIB 5 (3.0%) 2 (6.2%)
IVA 1 (0.6%) 1 (3.1%)
IVB 0 (0%) 0 (0%)
Largest tumor diameter (mm) 26 (15, 45) 55 (36, 80) 0.41 (0.27, 0.53) < 0.0001
Tumor multifocality − 0.10 (− 0.24, 0.032) 0.15
Negative 188 (71%) 24 (75%)
Positive 48 (29%) 8 (25%)
Histologic grade 0.14 (− 0.0046, 0.27) 0.058
Well-differentiated 57 (34%) 6 (19%)
Moderately-differentiated 89 (54%) 19 (59%)
Poorly-differentiated 19 (11%) 7 (22%)
Undifferentiated 1 (0.6%) 0 (0%)
Microvascular invasion 0.22 (0.082, 0.35) 0.0015
Negative 128 (77%) 19 (59%)
Positive 38 (23%) 13 (41%)
Macrovascular invasion 0.056 (− 0.13, 0.23) 0.44
Negative 159 (97%) 29 (91%)
Positive 5 (3.0%) 3 (9.4%)
Surgical margin status 0.060 (− 0.079, 0.18) 0.40
Negative 159 (97%) 29 (91%)
Positive 5 (3.0%) 3 (9.4%)
Unknown 2 0
Fibrosis stage − 0.36 (− 0.48, − 0.22) < 0.0001
0 29 (17%) 9 (28%)
1 8 (4.8%) 5 (16%)
2 12 (7.2%) 3 (9.4%)
3 9 (5.4%) 4 (12%)
4 108 (65%) 11 (34%)
Table 4. Association between the HCC-SurvNet risk score and various patient characteristics in the external
test (Stanford-HCC) cohort. Values presented: median (IQR); n (%).
Scientific Reports | (2021) 11:2047 | https://doi.org/10.1038/s41598-021-81506-y 9
Vol.:(0123456789)www.nature.com/scientificreports/
applied convolutional neural networks to survival prediction directly from histopathologic images, by integrat-
ing the negative partial log-likelihood into the model as a loss function, which enables the model to output a
value that can be regarded as a prognostic risk score. However, in these prior studies, representative tiles were
manually identified for input into the deep learning models. This requirement for manual tile selection, even
during inference, makes such models less practical for widespread clinical deployment. In this work, we present
a system which automatically selects representative image tiles, which should increase the ease of deployment
in clinical settings.
Saillard et al.21 were the first to apply deep learning to digital H&E WSI to predict overall survival after
resection in HCC patients. On their external test set (342 WSI from the TCGA), their models yielded c-indices
of 0.68 and 0.70 for overall survival prediction. Although a formal comparison between our model and theirs
is impractical, as the outcomes and datasets used were different, our c-index on the external test set of 0.68 is
comparable to that reported for their model. In their study, they applied a CNN pre-trained on ImageNet as a
fixed feature extractor. The features extracted were optimized for natural images, rather than histopathologic
images, suggesting that there might be further potential for improving prediction performance by optimizing
feature extraction for histopathologic i mages27. To leverage the full capacity of our HCC-SurvNet deep learning
system, we fine-tuned all of the models’ parameters, including those for feature extraction (i.e. the convolutional
blocks), with histopathologic images. Whereas Saillard et al.’s model focused on predicting overall survival, ours
focused on recurrence-free interval, as our intent was to aid refinement of treatment strategies by providing a risk
score that was specific for HCC recurrence and/or HCC-related mortality after curative-intent surgical resection.
A specific strength of our study was the review and confirmation of all clinicopathologic variables in the
TCGA-HCC cohort and re-coding of older edition AJCC classifications to the latest 8th edition classification
by a reference pathologist experienced in hepatobiliary pathology. Previous other studies19 have also developed
models for the prediction of overall survival in post-surgical HCC patients, also by using clinicopathologic data
from the TCGA. However, use of TCGA clinicopathologic data presents some significant limitations which are
often overlooked. These include the fact that the AJCC TNM classifications used across cases in the TCGA-LIHC
dataset range from the 4th through the 7th editions, resulting in inconsistency in the meaning of the pathologic
T, N, and M categories across different patients resected during different time periods. In addition, the pathol-
ogy reports in TCGA-LIHC came from different institutions with wide variation in the reporting of pathologic
features. Therefore, prior to use of TCGA data, standardization, in particular, of all pathologic variables, as per-
formed in this study, is necessary. As the TCGA data were collected from 35 different institutions, each with dif-
ferent H&E staining and digitization protocols, we constructed a mixed-effect Cox model to account for potential
intraclass correlations present between WSI originating from the same institution. After taking the originating
institution into account as a random effect, we found that HCC-SurvNet’s risk score remained an independent
predictor of recurrence-free interval, along with the histologic grade and the presence of macrovascular invasion.
A limitation of our study was that the dataset used to externally evaluate HCC-SurvNet’s performance was
restricted to cases from a single institution. Due to limitations in the datasets that were available to us, we chose
to reserve the more heterogeneous, multi-institutional TCGA-HCC dataset for HCC-SurvNet model develop-
ment, with the intention of capturing histomorphologic features informative of HCC recurrence which were
robust to inter-institutional variations in H&E staining and scanning protocols. With further development and
validation on larger, more diverse datasets, we hope that risk scores produced by HCC-SurvNet, as well as other
similar deep learning-based models, might one day offer clinical value as a supplement to currently-established
clinicopathologic predictors of recurrence and survival.
Another limitation was the black-box nature of deep learning systems. To gain insights into model interpret-
ability, we assessed the associations between HCC-SurvNet’s risk score and different patient characteristics in
the external test (Stanford-HCC) cohort. The HCC-SurvNet risk score was significantly associated with several
well-recognized prognostic factors, including the AJCC stage grouping, largest tumor diameter, microvascular
invasion, and Batts-Ludwig fibrosis stage. In addition, the independent contribution of the HCC-SurvNet risk
score to recurrence-free interval prediction, when analyzed together with other known clinicopathologic vari-
ables in the multivariable Cox regression, suggests that HCC-SurvNet was able to extract some as-yet unrec-
ognized histomorphologic features informative of recurrence, which might have biological significance and
correlate with other important outcomes, such as response to adjuvant treatment. It remains for future studies
to explore the additional potential of deep learning for prognostication and treatment response prediction in
HCC, and other malignancies.
In conclusion, we have shown that a deep learning-based cancer recurrence risk score extracted from routine
H&E WSI of primary surgical resections for HCC independently predicts the RFI, and significantly outperforms
the most commonly-used standard AJCC/UICC stage grouping. With further validation on larger, more diverse
datasets, such a risk score could augment current methods for predicting the risk of HCC recurrence after pri-
mary surgical resection, thereby assisting clinicians in tailoring post-surgical management.
Methods
This study was approved by the Stanford University Institutional Review Board, with all methods carried out in
accordance with relevant institutional guidelines and regulations regarding human-subjects research, including
compliance with the United States Health Insurance Portability and Accountability Act (HIPAA).
Patient population. A total of 250 primary hepatic resection specimens (n = 250 patients) from surgeries
performed at our institution between January 1, 2009 and December 31, 2017, with glass slides available for
retrieval from the departmental slide archive, were included in the dataset. Prior to digitization, the time to
recurrence after surgical resection, as well as patient demographic information (age at surgical resection, gender,
Scientific Reports | (2021) 11:2047 | https://doi.org/10.1038/s41598-021-81506-y 10
Vol:.(1234567890)www.nature.com/scientificreports/
and alcohol intake), and clinicopathologic variables [history of hepatitis B and C viral infection, non-alcoholic
fatty liver disease (NAFLD), HCC multi-nodularity, macro- and micro- vascular invasion, largest tumor diam-
eter, histologic World Health Organization g rade28, Batts–Ludwig22 fibrosis stage, surgical margin status, and
AJCC (8th edition) stage3] were collected for each case by review of the electronic health records by trained phy-
sicians at Stanford University Medical Center (J.S. and A. S.). Forty-seven patients were excluded because their
resections were performed for recurrent HCC, two were excluded because of lack of follow-up data after surgi-
cal resection, and three were excluded due to the presence of comorbidities known to have contributed to the
patients’ deaths. This process narrowed the final number of study patients down to 198. From each of these 198
patients, a representative tumor H&E slide (the one containing the highest grade of tumor in the specimen) was
digitized at high resolution (40 × objective magnification, 0.25 µm per pixel) on an Aperio AT2 scanner (Leica
Biosystems, Nussloch, Germany), to generate a WSI in the SVS file format. This dataset (n = 198 WSI, from 198
unique patients), referred to as the Stanford-HCC dataset, was used for external evaluation of the risk score
prediction model. From the excluded patient pool (not included in Stanford-HCC), 36 patients were randomly
selected and a representative tumor H&E slide from each patient was digitized using the exact same method as
described above, yielding a dataset with 36 WSI from 36 patients, referred to as the Stanford-HCCDET dataset.
This dataset was used to develop a model for automatically detecting tumor-containing tiles in a WSI (“DET”
stands for “detection”). Use of all patient material and data was approved by the Stanford University Institutional
Review Board, with waived informed consent.
In addition to the Stanford-HCC and Stanford-HCCDET datasets, a publicly-available dataset of 379 FFPE
diagnostic WSI from 365 unique patients in the TCGA-LIHC diagnostic slide collection were downloaded via
the GDC Data Portal29 and used to develop the risk score prediction model for this study. The same patient
demographics, clinicopathologic variables, and RFI as collected for Stanford-HCC were obtained through
review of the accompanying metadata and pathology reports downloaded from the GDC Data Portal and the
previously-published Integrated TCGA Pan-Cancer Clinical Data Resource by Liu et al.30 RFI was defined as
the period from the date of surgery until the date of the first occurrence of a new tumor event, which included
progression of HCC, locoregional recurrence, distant metastasis, new primary tumor, or death with t umor30.
Patients who were alive without these events, or who died without tumor, were c ensored31. The event time was
the shortest period from the date of surgery to the date of an event. The censored time was the period from the
date of surgery to the date of last contact with the patient or the date of death without HCC. Given multiple
changes to the AJCC classification over the time period during which these specimens were collected (resulting
in differences in the pathologic staging criteria across different editions of the AJCC), a reference pathologist
trained in the interpretation of hepatobiliary pathology (J.S.) reviewed the WSI and the downloaded pathology
reports, in order to re-stage all of the patients based on the most current AJCC (8th edition) classification3. WSI
scanned at 20 × base magnification were excluded (n = 10 WSI, from 4 patients). One patient (n = 1 WSI) with
missing RFI was excluded. Seven patients (n = 7 WSI) with mixed HCC–cholangiocarcinomas and one patient
(n = 1 WSI) with an angiomyolipoma were excluded from the dataset. The final dataset (n = 360 WSI, from 352
patients), referred to as the TCGA-HCC dataset, contained patients from 35 institutions, each with potentially
different staining and scanning protocols. The TCGA-HCC dataset was randomly split into the development
cohort (n = 299 patients: n = 247 patients for training and n = 52 patients for validation) and internal test cohort
(n = 53 patients), with no patient overlap between the splits.
WSI image preprocessing. First, tissue segmentation (i.e. tissue separation from white background) of
the WSI was performed by applying a combination of filters. Second, the WSI were tiled into image patches with
a size of 1024 × 1024 pixels, at a resolution of 40 × (0.25 μm/pixel). Only the tiles containing an overall tissue
percentage of > 80% of the total surface area within each tile were saved in PNG format. Lastly, the Vahadane
method32 was used for stain normalization, to convert all image tiles to a reference color space. All tiles were
subsequently resized to 299 × 299 pixels and used for the downstream analyses.
Tumor tile classification. All tumor regions in each WSI in the Stanford-HCCDET dataset were manually
annotated by the reference pathologist (J.S.) at 10 × magnification, using Aperio ImageScope (Leica Biosystems,
Nussloch, Germany). Tiles containing both tumor and normal tissue were excluded from model development
and evaluation. Using these ground-truth annotated WSI, we developed a CNN for automatically classifying an
image tile into either the tumor or non-tumor class, where the model input was a 299 × 299 pixel image tile in
PNG format, and the output was a probability for each class. The particular CNN architecture, PathCNN, which
was originally proposed by Bilaloglu et al.33 was trained and tested using the Stanford-HCCDET (n = 128,222
tiles from 36 WSI) dataset, with 78% of WSI (100,976 tiles from 28 WSI) used for training, 11% (15,834 tiles
from 4 WSI) used for validation, and 11% (11,412 tiles from 4 WSI) used as an internal test set, with no patient
overlap between any of these three sets). We used leaky ReLU34 with negative slope 0.01 as the non-linearity. The
dropout probability was set at 0.1. The trainable parameters were initialized using a Xavier weight initialization
scheme35, and updated using an Adam optimization method36 with an initial learning rate of 0.001. We applied
stepwise learning rate decay with a step size of 7 and gamma of 0.1. The number of epochs was set at 25, with
a mini-batch size of 32. A loss function of binary cross entropy was applied. Input images were normalized by
[(image − 0.5)/0.5] before passing them to the model. We augmented the training data by randomly introducing
positional transforms: a horizontal flip and a rotation of 0°, 90°, 180° or 270°. Additionally, we randomly adjusted
the hue, brightness, contrast, and saturation of the image. We used validation accuracy to select the final model.
The final optimized tumor versus non-tumor tile classifier was externally tested on 30 WSI (n = 82,532 tiles)
randomly sampled from the TCGA-HCC dataset. Of note, there was no patient overlap between the Stanford-
HCCDET and Stanford-HCC datasets, where the latter was used in the downstream development of the risk
Scientific Reports | (2021) 11:2047 | https://doi.org/10.1038/s41598-021-81506-y 11
Vol.:(0123456789)www.nature.com/scientificreports/
score prediction model. The tumor tile classification model was subsequently applied to each tissue-containing
image tile in the Stanford-HCC (n = 198 WSI) and TCGA-HCC (n = 360 WSI) datasets. From each WSI, the
100 tiles with the highest probabilities for the tumor class were selected for input into the subsequent survival
analysis. The value of 100 was chosen arbitrarily in order to incorporate enough representative tiles, taking into
account morphologic tumor heterogeneity in the WSI (Fig. 4).
HCC‑SurvNet development. The top 100 tiles selected by the tumor detector were used for the develop-
ment of the risk score model for RFI, which consisted of a M obileNetV223 pre-trained on I mageNet24, modified
by replacing the fully-connected layers, and fine-tuned by transfer learning with on-the-fly data augmentation
on the tiles from the TCGA-HCC development dataset (n = 307 WSI, n = 299 patients), where the model input
was a 299 × 299 pixel image tile in PNG format, and the output was a continuous tile-level risk score from the
hazard function for RFI. The dropout probability in the replaced fully-connected classification layers was set at
0.7. The trainable parameters were fine-tuned using an AdamW optimization m ethod37 with an initial learning
rate of 0.001. The number of epochs was set at 30, with a mini-batch size of 80. The negative partial log-likeli-
hood of the Cox proportional hazards model was used as a loss function14,15. Input images were normalized by
[(image − mean)/standard deviation], where the mean and standard statistics were calculated for the ImageNet
dataset before passing them to the model. We augmented the training data by randomly introducing positional
transforms: a horizontal flip and a rotation of 0°, 90°, 180° or 270°. Additionally, we randomly adjusted the hue,
brightness, contrast, and saturation of the image. We used validation loss to select the final model. The model’s
performance was evaluated internally on the TCGA-HCC test dataset, and externally on the Stanford-HCC
dataset. All tile-level risk scores from a patient were averaged to yield a patient-level risk score. An overall frame-
work for the system, referred to as HCC-SurvNet, is shown in Fig. 1.
Hardware and software. The PyTorch Python package (version 1.1.0)38 was used for model development.
OpenSlide (version 3.4.1)39 was used to read WSI in the SVS format. Image preprocessing was performed on a
High-Performance Computing (HPC) cluster operated by the Stanford Research Computing Center (Sherlock
cluster: https://www.sherlock.stanford.edu/). Model development and evaluation were performed on a worksta-
tion with two GeForce RTX 2080 Ti (NVIDIA, Santa Clara, CA) graphics processing units, a Core i9-9820X (10
cores, 3.3 GHz) central processing unit (Intel, Santa Clara, CA), and 128 GB of random-access memory.
Statistical analysis. We summarized our study population with descriptive statistics, including the median
and IQR for continuous variables, and the proportion for categorical variables. The performance of the tumor tile
classification model was assessed using the overall accuracy and AUROC. Model outputs for tiles with a ground
truth of tumor were compared with those for tiles with a ground truth of non-tumor, using the Wilcoxon rank
sum test. We evaluated the performance of the risk score model using Harrell’s25 and Uno’s26 c-indices, which
indicate better prediction when their values approach one. Each patient was stratified into one of two subgroups
(high-risk and low-risk), based on their patient-level risk score. The median risk score on the validation set from
TCGA-HCC was used as the threshold for patient stratification (Supplementary Fig. 1). Kaplan–Meier analysis
was performed, and a log-rank test was used to compare the survival distributions between the subgroups.
Univariable and multivariable Cox proportional hazards models were used to assess the relationship between
independent variables and RFI. The independent variables included HCC-SurvNet’s risk score, age at surgical
resection, gender, AJCC stage grouping, largest tumor diameter, tumor multifocality, histologic tumor grade,
microvascular invasion, macrovascular invasion, surgical margin status, fibrosis stage, and history of Hepatitis
B, Hepatitis C, alcohol intake, and non-alcoholic fatty liver disease. Of these, variables with univariable p values
of less than 0.1 on either the internal or external test sets were selected for inclusion in the multivariable analysis.
The proportional hazards assumption was checked using Schoenfeld’s global test. To demonstrate the non-linear
relationship between HCC-SurvNet’s risk score and the log relative hazard for RFI, univariable Cox proportional
hazards regression analysis with restricted cubic splines (3 knots) was performed. To account for potential intra-
class correlation among WSI prepared and scanned at the same institution within the TCGA cohort, a mixed-
effect Cox regression model was constructed using the institution as a random effect. Spearman’s correlation
coefficients were computed to gain insight into associations between the HCC-SurvNet risk score and differ-
ent patient characteristics in the external test (Stanford-HCC) cohort. Harrell’s c-index was compared between
HCC-SurvNet’s risk score and the standard AJCC staging system, using a paired t-test.
A two-tailed alpha level of 0.05 was used for statistical significance. All statistical analyses were performed
using Python (v3.6.10, Python Software Foundation, https://www.python.org/) with the lifelines (v0.24.0) and
scikit-survival (v0.11) packages, as well as R (v3.6.3, R Foundation for Statistical Computing, http://www.R-proje
ct.org/) with the survival (v3.1.12), coxme (v2.2.16), pROC (v1.16.2), and rms (v5.1.4) packages.
Data availability
All whole-slide-images for the TCGA cohort are publicly available at https: //portal .gdc.cancer .gov/. The Stanford
whole-slide images are not publicly available, in accordance with institutional requirements governing human
subject privacy protection. However, all de-identified clinicopathologic source data used for the analyses in the
study are provided with this paper.
Code availability
All source code is available under an open-source license at: https://github.com/RubinLab/HCCSur vNet.
Scientific Reports | (2021) 11:2047 | https://doi.org/10.1038/s41598-021-81506-y 12
Vol:.(1234567890)www.nature.com/scientificreports/
Received: 27 August 2020; Accepted: 5 January 2021
References
1. Yang, J. D. et al. A global view of hepatocellular carcinoma: trends, risk, prevention and management. Nat. Rev. Gastroenterol.
Hepatol. 16, 589–604 (2019).
2. Forner, A., Reig, M. & Bruix, J. Hepatocellular carcinoma. Lancet 391, 1301–1314 (2018).
3. Brierley, J. et al. (eds) Liver in TNM Classification of Malignant Tumours 80–84 (Wiley, New York, 2017).
4. Forner, A., Reig, M. E., de Lope, C. R. & Bruix, J. Current strategy for staging and treatment: the BCLC update and future prospects.
Semin. Liver Dis. 30, 61–74 (2010).
5. Villanueva, A. Hepatocellular carcinoma. N. Engl. J. Med. 380, 1450–1462 (2019).
6. Ishizawa, T. et al. Neither multiple tumors nor portal hypertension are surgical contraindications for hepatocellular carcinoma.
Gastroenterology 134, 1908–1916 (2008).
7. Hasegawa, K. et al. Comparison of resection and ablation for hepatocellular carcinoma: a cohort study based on a Japanese nation-
wide survey. J. Hepatol. 58, 724–729 (2013).
8. Roayaie, S. et al. A system of classifying microvascular invasion to predict outcome after resection in patients with hepatocellular
carcinoma. Gastroenterology 137, 850–855 (2009).
9. Kamiyama, T. et al. Analysis of the risk factors for early death due to disease recurrence or progression within 1 year after hepa-
tectomy in patients with hepatocellular carcinoma. World J. Surg. Oncol. 10, 107 (2012).
10. Cucchetti, A. et al. Comparison of recurrence of hepatocellular carcinoma after resection in patients with cirrhosis to its occur-
rence in a surveilled cirrhotic population. Ann. Surg. Oncol. 16, 413–422 (2009).
11. Colecchia, A. et al. Prognostic factors for hepatocellular carcinoma recurrence. World J. Gastroenterol. 20, 5935–5950 (2014).
12. Shim, J. H. et al. Prognostic nomograms for prediction of recurrence and survival after curative liver resection for hepatocellular
carcinoma. Ann. Surg. 261, 939–946 (2015).
13. Rodríguez-Perálvarez, M. et al. A systematic review of microvascular invasion in hepatocellular carcinoma: diagnostic and prog-
nostic variability. Ann. Surg. Oncol. 20, 325–339 (2013).
14. Mobadersany, P. et al. Predicting cancer outcomes from histology and genomics using convolutional networks. Proc. Natl. Acad.
Sci. USA 115, E2970–E2979 (2018).
15. Zhu, X., Yao, J. & Huang, J. Deep convolutional neural network for survival analysis with pathological images. In 2016 IEEE Interna‑
tional Conference on Bioinformatics and Biomedicine (BIBM) 544–547 (IEEE, 2016). doi: https: //doi.org/10.1109/BIBM.2016.78225
79.
16. Kather, J. N. et al. Predicting survival from colorectal cancer histology slides using deep learning: a retrospective multicenter study.
PLoS Med. 16, e1002730 (2019).
17. Kim, D. W. et al. Deep learning-based survival prediction of oral cancer patients. Sci. Rep. 9, 6994 (2019).
18. Wulczyn, E. et al. Deep learning-based survival prediction for multiple cancer types using histopathology images. PLoS ONE 15,
e0233678 (2020).
19. Liao, H. et al. Classification and prognosis prediction from histopathological images of hepatocellular carcinoma by a fully auto-
mated pipeline based on machine learning. Ann. Surg. Oncol. 27, 2359–2369 (2020).
20. Skrede, O.-J. et al. Deep learning for prediction of colorectal cancer outcome: a discovery and validation study. Lancet 395, 350–360
(2020).
21. Saillard, C. et al. Predicting survival after hepatocellular carcinoma resection using deep-learning on histological slides. Hepatology
https://doi.org/10.1002/hep.31207 (2020).
22. Batts, K. P. & Ludwig, J. Chronic hepatitis. An update on terminology and reporting. Am. J. Surg. Pathol. 19, 1409–1417 (1995).
23. Sandler, M., Howard, A., Zhu, M., Zhmoginov, A. & Chen, L.-C. MobileNetV2: inverted residuals and linear bottlenecks. In
2018 IEEE Conference on Computer Vision and Pattern Recognition 4510–4520 (IEEE, 2018). doi: https://doi.org/10.1109/
CVPR.2018.00474.
24. Russakovsky, O. et al. ImageNet large scale visual recognition challenge. Int. J. Comput. Vis. 115, 211–252 (2015).
25. Harrell, F. E. Evaluating the yield of medical tests. JAMA 247, 2543 (1982).
26. Uno, H., Cai, T., Pencina, M. J., D’Agostino, R. B. & Wei, L. J. On the C-statistics for evaluating overall adequacy of risk prediction
procedures with censored survival data. Stat. Med. 30, 1105–1117 (2011).
27. Mormont, R., Geurts, P. & Maree, R. Comparison of deep transfer learning strategies for digital pathology. In 2018 IEEE/CVF Con‑
ference on Computer Vision and Pattern Recognition Workshops (CVPRW) 2343–234309 (IEEE, 2018). doi: https: //doi.org/10.1109/
CVPRW.2018.00303.
28. WHO. Classification of Tumours Editorial Board. Digestive System Tumours 635 (International Agency for Research on Cancer
Press, IARC, Lyon, 2019).
29. Cancer Genome Atlas Research Network. Comprehensive and integrative genomic characterization of hepatocellular carcinoma.
Cell 169(7), 1327–1341 (2017).
30. Liu, J. et al. An integrated TCGA pan-cancer clinical data resource to drive high-quality survival outcome analytics. Cell 173,
400-416.e11 (2018).
31. Hudis, C. A. et al. Proposal for standardized definitions for efficacy end points in adjuvant breast cancer trials: the STEEP system.
J. Clin. Oncol. 25, 2127–2132 (2007).
32. Vahadane, A. et al. Structure-preserving color normalization and sparse stain separation for histological images. IEEE Trans. Med.
Imaging 35, 1962–1971 (2016).
33. Bilaloglu, S. et al. Efficient pan-cancer whole-slide image classification and outlier detection using convolutional neural networks.
Preprint at https://www.biorxiv.org/content/10.1101/633123v1 (2019).
34. Maas, A. L., Hannun A. Y. & Ng A. Y. Rectifier nonlinearities improve neural network acoustic models. In Proceedings of the 30th
International Conference on Machine Learning (2013).
35. Glorot, X. & Bengio, Y. Understanding the difficulty of training deep feedforward neural networks. Proc. Thirteen. Int. Conf. Artif.
Intell. Stat. JMLR 9, 249–256 (2010).
36. Kingma, D. P. & Ba, J. Adam: A Method for Stochastic Optimization. Preprint at https://arxiv.org/abs/1412.6980 (2014).
37. Loshchilov, I. & Hutter, F. Decoupled Weight Decay Regularization. Preprint at https://arxiv.org/abs/1711.05101 (2017).
38. Paszke, A., et al. PyTorch: an imperative style, high-performance deep learning library. Preprint at https: //arxiv. org/abs/1912.01703
(2019).
39. Goode, A., Gilbert, B., Harkes, J., Jukic, D. & Satyanarayanan, M. OpenSlide: a vendor-neutral software foundation for digital
pathology. J. Pathol. Inform. 4, 27 (2013).
Acknowledgements
This work was funded by the Stanford Departments of Pathology and Biomedical Data Science, through a
Stanford Clinical Data Science Fellowship to R.Y. Additional computational infrastructure was provided by the
Scientific Reports | (2021) 11:2047 | https://doi.org/10.1038/s41598-021-81506-y 13
Vol.:(0123456789)www.nature.com/scientificreports/
Stanford Research Computing Center. We would also like to thank Dr. Lu Tian for helpful initial conversations
regarding analysis planning.
Author contributions
R.Y., D.L.R., and J.S. conceived and designed the study; R.Y. and J.S. performed the literature search. R.Y., A.S.
and J.S. performed the data collection; R.Y. performed the model development and performance evaluation; R.Y.
and J.L. performed the statistical analyses; R.Y. drafted the manuscript; D.L.R. and J.S. supervised the study; all
authors participated in the critical revision and approval of the manuscript.
Competing interests
The authors declare no competing interests.
Additional information
Supplementary Information The online version contains supplementary material available at https://doi.
org/10.1038/s41598-021-81506-y.
Correspondence and requests for materials should be addressed to J.S.
Reprints and permissions information is available at www.nature.com/reprints.
Publisher’s note Springer Nature remains neutral with regard to jurisdictional claims in published maps and
institutional affiliations.
Open Access This article is licensed under a Creative Commons Attribution 4.0 International
License, which permits use, sharing, adaptation, distribution and reproduction in any medium or
format, as long as you give appropriate credit to the original author(s) and the source, provide a link to the
Creative Commons licence, and indicate if changes were made. The images or other third party material in this
article are included in the article’s Creative Commons licence, unless indicated otherwise in a credit line to the
material. If material is not included in the article’s Creative Commons licence and your intended use is not
permitted by statutory regulation or exceeds the permitted use, you will need to obtain permission directly from
the copyright holder. To view a copy of this licence, visit http://creativecommons.org/licenses/by/4.0/.
© The Author(s) 2021
Scientific Reports | (2021) 11:2047 | https://doi.org/10.1038/s41598-021-81506-y 14
Vol:.(1234567890)You can also read