DCE-MRI in hepatocellular carcinoma-clinical and therapeutic image biomarker
←
→
Page content transcription
If your browser does not render page correctly, please read the page content below
Online Submissions: http://www.wjgnet.com/esps/                               World J Gastroenterol 2014 March 28; 20(12): 3125-3134
   bpgoffice@wjgnet.com                                                                ISSN 1007-9327 (print) ISSN 2219-2840 (online)
   doi:10.3748/wjg.v20.i12.3125                                    © 2014 Baishideng Publishing Group Co., Limited. All rights reserved.

                                                                                                                TOPIC HIGHLIGHT
WJG 20th Anniversary Special Issues (1): Hepatocellular carcinoma

DCE-MRI in hepatocellular carcinoma-clinical and
therapeutic image biomarker

Bang-Bin Chen, Tiffany Ting-Fang Shih

Bang-Bin Chen, Tiffany Ting-Fang Shih, Department of Medi-               reliable parametric maps of quantitative parameters in
cal Imaging, National Taiwan University Hospital, Taipei 100,            HCC. Successful therapies change quantitative param-
Taiwan                                                                   eters of DCE-MRI, which may be used as early indica-
Bang-Bin Chen, Tiffany Ting-Fang Shih, Department of Radi-               tors of tumor response to anti-angiogenesis agents that
ology, National Taiwan University, Medical College, Taipei 100,          modulate tumor vasculature. In the setting of clinical
Taiwan
                                                                         trials, DCE-MRI may provide relevant clinical informa-
Author contributions: Chen BB and Shih TTF reviewed related
articles and wrote the manuscript.                                       tion on the pharmacodynamic and biologic effects of
Correspondence to: Tiffany Ting-Fang Shih, MD, Depart-                   novel drugs, monitor treatment response and predict
ment of Medical Imaging, National Taiwan University Hospital,            survival outcome in HCC patients.
No.7 Chung-Shan S. Rd., Taipei 100, Taiwan. ttfshih@ntu.edu.tw
Telephone: 886-2-23123456 Fax: 886-2-23224552                            © 2014 Baishideng Publishing Group Co., Limited. All rights
Received: September 30, 2013 Revised: December 26, 2013                  reserved.
Accepted: January 20, 2014
Published online: March 28, 2014                                         Key words: Dynamic contrast-enhanced magnetic reso-
                                                                         nance imaging; Perfusion magnetic resonance imag-
                                                                         ing; Hepatocellular carcinoma; Angiogenesis inhibitors;
                                                                         Clinical trials
Abstract
                                                                         Core tip: Dynamic contrast-enhanced magnetic reso-
Dynamic contrast-enhanced magnetic resonance imag-
                                                                         nance imaging (DCE-MRI) enables tumor vascular
ing (DCE-MRI) enables tumor vascular physiology to
                                                                         physiology to be assessed. Within the tumor tissue,
be assessed. Within the tumor tissue, contrast agents
                                                                         contrast agents extravasate from intravascular into the
(gadolinium chelates) extravasate from intravascular
                                                                         extravascular extracellular space, which results in a sig-
into the extravascular extracellular space (EES), which
                                                                         nal increase on T1-weighted MRI. These signal inten-
results in a signal increase on T1-weighted MRI. The
                                                                         sity-time curves can be deconvoluted by mathematical
rate of contrast agents extravasation to EES in the
                                                                         modeling to extract parameters that may reflect tumor
tumor tissue is determined by vessel leakiness and                       angiogenesis. DCE-MRI allows us to produce highly
blood flow. Thus, the signal measured on DCE-MRI                         reproducible parametric maps of quantitative param-
represents a combination of permeability and per-                        eters in hepatocellular carcinoma (HCC). In the setting
fusion. The semi-quantitative analysis is based on                       of clinical trials, DCE-MRI may provide relevant clinical
the calculation of heuristic parameters that can be                      information of novel drugs, monitor treatment response
extracted from signal intensity-time curves. These                       and predict survival outcome in HCC patients.
enhancing curves can also be deconvoluted by math-
ematical modeling to extract quantitative parameters
that may reflect tumor perfusion, vascular volume, ves-                  Chen BB, Shih TTF. DCE-MRI in hepatocellular carcinoma-
sel permeability and angiogenesis. Because hepatocel-                    clinical and therapeutic image biomarker. World J Gastroenterol
lular carcinoma (HCC) is a hypervascular tumor, many                     2014; 20(12): 3125-3134 Available from: URL: http://www.wjg-
emerging therapies focused on the inhibition of angio-                   net.com/1007-9327/full/v20/i12/3125.htm DOI: http://dx.doi.
genesis. DCE-MRI combined with a pharmacokinetic                         org/10.3748/wjg.v20.i12.3125
model allows us to produce highly reproducible and

           WJG|www.wjgnet.com                                     3125                           March 28, 2014|Volume 20|Issue 12|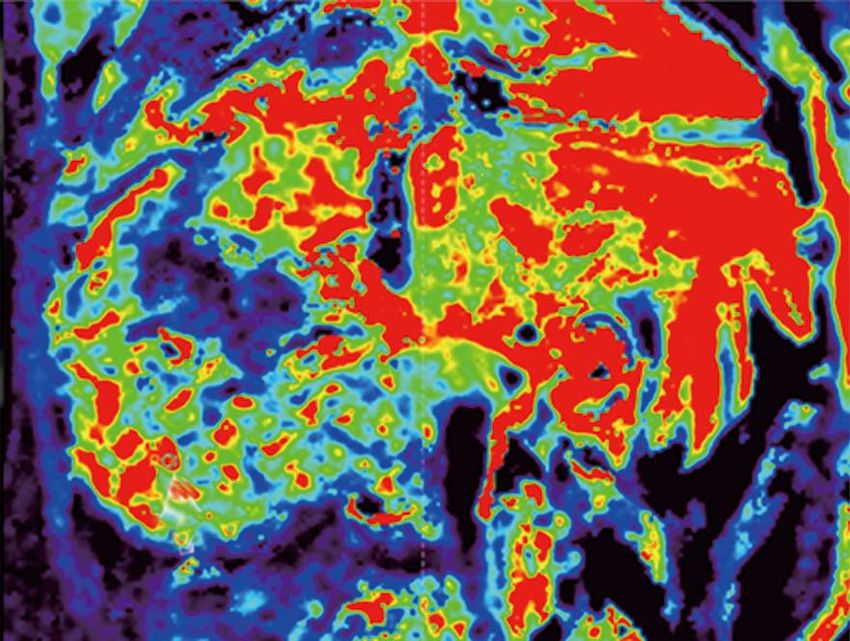
Chen BB et al . DCE-MRI in hepatocellular carcinoma

INTRODUCTION                                                           ability and perfusion. DCE-MRI is sensitive to alterations
                                                                       in vascular permeability, extracellular space, and blood
Hepatocellular carcinoma (HCC) is the sixth most com-                  flow. To ideally record the signal change in the supplying
mon tumor and represents the third leading cause of                    blood vessel and within the tumor, a fast injection rate of
cancer death worldwide[1]. It is the major cause of death              the contrast agent captured with high temporal resolution
in the cirrhotic patients, beside complications from portal            is required[26,27].
hypertension[2]. The hypervascular nature and vascular                     This signal enhancement of liver perfusion can be
in-out flow pattern of this tumor help differentiation of              quantified either with a semi-quantitative or quantitative
HCC from other tumors by non-invasive diagnostic cri-                  analysis. The semi-quantitative analysis is based on the
teria, without the necessity of tissue proof[3]. Like other            calculation of heuristic parameters that can be extracted
malignant tumors, previous researches have reported the                from SI curves. In contrast, the quantitative analysis needs
importance of angiogenesis with the development of                     computational-based curve fitting algorithms using a bi-
HCC[4-8]. For example, Yamaguchi et al[9] found that vascu-            compartmental model with arterial input function. The
lar endothelial growth factor (VEGF) expression in HCC                 parameters from both analysis methods have been shown
tissues may be related to the histological grade. Thus, var-           to present correlation with tumoral angiogenesis[28].
ious angiogenesis inhibitors have been developed to treat
HCC. Among them, the multikinase inhibitor sorafenib
was first approved and validated by two separate phase                 SEMI-QUANTITATIVE ANALYSIS
Ⅲ trials conducted in Western and Asian countries, re-
                                                                       Regarding the semi-quantitative analysis, different param-
spectively[10,11]. Up to December 2013, there are at least
                                                                       eters that characterize the shape of the normalized SI-
20 active phase Ⅲ trials evaluating systemic treatments
                                                                       time curve can be extracted: (1) area under curve (AUC):
for advanced HCC (from clinicaltrials.gov-last visit 20th
December 2013), with most of studies using sorafenib as                expresses the amount of enhancement over a defined
combination therapy.                                                   period of time (usually from starting increment of the
     Dynamic contrast-enhanced magnetic resonance im-                  SI-time curve to 60 or 90 s); (2) maximum of SI or Peak
aging (DCE-MRI) have been used widely as biomarkers                    enhancement ratio (SImaximun-SIbaseline/SIbaseline) of the en-
in many early phase clinical trials to evaluate the effects            hancing curve; (3) wash-in Slope: determines the velocity
of anti-angiogenic drugs that modulate tumor vascula-                  of enhancement. It is calculated as the maximum change
ture[12-16], and to help effective drug selection and optimal          in enhancement per unit time, usually from 20% to 80%
drug dose decision[17]. For phase Ⅲ clinical trials, DCE-              range of the increment curve; and (4) mean transit time
MRI can serve as a surrogate biomarker to evaluate drug                (MTT): represents the mean time for blood to perfuse a
efficacy before the volumetric change of the tumor[18],                region of tissue and is affected by the blood volume and
and may be associated with progression-free survival                   blood flow in the region under analysis.
and/or overall survival in these patients[19,20]. The en-                   The semi-quantitative analysis is widely used because
hancement patterns in HCC obtained by DCE-MRI are                      it is easy to calculate without the need of modeling. How-
influenced by tumor angiogenesis and correlated with tu-               ever, these heuristic parameters are highly affected by the
mor microvessel density and VEGF expression[21]. Thus,                 gain factor of the acquisition systems, contrast media
suppression of tumor vascular permeability induced by                  volume and injection rate, because the true concentration
anti-angiogenic agents can be reliably detected and quan-              of contrast agent in the tissues is not estimated. Thus,
tified by DCE-MRI. Besides assessing anti-angiogenic                   differences in temporal resolution and injection rates can
agents, DCE-MRI can also be used in the evaluation of                  easily change the shape of SI curves, making comparison
response of HCC after other treatments, including tran-                and quantification difficult[26,29]. Moreover, these descrip-
sarterial chemoembolization[22] and radiotherapy[23]. This             tive parameters provide no physiologic insight into the
review will attempt to summarize the current clinical ap-              behavior of the tumor vessels.
plication of DCE-MRI for HCC patients.
                                                                       QUANTITATIVE ANALYSIS
BASIS OF DCE-MRI                                                       On the other hand, the quantitative analysis is based on
DCE-MRI images are obtained by injecting low-molecu-                   modeling the concentration change of the contrast agent
lar-weight gadolinium chelated contrast agent into a vein              using pharmacokinetic modeling techniques[30]. An initial
with a constant rate[24]. The contrast agent is carried by             conversion step of SI to concentration values is needed.
blood flow into the tissue, causing increased signal inten-            Concentration vs time curves are then fitted using a bi-
sity (SI) of the T1-weighted images due to the shortening              compartmental model (vessels and EES) with two vascu-
of the longitudinal relaxation time of the tissue[25]. Within          lar inputs (aorta and portal vein). The following param-
the tissue, the contrast agent passes from the arteries to             eters can be derived from a mathematical model[26,31]: (1)
the capillaries, and then extravasates to the extravascular            Ktrans (forward volume transfer constant): determines the
extracellular space (EES). The rate of contrast agent                  flux of the contrast agent from the intravascular space to
extravasation to EES in the tumor tissue is determined                 the EES. It predominantly represents the vascular perme-
by vessel leakiness and blood flow. Thus, the signal mea-              ability in a permeability-limited (high flow) situation, but
sured on DCE-MRI represents a combination of perme-                    represents the blood flow into the tissue in a flow-limited

           WJG|www.wjgnet.com                                   3126                          March 28, 2014|Volume 20|Issue 12|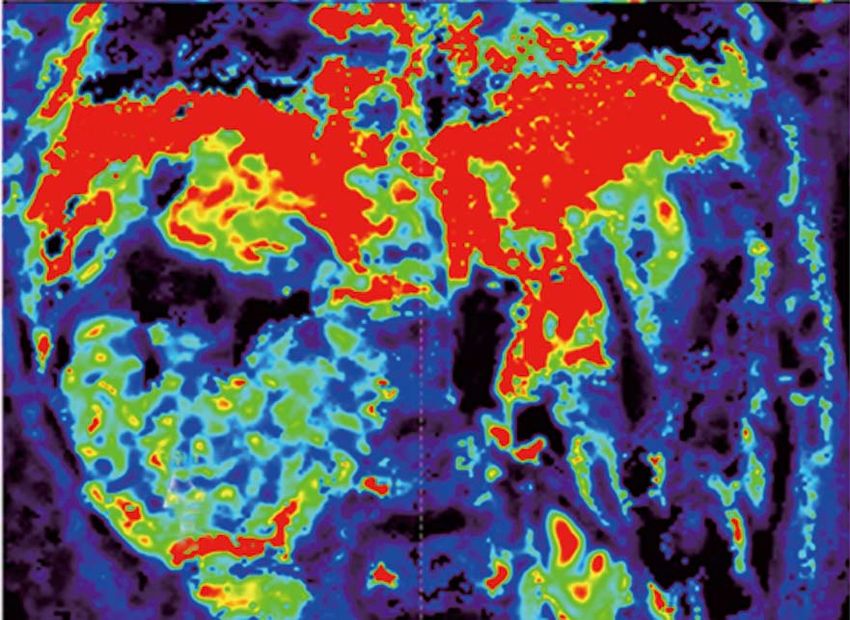
Chen BB et al . DCE-MRI in hepatocellular carcinoma

(high permeability) situation; (2) Kep (reverse reflux rate              of the acquisition have a clear influence on the param-
constant): expresses the return process of the contrast                  eters. To standardize calculations, the acquisition should
agent from the EES to the intravascular space; and (3) Ve                have enough temporal resolution (less than 2-5 s each
(volume fraction of EES): an indirect measure represent-                 image set, during at least 5 min), and voxel-wise statistical
ing the cellular density of the tissue.                                  analysis is suggested.
    These parameters require additional calculations to
generate parametric maps obtained after a pixel-by-pixel
curve fitting process of the region under analysis. Thus,                CLINICAL APPLICATION OF DCE-MRI
they are more computationally technical to obtain than                   DCE-MRI is helpful to differentiate HCC from colorec-
the semi-quantitative ones. After generating parametric                  tal metastasis[53]. The values of arterial, portal and total
maps, the mean or median values within region of inter-                  blood flow, and distribution volume were significantly
ests are usually calculated to represent tumor microvascu-               higher in the HCC than in the metastatic group, whereas
lature, but histogram analysis[32] or heterogeneity in para-             MTT was significantly higher in the metastatic group.
metric maps[33-35] may also provide additional information.                  Miyazaki et al[54] demonstrated that a lower pretreat-
For optimum parameter quantification, a high temporal                    ment distribution volume and high arterial flow fraction
resolution is required to record initial rapid uprising of               was associated with a better response to treatment in pa-
the SI curve immediately after the contrast agent adminis-               tients with neuroendocrine liver metastases treated using
tration[36]. The accuracy of these parameters is influenced              yttrium-90 (Y-90)-labeled octreotide (90Y-DOTATOC).
by curve fitting algorithms[37,38] and magnitude of motion                   DCE-MRI is emerging as a promising method for
artifacts[39].                                                           monitoring tumor response to treatment in HCC pa-
                                                                         tients, and could be used an early imaging biomarker to
                                                                         predict survival outcome of patients. The data are sum-
MODEL SELECTION                                                          marized in Table 1.
Kety[40] first described the flow-limited tracer uptake in                   Wang et al[55] evaluated thalidomide efficacy in seven
tissue, and since then several pharmacokinetic models have               patients with advanced unresectable HCC that had failed
been proposed by Tofts et al[41], Brix et al[42] and Larsson et          to respond to prior local therapy. When comparing the
al[43]. All these models used single source of arterial input            MRI parameters for the tumors before and during treat-
function. Because HCC receives major blood supply from                   ment, they found a statistically significant difference for
hepatic arteries, a single-input two compartment model                   the peak enhancement, the maximal enhancement, and
is commonly used in most articles. However, for liver                    the enhancement slope percentage between two groups
parenchymal disease or metastatic hepatic tumors which                   of patients (four had progressive disease, three had stable
are supplied by both hepatic arteries and portal veins, a                disease/partial response) with different clinical outcomes.
dual-input one compartment model by Materne et al[44] is                     Liang et al[23] investigated the changes of the hepatic
often used to obtain parameters including arterial blood                 parenchyma and tumors by DCE-MRI in 19 patients
flow, portal blood flow, hepatic arterial fraction, distribu-            with advanced HCC who received radiotherapy for 50
tion volume and MTT. For example, several articles used                  Gy in 25 fractions. An increased slope and peak of the
DCE-MRI with Materne model to stage liver fibrosis[45,46].               tumor at week 2 was associated with an improved local
Liver perfusion assessed by DCE-MRI revealed increased                   response (P < 0.05) (Figures 1 and 2). In the parenchyma,
hepatic arterial fraction and distribution volume with in-               an increased slope at week 2 was associated with recur-
creasing liver fibrosis[45,47,48].                                       rence outside the radiation fields or with progression
      Recently, a hepatocyte-specific contrast agent was                 over distant sites (P < 0.05). These findings emphasized
developed and showed different characteristics from tra-                 the value of DCE-MRI in the second week after the start
ditional gadolinium-based contrast agents. A new model                   of radiotherapy in predicting local tumoral responses or
was developed for analysis of hepatic uptake by DCE-                     systemic metastasis of HCC after radiotherapy.
MRI using this hepatocyte-specific contrast agent[49]. De-                   Zhu et al[56] conducted a phase Ⅱ study of sunitinib,
pending on the mathematical model applied and physi-                     an anti-VEFG receptor tyrosine kinase inhibitor, in 34
ological assumptions made, variants of such quantitative                 patients with advanced HCC. They found significant de-
parameters are obtained. Hence, when applying tracer                     creases in Ktrans and Kep after treatment (P < 0.0001). The
kinetic modeling to clinical studies, it is important to state           extent of decrease in Ktrans was substantially higher in pa-
the choice of kinetic model employed at the outset. Cur-                 tients who experienced partial response or stable disease
rently, there is no consensus as to which kinetic model                  compared with that in patients with progressive disease
is best suited to evaluate the liver and HCC, and the de-                or who died during the first two cycles of therapy. They
velopment of an international consensus is necessary to                  concluded that rapid changes in tumor vascular perme-
allow a wider use of this technique.                                     ability are potential determinants of response and resis-
      Different field strengths employed in the dynamic                  tance to sunitinib in HCC.
acquisitions for developing DCE-MRI analysis have                            Jarnagin et al[21] reports the results of 34 patients (26
been shown to have a direct effect on the results of the                 intrahepatic cholangiocarcinoma and eight HCC) who
pharmacokinetic parameters[50,51]. The choice of contrast                received hepatic arterial infusion with floxuridine and dexa-
agent molecular properties[52] and the temporal resolution               methasone. Patients with high pretreatment AUC had a lon-

           WJG|www.wjgnet.com                                     3127                          March 28, 2014|Volume 20|Issue 12|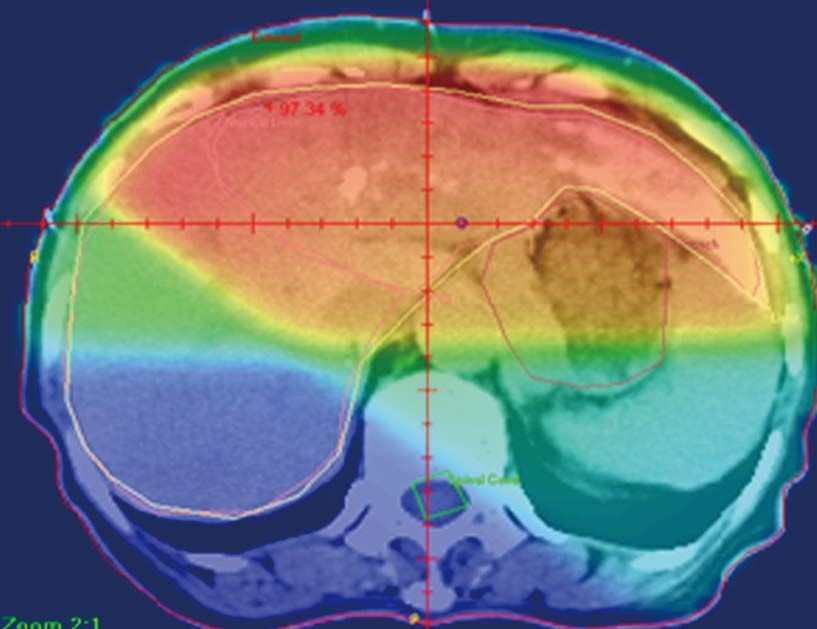
Chen BB et al . DCE-MRI in hepatocellular carcinoma

       Table 1 Summary of different hepatocellular carcinoma treatment, dynamic contrast-enhanced magnetic resonance imaging
       parameters and outcome

       Ref.                        Case number                   Treatment                          Parameter               Time          Outcome            P value
                                                                                                                          interval        measure
      Wang et al[55], 2004               7                     Thalidomide                     ↓ Peak, ↓ Slope             8 wk            P vs NP            < 0.05
      Liang et al[23], 2007             19                     Radiotherapy                        ↓ Peak,                 2 wk            R vs NR            < 0.05
                                                                                                   ↓ Slope
      Zhu et al[56], 2009                 34                     Sunitinib                         ↓ Ktrans                2 wk            P vs NP            < 0.05
      Jarnagin et al[21], 2009    34 (26 ICC and 8       Floxuridine (FUDR) and              High baseline AUC,            2 mo              OS                 0.002
                                        HCC)                 dexamethasone                          ↓ Kep                                    OS                 0.013
      Yopp et al[57], 2011       17 (14 and 3 HCC)         Floxuridine (FUDR)                      ↓ AUC                   2 wk              TTP                0.002
                                                              Bevacizumab
      Hsu et al[58], 2011               31                 Sorafenib, TG/uracil              High baseline Ktrans            -            P vs NP               0.008
      Hsu et al[58], 2011               31                 Sorafenib, TG/uracil                    ↓ Ktrans                2 wk           P vs NP               0.003
                                                                                                                                             OS                 0.015
                                                                                                                                            PFS                 0.030
      Hsu et al[59], 2012               67                      Vandetanib                           ↓ Ktrans              1 wk          Pre vs Post            NS

 HCC: Hepatocellular carcinoma; ICC: Intrahepatic cholangiocarcinoma; TG: Tegafur; P: Progression; NP: Non-progression; R: Responder. NR: Non-
 responder; PFS: Progression-free survival; OS: Overall survival; TTP: Time to progression; Pre: Pre-treatment; Post: Post-treatment; AUC: Area under curve;
 NS: Non-significant.

 A

 B

             55
 C
             50

             45
Intensity

             40

             35

             30
                                        Pause                                                Pause
             25
                   5                   t /s                             5                    t /s

 Figure 1 Forty-nine-year-old man with good local response. A: Isodose distribution and region of interests (ROIs): Left panel: Isodose distribution on center sec-
 tion of radiation treatment planning. Red: 45 Gy; orange: 40 Gy; yellow: 30 Gy; green: 15 Gy and blue: < 15 Gy. Right panel: ROIs on MRI before RT: red: tumor with
 strongest enhancement; yellow: non-tumor liver parenchyma receiving 30 Gy; green: non-tumor liver parenchyma receiving 15 Gy; blue: spleen; B: T1 weighted con-
 trast-enhanced MRI before RT (left panel, the site corresponding to the right panel of (A) and after RT (right panel). Arrows indicate tumor margins; C: Time Intensity
 Curve of ROIs before RT (left panel) and at week 2 of RT (right panel). Red: tumor; yellow: 30 Gy; green: 15 Gy; blue: spleen. The curve of spleen is deviated after
 pause for respiration due to interference by lung perfusion. The initial spike due to refocusing artifact will not be counted into analysis. (From reference [23], reprint
 with permission).

                    WJG|www.wjgnet.com                                             3128                                 March 28, 2014|Volume 20|Issue 12|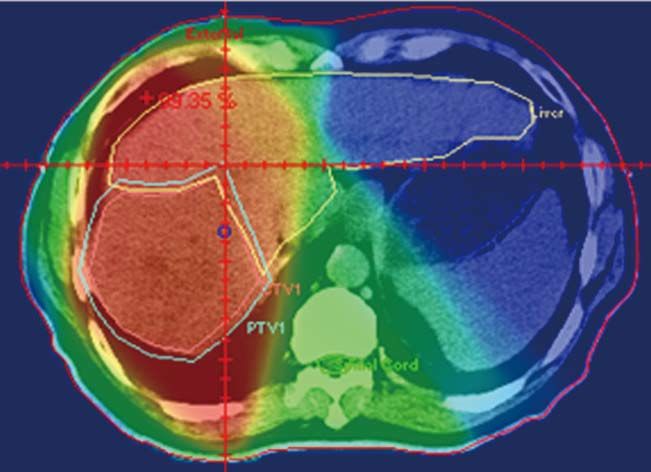
Chen BB et al . DCE-MRI in hepatocellular carcinoma
A
B
C 120
110
100
Intensity
90
80
70
60
50 Pause Pause
40
5 t /s 5 t /s
Figure 2 Sixty-four-year-old woman with good local response and intrahepatic recurrence outside of RT fields. A: Isodose distribution and region of interests
(ROIs): Left panel: isodose distribution on center section of radiation treatment planning. Red: 45 Gy; orange: 40 Gy; yellow: 30 Gy; green: 15 Gy; blue: < 15 Gy. Right
panel: ROIs on magnetic resonance imaging (MRI) before RT: red: tumor with strongest enhancement; yellow: non-tumor liver parenchyma receiving 30 Gy; green:
non-tumor liver parenchyma receiving 15 Gy; blue: spleen; B: T1 weighted contrast-enhanced MRI before RT (left panel, same site as the right panel of (A) and after
RT (right panel). The intersect picture of MRI over right panel demonstrates no tumor progression in the RT field on the center section of treatment planning. Arrows
indicate tumor margins and arrowhead, recurrent tumor outside the field of RT; C: Time Intensity Curve of ROIs before RT (left panel) and at week 2 of RT (right
panel). Red: tumor; yellow: 30 Gy; green: 15 Gy; blue: spleen. The initial spike due to refocusing artifact will not be counted into analysis. (From reference [23], reprint
with permission).
ger median survival than those with low AUC (P = 0.002). with vandetanib treatment, but no significant vascular
Besides, decreased Ktrans and Kep on the first post-treatment change was found 1 wk after treatment. They explained
MR scanning both predicted survival. Hence, pretreatment that the steady-state concentration of vandetanib will
and early post-treatment changes in tumor perfusion char- be reached after at least 4 wk of treatment. Besides, the
acteristics may predict treatment outcome ahead. vascular features of heterogeneous nature of HCC due
Yopp et al[57] evaluated 17 patients (14 intrahepatic to tumor necrosis, arterio-venous shunting within the
cholangiocarcinoma and 3 HCC) treated with floxuridine tumors, and the effects of prior local therapy, might pre-
and bevacizumab. Significant decreases in AUC and Ktrans clude a reliable MRI measurement and comparison.
were noted in tumors after bevacizumab. Time to pro-
gression correlated inversely with changes in AUC after
bevacizumab. Reductions in tumor perfusion were greater HCC EVALUATED BY PERFUSION CT
in tumors expressing markers of anti-hypoxia and VEGF. Similar to DCE-MRI, perfusion CT imaging of the liver
In one study of locally advanced HCCs receiving is performed by acquisition of serial images after con-
sorafenib and cytotoxic therapy, conducted by Hsu et al[58], a trast bolus injection to obtain various perfusion indices,
decrease of Ktrans by 40% or greater after 14 days of treat- including regional tumor blood flow, blood volume, flow-
ment was correlated with longer progression free survival extraction product, and permeability-surface area prod-
(PFS) and overall survival (OS). Besides, percentage of uct. Previous reports have suggested that CT perfusion
Ktrans change (difference between pre- and post-treat- parameters can be used for quantifying tumor vascular-
ment) is an independent predictor of tumor response, ity[60-64] and angiogenesis[65] in HCC, or as biomarkers to
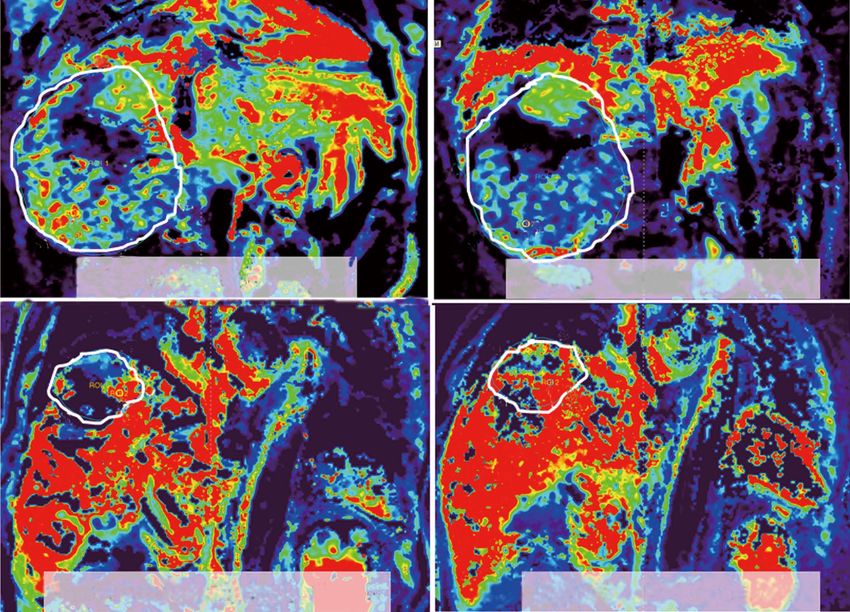
PFS, and OS (Figures 3 and 4). In another study, Hsu et al[59] monitor response to chemoembolization[50], chemother-
reported a randomized clinical trial of 67 HCC patients apy and a range of different targeted agents[66-68]. For ex-
WJG|www.wjgnet.com 3129 March 28, 2014|Volume 20|Issue 12|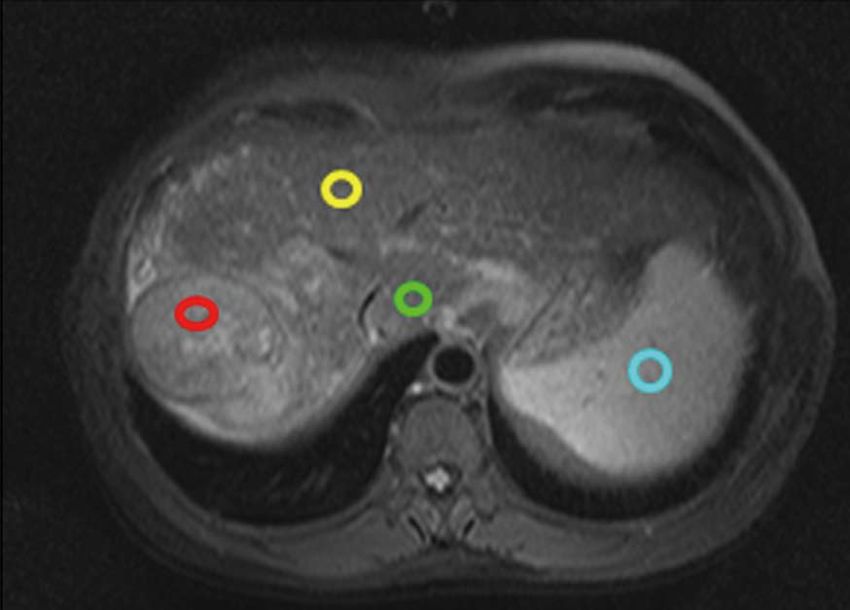
Chen BB et al . DCE-MRI in hepatocellular carcinoma

 A                                                       C                                                         E

                                                                                                                       0    20   40          60   80   100
                                                                                                                                       t /s

 B                                                       D                                                         F

                                                                                                                       0    20   40      60       80   100
                                                                                                                                      t /s

Figure 3 Representative dynamic contrast-enhanced magnetic resonance imaging findings in one advanced hepatocellular carcinoma patient. A: Post-
contrast T1-weighted magnetic resonance imaging at baseline; B: After 14 d of study treatment; C: Corresponding color Ktrans maps at baseline; D: After 14 d of study
treatment. Hypervascular area was indicated by red color. The selected region of interest for Ktrans measurement was indicated by white arrows. In this patient, the
Ktrans values at baseline and after study treatment were 798.6 × 10⁻³/min and 206.6 × 10⁻³/min, respectively; E: The initial area under the gadolinium concentration-
time curves (IAUC) at baseline; F: After study treatment from the same patient. The IAUC values at baseline and after study treatment were 1526.2 mmol/kg × s and
1376.1 mmol/kg × s, respectively. (From reference [58], reprint with permission).

                                                                                                        trans
                        Stable disease day 0                                            Day 14       K          ↓ 74.13%

                                                                                                      trans
                      Progressive disease day 0                                        Day 14       K         ↑ 48.96%

Figure 4 Representative dynamic contrast-enhanced magnetic resonance imaging Ktrans color maps before treatment (day 0, left hand side) and day 14th
after treatment (right hand side) in two advanced hepatocellular carcinoma patients. Corresponding hypervascular area was indicated by red color. region of
interests analysis is more sensitive based on hypervascular part than entire tumor, with mean values. Ktrans is a good diagnostic biomarker in differentiation between
stable disease (SD, upper row) and progressive disease (PD, lower row) in two patients with hepatocellular carcinoma. Difference of Ktrans (∆Ktrans ) between SD and
PD measured on hypervascular part and entire tumor are both significant. (From reference [58], reprint with permission).

               WJG|www.wjgnet.com                                               3130                                     March 28, 2014|Volume 20|Issue 12|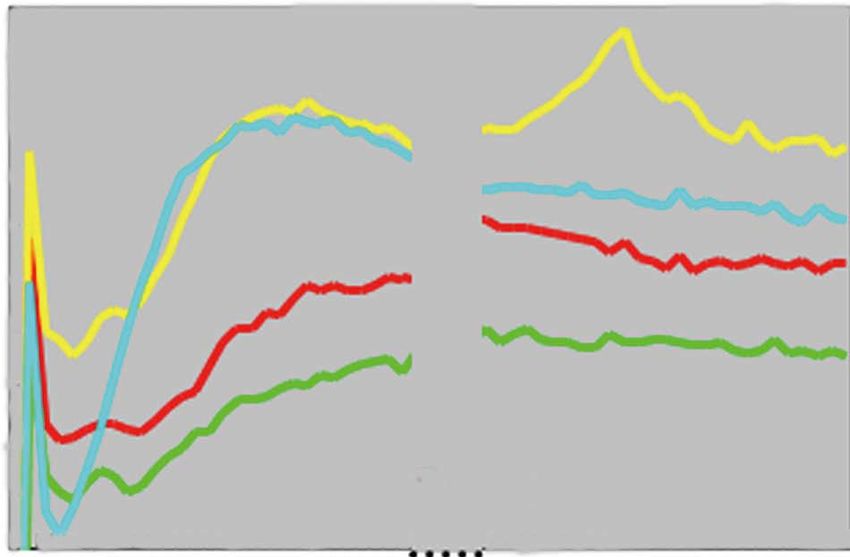
Chen BB et al . DCE-MRI in hepatocellular carcinoma

ample, in one study of locally advanced HCCs receiving                       6     Chao Y, Li CP, Chau GY, Chen CP, King KL, Lui WY, Yen
bevacizumab and cytotoxic therapy, high pretreatment                               SH, Chang FY, Chan WK, Lee SD. Prognostic significance of
                                                                                   vascular endothelial growth factor, basic fibroblast growth
Ktrans by perfusion CT indicated those patients with a RE-                         factor, and angiogenin in patients with resectable hepato-
CIST response[67]. Their findings were comparable with                             cellular carcinoma after surgery. Ann Surg Oncol 2003; 10:
the results investigated by Hsu et al[58]: in patients with                        355-362 [PMID: 12734082]
locally advanced HCCs receiving sorafenib and cytotoxic                      7     von Marschall Z, Cramer T, Höcker M, Finkenzeller G, Wie-
therapy, high pre-treatment Ktrans measured by DCE-MRI                             denmann B, Rosewicz S. Dual mechanism of vascular endo-
                                                                                   thelial growth factor upregulation by hypoxia in human he-
indicated those patients who did not develop progressive
                                                                                   patocellular carcinoma. Gut 2001; 48: 87-96 [PMID: 11115828]
disease[58]. The main drawback of perfusion CT is radia-                     8     Park YN, Kim YB, Yang KM, Park C. Increased expression of
tion exposure, but recent advances in multidetector CT                             vascular endothelial growth factor and angiogenesis in the
technology many help achieve acceptable radiation dose                             early stage of multistep hepatocarcinogenesis. Arch Pathol
in HCC patients.                                                                   Lab Med 2000; 124: 1061-1065 [PMID: 10888784 DOI: 10.1043/
                                                                                   0003-9985(2000)124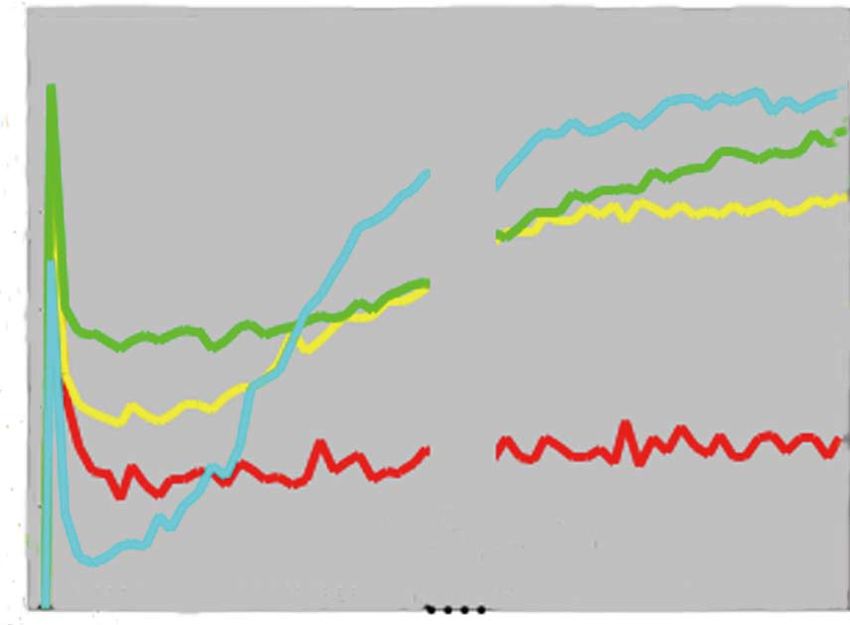
Chen BB et al . DCE-MRI in hepatocellular carcinoma
R, Brunner T, Koh DM, Murphy P, Waterton JC, Parker G, er kinetics for dynamic contrast-enhanced MRI. J Magn Reson
Graves MJ, Scheenen TW, Redpath TW, Orton M, Karczmar Imaging 2011; 34: 1262-1276 [PMID: 21972053 DOI: 10.1002/
G, Huisman H, Barentsz J, Padhani A. Imaging vascular jmri.22795]
function for early stage clinical trials using dynamic contrast- 32 Peng SL, Chen CF, Liu HL, Lui CC, Huang YJ, Lee TH,
enhanced magnetic resonance imaging. Eur Radiol 2012; 22: Chang CC, Wang FN. Analysis of parametric histogram
1451-1464 [PMID: 22562143 DOI: 10.1007/s00330-012-2446-x] from dynamic contrast-enhanced MRI: application in evalu-
18 Wedam SB, Low JA, Yang SX, Chow CK, Choyke P, Dan- ating brain tumor response to radiotherapy. NMR Biomed
forth D, Hewitt SM, Berman A, Steinberg SM, Liewehr DJ, 2012; Epub ahead of print [PMID: 23073840 DOI: 10.1002/
Plehn J, Doshi A, Thomasson D, McCarthy N, Koeppen H, nbm.2882]
Sherman M, Zujewski J, Camphausen K, Chen H, Swain 33 Alic L, van Vliet M, van Dijke CF, Eggermont AM, Veenland
SM. Antiangiogenic and antitumor effects of bevacizumab JF, Niessen WJ. Heterogeneity in DCE-MRI parametric maps:
in patients with inflammatory and locally advanced breast a biomarker for treatment response? Phys Med Biol 2011; 56:
cancer. J Clin Oncol 2006; 24: 769-777 [PMID: 16391297 DOI: 1601-1616 [PMID: 21335648 DOI: 10.1088/0031-9155/56/6/0
10.1200/JCO.2005.03.4645] 06]
19 Pickles MD, Manton DJ, Lowry M, Turnbull LW. Prognostic 34 Rose CJ, Mills SJ, O’Connor JP, Buonaccorsi GA, Roberts C,
value of pre-treatment DCE-MRI parameters in predicting Watson Y, Cheung S, Zhao S, Whitcher B, Jackson A, Parker
disease free and overall survival for breast cancer patients GJ. Quantifying spatial heterogeneity in dynamic contrast-
undergoing neoadjuvant chemotherapy. Eur J Radiol 2009; 71: enhanced MRI parameter maps. Magn Reson Med 2009; 62:
498-505 [PMID: 18572340 DOI: 10.1016/j.ejrad.2008.05.007] 488-499 [PMID: 19466747 DOI: 10.1002/mrm.22003]
20 Flaherty KT, Rosen MA, Heitjan DF, Gallagher ML, Schwartz 35 Rose CJ, Mills S, O’Connor JP, Buonaccorsi GA, Roberts C,
B, Schnall MD, O’Dwyer PJ. Pilot study of DCE-MRI to Watson Y, Whitcher B, Jayson G, Jackson A, Parker GJ. Quan-
predict progression-free survival with sorafenib therapy in tifying heterogeneity in dynamic contrast-enhanced MRI pa-
renal cell carcinoma. Cancer Biol Ther 2008; 7: 496-501 [PMID: rameter maps. Med Image Comput Comput Assist Interv 2007;
18219225] 10: 376-384 [PMID: 18044591]
21 Jarnagin WR, Schwartz LH, Gultekin DH, Gönen M, Havi- 36 Ingrisch M, Dietrich O, Attenberger UI, Nikolaou K, Sour-
land D, Shia J, D’Angelica M, Fong Y, Dematteo R, Tse A, bron S, Reiser MF, Fink C. Quantitative pulmonary perfusion
Blumgart LH, Kemeny N. Regional chemotherapy for unre- magnetic resonance imaging: influence of temporal resolution
sectable primary liver cancer: results of a phase II clinical trial and signal-to-noise ratio. Invest Radiol 2010; 45: 7-14 [PMID:
and assessment of DCE-MRI as a biomarker of survival. Ann 19996761 DOI: 10.1097/RLI.0b013e3181bc2d0c]
Oncol 2009; 20: 1589-1595 [PMID: 19491285 DOI: 10.1093/an- 37 Roberts C, Buckley DL, Parker GJ. Comparison of errors as-
nonc/mdp029] sociated with single- and multi-bolus injection protocols in
22 Taouli B, Johnson RS, Hajdu CH, Oei MT, Merad M, Yee low-temporal-resolution dynamic contrast-enhanced tracer
H, Rusinek H. Hepatocellular carcinoma: perfusion quan- kinetic analysis. Magn Reson Med 2006; 56: 611-619 [PMID:
tification with dynamic contrast-enhanced MRI. AJR Am J 16858671 DOI: 10.1002/mrm.20971]
Roentgenol 2013; 201: 795-800 [PMID: 24059368 DOI: 10.2214/ 38 Luypaert R, Sourbron S, de Mey J. Validity of perfusion
AJR.12.9798] parameters obtained using the modified Tofts model: a simu-
23 Liang PC, Ch’ang HJ, Hsu C, Tseng SS, Shih TT, Wu Liu T. lation study. Magn Reson Med 2011; 65: 1491-1497 [PMID:
Dynamic MRI signals in the second week of radiotherapy re- 21500273 DOI: 10.1002/mrm.22728]
late to treatment outcomes of hepatocellular carcinoma: a pre- 39 Melbourne A, Hipwell J, Modat M, Mertzanidou T, Huisman
liminary result. Liver Int 2007; 27: 516-528 [PMID: 17403192 H, Ourselin S, Hawkes DJ. The effect of motion correction on
DOI: 10.1111/j.1478-3231.2007.01456.x] pharmacokinetic parameter estimation in dynamic-contrast-
24 Ingrisch M, Sourbron S. Tracer-kinetic modeling of dynamic enhanced MRI. Phys Med Biol 2011; 56: 7693-7708 [PMID:
contrast-enhanced MRI and CT: a primer. J Pharmacoki- 22086390 DOI: 10.1088/0031-9155/56/24/001]
net Pharmacodyn 2013; 40: 281-300 [PMID: 23563847 DOI: 40 Kety SS. The theory and applications of the exchange of inert
10.1007/s10928-013-9315-3] gas at the lungs and tissues. Pharmacol Rev 1951; 3: 1-41 [PMID:
25 Brix G, Griebel J, Kiessling F, Wenz F. Tracer kinetic model- 14833874]
ling of tumour angiogenesis based on dynamic contrast- 41 Tofts PS, Wicks DA, Barker GJ. The MRI measurement of
enhanced CT and MRI measurements. Eur J Nucl Med Mol NMR and physiological parameters in tissue to study disease
Imaging 2010; 37 Suppl 1: S30-S51 [PMID: 20503049 DOI: process. Prog Clin Biol Res 1991; 363: 313-325 [PMID: 1988983]
10.1007/s00259-010-1448-7] 42 Brix G, Semmler W, Port R, Schad LR, Layer G, Lorenz WJ.
26 Verma S, Turkbey B, Muradyan N, Rajesh A, Cornud F, Pharmacokinetic parameters in CNS Gd-DTPA enhanced
Haider MA, Choyke PL, Harisinghani M. Overview of dy- MR imaging. J Comput Assist Tomogr 1991; 15: 621-628 [PMID:
namic contrast-enhanced MRI in prostate cancer diagnosis 2061479]
and management. AJR Am J Roentgenol 2012; 198: 1277-1288 43 Larsson HB, Stubgaard M, Frederiksen JL, Jensen M, Henrik-
[PMID: 22623539 DOI: 10.2214/AJR.12.8510] sen O, Paulson OB. Quantitation of blood-brain barrier defect
27 Sourbron S. Technical aspects of MR perfusion. Eur J Radiol 2010; by magnetic resonance imaging and gadolinium-DTPA in
76: 304-313 [PMID: 20363574 DOI: 10.1016/j.ejrad.2010.02.017] patients with multiple sclerosis and brain tumors. Magn
28 Barrett T, Brechbiel M, Bernardo M, Choyke PL. MRI of Reson Med 1990; 16: 117-1131 [PMID: 2255233 DOI: 10.1002/
tumor angiogenesis. J Magn Reson Imaging 2007; 26: 235-249 mrm.1910160111]
[PMID: 17623889 DOI: 10.1002/jmri.20991] 44 Materne R, Smith AM, Peeters F, Dehoux JP, Keyeux A,
29 Essig M, Shiroishi MS, Nguyen TB, Saake M, Provenzale JM, Horsmans Y, Van Beers BE. Assessment of hepatic perfusion
Enterline D, Anzalone N, Dörfler A, Rovira A, Wintermark M, parameters with dynamic MRI. Magn Reson Med 2002; 47:
Law M. Perfusion MRI: the five most frequently asked tech- 135-142 [PMID: 11754452]
nical questions. AJR Am J Roentgenol 2013; 200: 24-34 [PMID: 45 Chen BB, Hsu CY, Yu CW, Wei SY, Kao JH, Lee HS, Shih
23255738 DOI: 10.2214/AJR.12.9543] TT. Dynamic contrast-enhanced magnetic resonance imag-
30 Sourbron SP, Buckley DL. Tracer kinetic modelling ing with Gd-EOB-DTPA for the evaluation of liver fibrosis in
in MRI: estimating perfusion and capillary permeabil- chronic hepatitis patients. Eur Radiol 2012; 22: 171-180 [PMID:
ity. Phys Med Biol 2012; 57: R1-33 [PMID: 22173205 DOI: 21879400 DOI: 10.1007/s00330-011-2249-5]
10.1088/0031-9155/57/2/R1] 46 Annet L, Materne R, Danse E, Jamart J, Horsmans Y, Van
31 Koh TS, Bisdas S, Koh DM, Thng CH. Fundamentals of trac- Beers BE. Hepatic flow parameters measured with MR imag-
WJG|www.wjgnet.com 3132 March 28, 2014|Volume 20|Issue 12|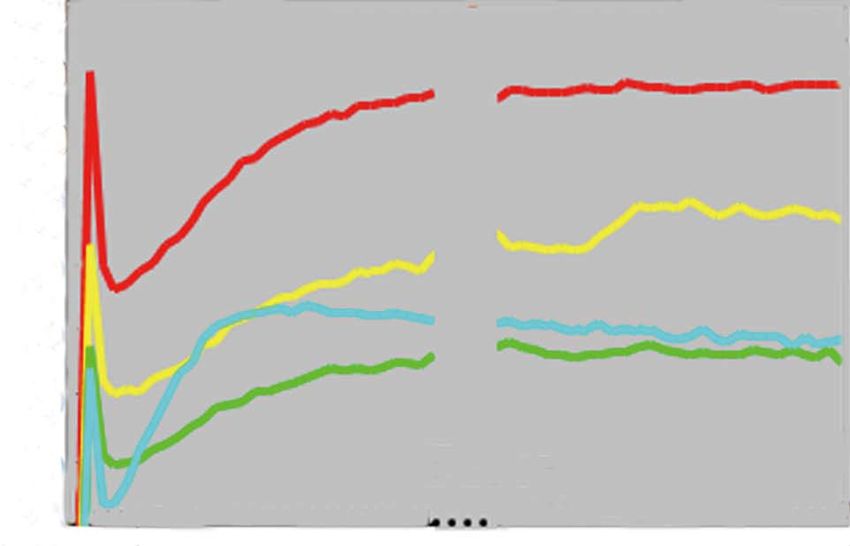
Chen BB et al . DCE-MRI in hepatocellular carcinoma

     ing and Doppler US: correlations with degree of cirrhosis                59    Hsu C, Yang TS, Huo TI, Hsieh RK, Yu CW, Hwang WS,
     and portal hypertension. Radiology 2003; 229: 409-414 [PMID:                   Hsieh TY, Huang WT, Chao Y, Meng R, Cheng AL. Vande-
     12970464 DOI: 10.1148/radiol.2292021128]                                       tanib in patients with inoperable hepatocellular carcinoma:
47   Baxter S, Wang ZJ, Joe BN, Qayyum A, Taouli B, Yeh BM.                         a phase II, randomized, double-blind, placebo-controlled
     Timing bolus dynamic contrast-enhanced (DCE) MRI assess-                       study. J Hepatol 2012; 56: 1097-1103 [PMID: 22245891 DOI:
     ment of hepatic perfusion: Initial experience. J Magn Reson                    10.1016/j.jhep.2011.12.013]
     Imaging 2009; 29: 1317-1322 [PMID: 19472388 DOI: 10.1002/                60    Sahani DV, Holalkere NS, Mueller PR, Zhu AX. Advanced
     jmri.21795]                                                                    hepatocellular carcinoma: CT perfusion of liver and tumor
48   Hagiwara M, Rusinek H, Lee VS, Losada M, Bannan MA,                            tissue--initial experience. Radiology 2007; 243: 736-743 [PMID:
     Krinsky GA, Taouli B. Advanced liver fibrosis: diagnosis                       17517931 DOI: 10.1148/radiol.2433052020]
     with 3D whole-liver perfusion MR imaging--initial experi-                61    Ippolito D, Sironi S, Pozzi M, Antolini L, Ratti L, Meloni F,
     ence. Radiology 2008; 246: 926-934 [PMID: 18195377 DOI:                        Invernizzi F, Valsecchi MG, Fazio F. Perfusion computed
     10.1148/radiol.2463070077]                                                     tomographic assessment of early hepatocellular carcinoma
49   Nilsson H, Nordell A, Vargas R, Douglas L, Jonas E,                            in cirrhotic liver disease: initial observations. J Comput Assist
     Blomqvist L. Assessment of hepatic extraction fraction and                     Tomogr 2008; 32: 855-858 [PMID: 19204443 DOI: 10.1097/
     input relative blood flow using dynamic hepatocyte-specific                    RCT.0b013e318161dc58]
     contrast-enhanced MRI. J Magn Reson Imaging 2009; 29:                    62    Ippolito D, Sironi S, Pozzi M, Antolini L, Invernizzi F, Ratti
     1323-1331 [PMID: 19472389 DOI: 10.1002/jmri.21801]                             L, Leone EB, Fazio F. Perfusion CT in cirrhotic patients with
50   Choi SH, Chung JW, Kim HC, Baek JH, Park CM, Jun S, Kim                        early stage hepatocellular carcinoma: assessment of tumor-
     MU, Lee ES, Cho HR, Jae HJ, Lee W, Park JH. The role of per-                   related vascularization. Eur J Radiol 2010; 73: 148-152 [PMID:
     fusion CT as a follow-up modality after transcatheter arterial                 19054640 DOI: 10.1016/j.ejrad.2008.10.014]
     chemoembolization: an experimental study in a rabbit model.              63    Chen YW, Pan HB, Tseng HH, Hung YT, Huang JS, Chou
     Invest Radiol 2010; 45: 427-436 [PMID: 20440211 DOI: 10.1097/                  CP. Assessment of blood flow in hepatocellular carcinoma:
     RLI.0b013e3181e07516]                                                          correlations of computed tomography perfusion imaging
51   Martí-Bonmatí L, Sanz-Requena R, Alberich-Bayarri A. Phar-                     and circulating angiogenic factors. Int J Mol Sci 2013; 14:
     macokinetic MR analysis of the cartilage is influenced by field                17536-17552 [PMID: 23985826 DOI: 10.3390/ijms140917536]
     strength. Eur J Radiol 2008; 67: 448-452 [PMID: 18434058 DOI:            64    Ippolito D, Sironi S, Pozzi M, Antolini L, Ratti L, Alberzoni
     10.1016/j.ejrad.2008.02.047]                                                   C, Leone EB, Meloni F, Valsecchi MG, Fazio F. Hepatocellu-
52   Jaspers K, Aerts HJ, Leiner T, Oostendorp M, van Riel NA,                      lar carcinoma in cirrhotic liver disease: functional computed
     Post MJ, Backes WH. Reliability of pharmacokinetic parame-                     tomography with perfusion imaging in the assessment of
     ters: small vs. medium-sized contrast agents. Magn Reson Med                   tumor vascularization. Acad Radiol 2008; 15: 919-927 [PMID:
     2009; 62: 779-787 [PMID: 19623622 DOI: 10.1002/mrm.22035]                      18572129 DOI: 10.1016/j.acra.2008.02.005]
53   Abdullah SS, Pialat JB, Wiart M, Duboeuf F, Mabrut JY,                   65    Ippolito D, Capraro C, Casiraghi A, Cestari C, Sironi S.
     Bancel B, Rode A, Ducerf C, Baulieux J, Berthezene Y. Char-                    Quantitative assessment of tumour associated neovascu-
     acterization of hepatocellular carcinoma and colorectal liver                  larisation in patients with liver cirrhosis and hepatocellular
     metastasis by means of perfusion MRI. J Magn Reson Imaging                     carcinoma: role of dynamic-CT perfusion imaging. Eur Radiol
     2008; 28: 390-395 [PMID: 18666145 DOI: 10.1002/jmri.21429]                     2012; 22: 803-811 [PMID: 22086560 DOI: 10.1007/s00330-011-
54   Miyazaki K, Orton MR, Davidson RL, d’Arcy JA, Lewington                        2307-z]
     V, Koh TS, Thng CH, Leach MO, Collins DJ, Koh DM. Neu-                   66    Faivre S, Zappa M, Vilgrain V, Boucher E, Douillard JY,
     roendocrine tumor liver metastases: use of dynamic contrast-                   Lim HY, Kim JS, Im SA, Kang YK, Bouattour M, Dokmak S,
     enhanced MR imaging to monitor and predict radiolabeled                        Dreyer C, Sablin MP, Serrate C, Cheng AL, Lanzalone S, Lin
     octreotide therapy response. Radiology 2012; 263: 139-148                      X, Lechuga MJ, Raymond E. Changes in tumor density in pa-
     [PMID: 22344403 DOI: 10.1148/radiol.12110770]                                  tients with advanced hepatocellular carcinoma treated with
55   Wang J, Chen LT, Tsang YM, Liu TW, Shih TT. Dynamic                            sunitinib. Clin Cancer Res 2011; 17: 4504-4512 [PMID: 21531821
     contrast-enhanced MRI analysis of perfusion changes in ad-                     DOI: 10.1158/1078-0432.CCR-10-1708]
     vanced hepatocellular carcinoma treated with an antiangio-               67    Jiang T, Kambadakone A, Kulkarni NM, Zhu AX, Sahani
     genic agent: a preliminary study. AJR Am J Roentgenol 2004;                    DV. Monitoring response to antiangiogenic treatment and
     183: 713-719 [PMID: 15333360 DOI: 10.2214/ajr.183.3.1830713]                   predicting outcomes in advanced hepatocellular carcinoma
56   Zhu AX, Sahani DV, Duda DG, di Tomaso E, Ancukiewicz                           using image biomarkers, CT perfusion, tumor density, and
     M, Catalano OA, Sindhwani V, Blaszkowsky LS, Yoon SS,                          tumor size (RECIST). Invest Radiol 2012; 47: 11-17 [PMID:
     Lahdenranta J, Bhargava P, Meyerhardt J, Clark JW, Kwak                        21512396 DOI: 10.1097/RLI.0b013e3182199bb5]
     EL, Hezel AF, Miksad R, Abrams TA, Enzinger PC, Fuchs CS,                68    Stewart EE, Sun H, Chen X, Schafer PH, Chen Y, Garcia BM,
     Ryan DP, Jain RK. Efficacy, safety, and potential biomarkers                   Lee TY. Effect of an angiogenesis inhibitor on hepatic tumor
     of sunitinib monotherapy in advanced hepatocellular carci-                     perfusion and the implications for adjuvant cytotoxic thera-
     noma: a phase II study. J Clin Oncol 2009; 27: 3027-3035 [PMID:                py. Radiology 2012; 264: 68-77 [PMID: 22627603 DOI: 10.1148/
     19470923 DOI: 10.1200/JCO.2008.20.9908]                                        radiol.12110674]
57   Yopp AC, Schwartz LH, Kemeny N, Gultekin DH, Gönen                       69    Messiou C, Orton M, Ang JE, Collins DJ, Morgan VA, Mears
     M, Bamboat Z, Shia J, Haviland D, D’Angelica MI, Fong                          D, Castellano I, Papadatos-Pastos D, Brunetto A, Tunariu N,
     Y, DeMatteo RP, Allen PJ, Jarnagin WR. Antiangiogenic                          Mann H, Tessier J, Young H, Ghiorghiu D, Marley S, Kaye
     therapy for primary liver cancer: correlation of changes in                    SB, deBono JS, Leach MO, deSouza NM. Advanced solid
     dynamic contrast-enhanced magnetic resonance imaging                           tumors treated with cediranib: comparison of dynamic con-
     with tissue hypoxia markers and clinical response. Ann Surg                    trast-enhanced MR imaging and CT as markers of vascular
     Oncol 2011; 18: 2192-2199 [PMID: 21286939 DOI: 10.1245/                        activity. Radiology 2012; 265: 426-436 [PMID: 22891356 DOI:
     s10434-011-1570-1]                                                             10.1148/radiol.12112565]
58   Hsu CY, Shen YC, Yu CW, Hsu C, Hu FC, Hsu CH, Chen                       70    Galbraith SM, Lodge MA, Taylor NJ, Rustin GJ, Bentzen S,
     BB, Wei SY, Cheng AL, Shih TT. Dynamic contrast-enhanced                       Stirling JJ, Padhani AR. Reproducibility of dynamic contrast-
     magnetic resonance imaging biomarkers predict survival and                     enhanced MRI in human muscle and tumours: comparison
     response in hepatocellular carcinoma patients treated with                     of quantitative and semi-quantitative analysis. NMR Biomed
     sorafenib and metronomic tegafur/uracil. J Hepatol 2011; 55:                   2002; 15: 132-142 [PMID: 11870909]
     858-865 [PMID: 21338641 DOI: 10.1016/j.jhep.2011.01.032]                 71    Murphy P, Koh DM. Imaging in clinical trials. Cancer Imaging

            WJG|www.wjgnet.com                                         3133                              March 28, 2014|Volume 20|Issue 12|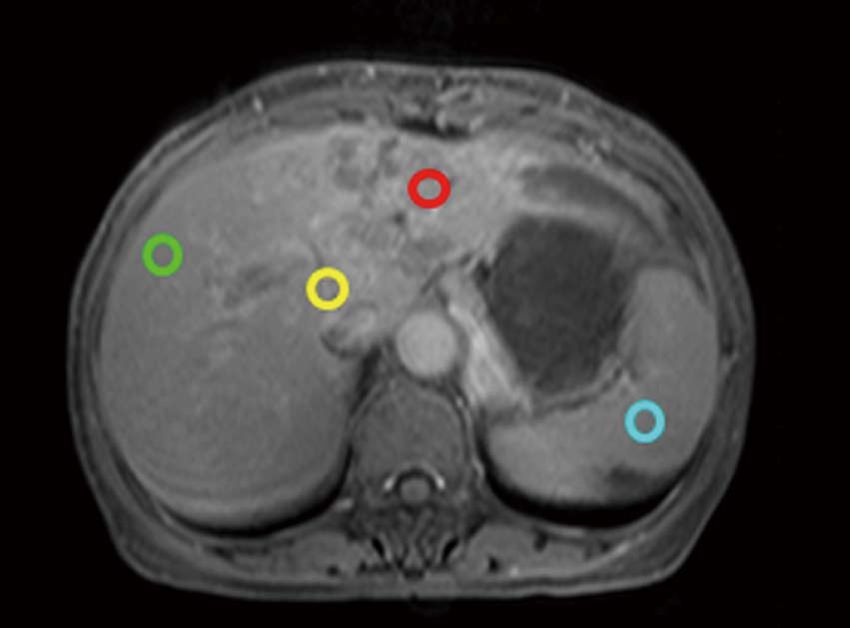
Chen BB et al . DCE-MRI in hepatocellular carcinoma

      2010; 10 Spec no A: S74-S82 [PMID: 20880784 DOI: 10.1102/1           73   Leach MO, Brindle KM, Evelhoch JL, Griffiths JR, Horsman
      470-7330.2010.9027]                                                       MR, Jackson A, Jayson GC, Judson IR, Knopp MV, Maxwell
72    Ng CS, Raunig DL, Jackson EF, Ashton EA, Kelcz F, Kim                     RJ, McIntyre D, Padhani AR, Price P, Rathbone R, Rustin
      KB, Kurzrock R, McShane TM. Reproducibility of perfusion                  GJ, Tofts PS, Tozer GM, Vennart W, Waterton JC, Williams
      parameters in dynamic contrast-enhanced MRI of lung and                   SR, Workman P. The assessment of antiangiogenic and an-
      liver tumors: effect on estimates of patient sample size in               tivascular therapies in early-stage clinical trials using mag-
      clinical trials and on individual patient responses. AJR Am               netic resonance imaging: issues and recommendations. Br J
      J Roentgenol 2010; 194: W134-W140 [PMID: 20093564 DOI:                    Cancer 2005; 92: 1599-1610 [PMID: 15870830 DOI: 10.1038/
      10.2214/AJR.09.3116]                                                      sj.bjc.6602550]

                                                                                      P- Reviewers: Mauro B, Tomuleasa C S- Editor: Qi Y
                                                                                                          L- Editor: A E- Editor: Wu HL

             WJG|www.wjgnet.com                                     3134                            March 28, 2014|Volume 20|Issue 12|
Published by Baishideng Publishing Group Co., Limited
Flat C, 23/F., Lucky Plaza,
315-321 Lockhart Road, Wan Chai, Hong Kong, China
Fax: +852-65557188
Telephone: +852-31779906
E-mail: bpgoffice@wjgnet.com
http://www.wjgnet.com
I S S N 1 0 0 7 - 9 3 2 7
12
9 7 7 10 0 7 9 3 2 0 45
© 2014 Baishideng Publishing Group Co., Limited. All rights reserved.You can also read