Compound Hot and Dry Events in Europe: Variability and Large-Scale Drivers - EPIC
←
→
Page content transcription
If your browser does not render page correctly, please read the page content below
ORIGINAL RESEARCH
                                                                                                                                            published: 07 June 2021
                                                                                                                                    doi: 10.3389/fclim.2021.688991

                                             Compound Hot and Dry Events in
                                             Europe: Variability and Large-Scale
                                             Drivers
                                             Monica Ionita 1*, Diana E. Caldarescu 1 and Viorica Nagavciuc 1,2
                                             1
                                              Alfred Wegener Institute Helmholtz Center for Polar and Marine Research, Paleoclimate Dynamics Group, Bremerhaven,
                                             Germany, 2 Forest Biometrics Laboratory, Faculty of Forestry, Ştefan cel Mare University, Suceava, Romania

                                             An important aspect of inevitable surprises, for the climate system, is the potential of
                                             occurrence of compound extreme events. These can be events that occur at the same
                                             time over the same geographic location or at multiple locations within a given country or
                                             around the world. In this study, we investigate the spatio-temporal variability of summer
                                             compound hot and dry (CHD) events at European level and we quantify the relationship
                                             between the occurrence of CHDs and the large-scale atmospheric circulation. Here
                                             we show that summer 1955 stands out as the year with the largest spatial extent
                                             characterized by hot and dry conditions (∼21.2% at European level), followed by 2015
                                             (∼20.3%), 1959 (∼19.4%), and 1950 (∼16.9%). By employing an Empirical Orthogonal
                                             Function (EOF) analysis we show that there are three preferred centers of action of
                         Edited by:          CHDs over Europe: Fennoscandia, the central part of Europe, and the south-eastern
                       Deepti Singh,
          Washington State University
                                             part of Europe. Overall, hot and dry summers are, in general, associated with persistent
            Vancouver, United States         high-pressure systems over the regions affected by CHDs, which in turn reduces
                        Reviewed by:         the zonal flow and diverts the storm tracks southward. The high-pressure systems
                     Ramiro I. Saurral,
                                             associated with each mode of variability largely suppresses ascending motions, reduces
 University of Buenos Aires, Argentina
                           Kevin Grise,      water vapor condensation and precipitation formation, leading to drought conditions
  University of Virginia, United States      below this atmospheric system. This study may help improve our understanding of the
                  *Correspondence:           spatio-temporal variability of hot and dry summers, at European level, as well as their
                         Monica Ionita
                 Monica.Ionita@awi.de
                                             driving mechanisms.
                                             Keywords: drought, heatwave, compound events, atmospheric circulation, climate variability
                    Specialty section:
          This article was submitted to
          Predictions and Projections,
                a section of the journal
                                             INTRODUCTION
                     Frontiers in Climate
                                             During the last decades a significant increase in the concurrence of hot summers and severe
           Received: 31 March 2021           droughts has been observed (Seneviratne et al., 2012; Zscheischler et al., 2018; Feng et al., 2020;
            Accepted: 14 May 2021
                                             Raymond et al., 2020). The concurrence of dry and hot events is commonly known as “compound
           Published: 07 June 2021
                                             events” (Leonard et al., 2014). Compound events are events that occur at the same time or
                              Citation:      in sequence and at the same geographic location or at multiple locations within a country or
         Ionita M, Caldarescu DE and
                                             around the world (Zscheischler et al., 2018; Raymond et al., 2020). Globally, an increase in the
  Nagavciuc V (2021) Compound Hot
  and Dry Events in Europe: Variability
                                             co-occurrence of hot and dry events over the observational period as well as in future projections
              and Large-Scale Drivers.       has been found (Diffenbaugh et al., 2017; Zscheischler et al., 2018; Manning et al., 2019; Feng et al.,
                Front. Clim. 3:688991.       2020). The understanding of the spatio-temporal evolution and the large-scale drives of compound
     doi: 10.3389/fclim.2021.688991          events is important because these events have often immediate impacts and can cause widespread

Frontiers in Climate | www.frontiersin.org                                        1                                           June 2021 | Volume 3 | Article 688991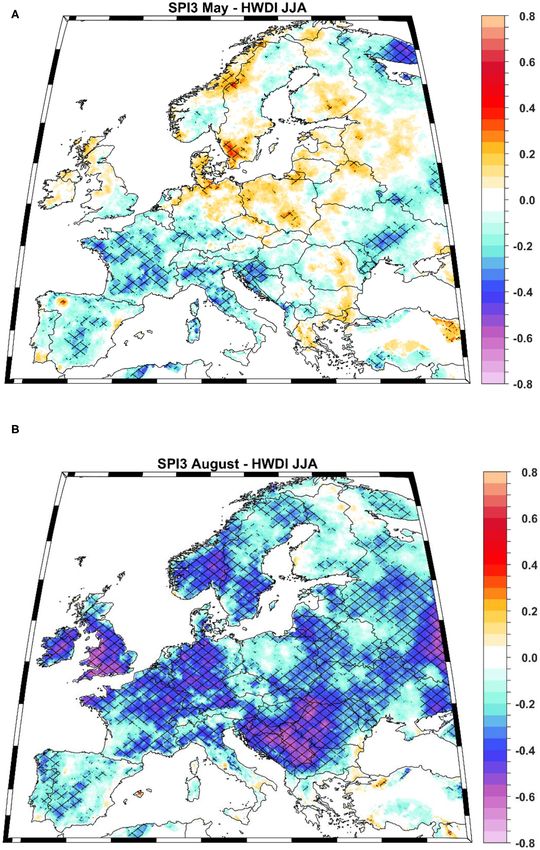
Ionita et al.                                                                                                         Hot and Dry Summers Europe

destruction in terms of societal and economical damages (Feng              different types of extremes such as heatwaves (Della-Marta et al.,
et al., 2020; Raymond et al., 2020). Overall, understanding                2007; Barriopedro et al., 2011; Schubert et al., 2014), droughts
the interactions between several number of competing events                (Schubert et al., 2016; Ionita et al., 2021), floods (Najibi et al.,
is much more complex than understanding the drivers of                     2019; Ionita et al., 2020b), and cold spells (Hori et al., 2011;
individual events.                                                         Rimbu et al., 2014). In general, dry and hot summers over Europe
    Heatwaves and droughts are two of the most important                   are associated with a high frequency of atmospheric blocking
natural hazards with significant impacts on the economy and                centered over the British Isle and/or over Fennoscandia (Della-
society, around the world (Ciais et al., 2005; Kong et al., 2020).         Marta et al., 2007; Ionita et al., 2017; Bakke et al., 2020; Zhang
For example, severe heatwaves and droughts have struck Europe              et al., 2020).
over the last decades (e.g., 2003, 2010, 2015, 2018) and caused                So far, the analysis of compound hot and dry events (CHDs)
significant human and monetary losses as well as environmental             over Europe has been focused either on particular regions (e.g.,
damages (Barriopedro et al., 2011; Ionita et al., 2017, 2020b; Ben-        the Mediterranean region) or just by analyzing the trends of
Ari et al., 2018). The financial losses due to the hot and dry             CHDs and their return values (Manning et al., 2019; Russo et al.,
conditions during summer 2018 alone were estimated to be ∼3.3              2019; Feng et al., 2020). In this study, we aim at making an
billion Euros, being the costliest single-event in Europe (Munich          in-depth analysis of the spatio-temporal variability of CHDs at
RE, 2020). In terms of compound hot and dry events at European             European level as well as to quantify the relationship between the
level Manning et al. (2019), have shown that dry periods are               occurrence of CHDs and the large-scale atmospheric circulation.
becoming hotter, leading to an increase in the occurrence of               Improving our understanding of the physical processes behind
long-lasting dry periods with extremely high temperatures and              the occurrence of compound hot and dry events could help for
that the probability of such compound events (e.g., hot and                a better predictability and impact assessment of future CHDs,
dry) has increased across much of Europe over the last decades.            especially since the topic of predictability becomes essential in
Moreover, they have shown that the main driver of this change              the view of an increase in the likelihood of extreme events in a
in the probability of occurrence of hot and dry events is due to           warming climate. The outline of the study is as follows. The data
the increasing temperatures throughout Europe. In their study              and methods are described in section Data and Methods, while
centered over the Mediterranean region Russo et al. (2019), have           the main results and the discussion are shown in section Results
shown that the hottest months are July and August, and are                 and Discussion. The main conclusions of the paper are presented
usually preceded by the occurrence of droughts in spring and               in section Conclusions.
early summer over the Iberian Peninsula, northern Italy, and the
Balkans. In a recent study Bezak and Mikoš (2020), have shown
that parts of Western Europe, Italy, the Balkan Peninsula, and             DATA AND METHODS
Northern and Eastern Europe stand out as hotspots of compound
drought and extreme heat events.                                           In this study, drought conditions are defined by considering the
    The co-occurrence of hot and dry events can be triggered               3-month Standardized Precipitation Index (SPI3) values  6 days (the 90th percentile is computed over
    Compound events, like heatwaves and droughts, may also                 the reference period 1971–2000). The heatwave duration index
result as a consequence of persistent large-scale atmospheric              (HWDI) is defined as the number of days per season when the
circulation anomalies. One essential driver of heatwaves                   aforementioned criteria were fulfilled. The daily Tx data set has
and droughts over Europe is the prevalence of long-lasting                 been extracted from the E-OBS v23.1e dataset (Cornes et al.,
high-pressure systems, also known as atmospheric blocking                  2018). The E-OBS data set builds on the European Climate
(Barriopedro et al., 2011; Schubert et al., 2014, 2016; Ionita             Assessment and Dataset (ECA&D), which is a database of daily
et al., 2017, 2020a). Atmospheric blocking is defined as a                 meteorological station observations across Europe. The station
large-scale mid-latitude phenomenon, associated with persistent            based data used to develop the gridded E-OBS data set are
quasi-stationary high-pressure systems (Barriopedro et al., 2010).         subjected to quality control and homogeneity test, thus, all series
Overall, atmospheric blocking exerts significant impacts on                are checked for inhomogeneities. The E-OBS v23.1e dataset is

Frontiers in Climate | www.frontiersin.org                             2                                       June 2021 | Volume 3 | Article 688991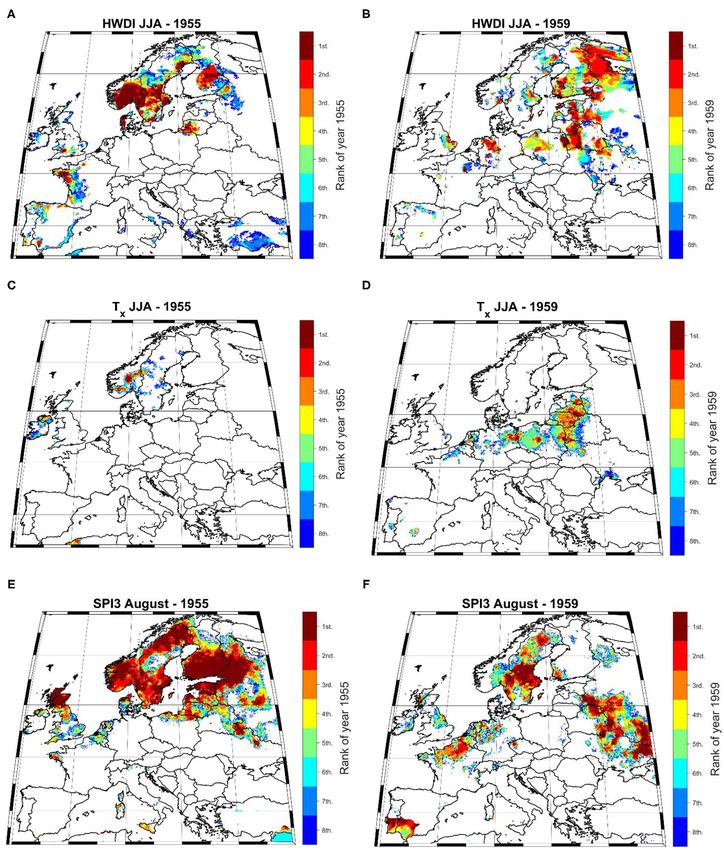
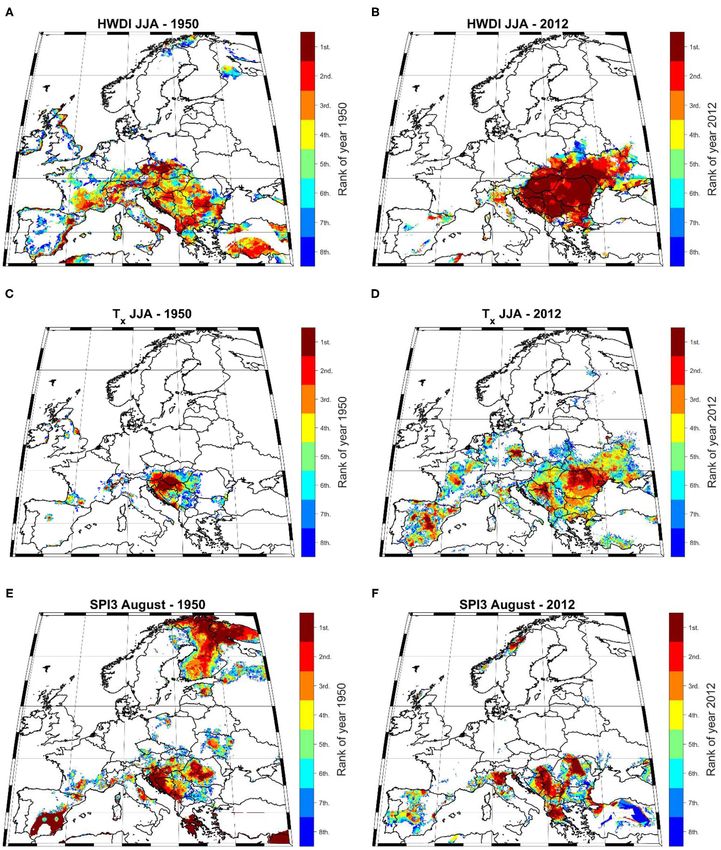
Ionita et al.                                                                                                        Hot and Dry Summers Europe

based on 100 realizations of each daily field (e.g., precipitation,        conditions in spring and the beginning of summer have the
daily mean temperature, daily maximum temperature, and daily               tendency to amplify hot extremes especially over the southern
minimum temperature). The spread of the E-OBS dataset is                   part of Europe, via the land-atmosphere feedbacks (Fischer et al.,
calculated as the difference between the 5th and 95th percentiles          2007; Mueller and Seneviratne, 2012).
over the 100 realizations to provide a measure indicate of the 90%             The in-phase correlation map (Figure 1B) indicates that
uncertainty range. For the current study we use the ensemble               summer heatwaves over large areas in Europe co-occur with dry
mean (the mean over the 100 realizations), which provides a                summers. The highest correlations are found over the British
“best guess” value. In order to isolate Tx values from the global          Isles, Germany, the north-eastern part of France, and the south-
warming sign, before the computation of HWDI, we removed                   eastern part of Europe. Over these regions the correlation is
the linear trend from the entire daily Tx dataset, by applying a 1st       significant (99% significance level) and the highest amplitude (up
degree polynomial regression technique. A similar approach has             to 0.8) is observed over the south-eastern Europe and the British
been used recently by Geirinhas et al. (2021) in order to remove           Isles. An interesting feature of the correlation maps between
the global warming signal from the maximum temperature to                  SPI3 and the HWDI is the fact that over the Iberian Peninsula
compute heatwave events in southeast Brazil. Considering our               and the southern France the correlations are significant when
definition of drought and daily heatwave episodes, a compound              SPI3 leads HWDI (SPI3 May vs. HWDI JJA), while for the
hot and dry event (CHD) is then defined as a combined index                rest of Europe the highest significant correlations are found in-
when a heatwave episode occurs during a period under drought               phase (SPI3 August vs. HWDI JJA). The lag-relationship over
conditions (i.e., a summer with an associated 3 month SPI value            the Iberian Peninsula has been also found by Russo et al. (2019).
(SPI3 August)
Ionita et al.                                                                                                                        Hot and Dry Summers Europe

  FIGURE 1 | (A) Correlation map between May SPI3 and HWDI over the period 1950–2020 and (B) as in (A) but for August SPI3. Hatching indicates the grid points
  where the correlations are significant (99% significance level).

Frontiers in Climate | www.frontiersin.org                                      4                                            June 2021 | Volume 3 | Article 688991
Ionita et al.                                                                                                                  Hot and Dry Summers Europe

  FIGURE 2 | Decadal frequency of compound hot and dry events (CHD) over the period 1951–2020. (A) 1951–1960; (B) 1961–1970; (C) 1971–1980; (D) 1981–1990;
  (E) 1991–2000; (F) 2001–2010; and (G) 2011–2020.

Frontiers in Climate | www.frontiersin.org                                   5                                          June 2021 | Volume 3 | Article 688991
Ionita et al.                                                                                                                              Hot and Dry Summers Europe

  FIGURE 3 | Changes over the period 1986–2020 relative to 1950–1985 for (A) the heat wave duration index (HWDI) for summer (June-July-August); (B) as in (A) but
  for the heatwaves frequency and (C) as in (A) but for August SPI3. The hatched areas indicate significant changes at 99% significance level based on a Student t-test.

(Figure 3B). Overall, August SPI3 indicates an overall wetting                          Spatio-Temporal Variability of Hot and Dry
over the northern part of Europe and a drying tendency                                  Summers
over the southern part of Europe (Figure 3C), which is in                               The patterns of the dominant modes of CHD variability are
agreement with previous studies regarding the change in the                             based on the Empirical Orthogonal Function (EOF) analysis
occurrence of drought events over Europe, based on the SPI                              (von Storch and Zwiers, 1999). In this study, we consider only
drought index (Ionita and Nagavciuc, 2021; Vicente-Serrano                              the first three EOFs patterns which explain ∼28% of the total
et al., 2021).                                                                          variance. The leading EOF (EOF1, Figure 5A) accounts for
    The increase in the number of CHD events over the                                   10.9% of the total variance, the second EOF (EOF2, Figure 8A)
last two decades (Figures 2F,G) is also visible in terms of                             accounts for 9.7% of the total variance and the third EOF (EOF3,
the spatial extent of these CHDs. Over the analyzed period,                             Figure 11A) explains 7.4% of the total variance. These EOF’s are
there is a strong variability in the percent of the area                                well-separated according to the North rule (North et al., 1982).
covered by CHDs (Figure 4). Summer 1955 stands out as
the year with the largest spatial extent under both hot and                             First Mode of Variability and Large-Scale Drivers
dry conditions at European level (∼21.2%), followed by 2015                             The first EOF (Figure 5A) has a dipole-like structure, with the
(∼20.3%), 1959 (∼19.5%), and 1950 (∼16.9%). A detailed                                  highest positive loadings over Fennoscandia and western Russia
description of some of these extreme events will be given in                            and negative loadings over Romania, Hungary, and western
section Spatio-Temporal Variability of Hot and Dry Summers                              Bulgaria. This dipole-like structure emphasizes that the CHD
and Supplementary Table 1.                                                              variability over Fennoscandia and the western part of Russia is

Frontiers in Climate | www.frontiersin.org                                          6                                              June 2021 | Volume 3 | Article 688991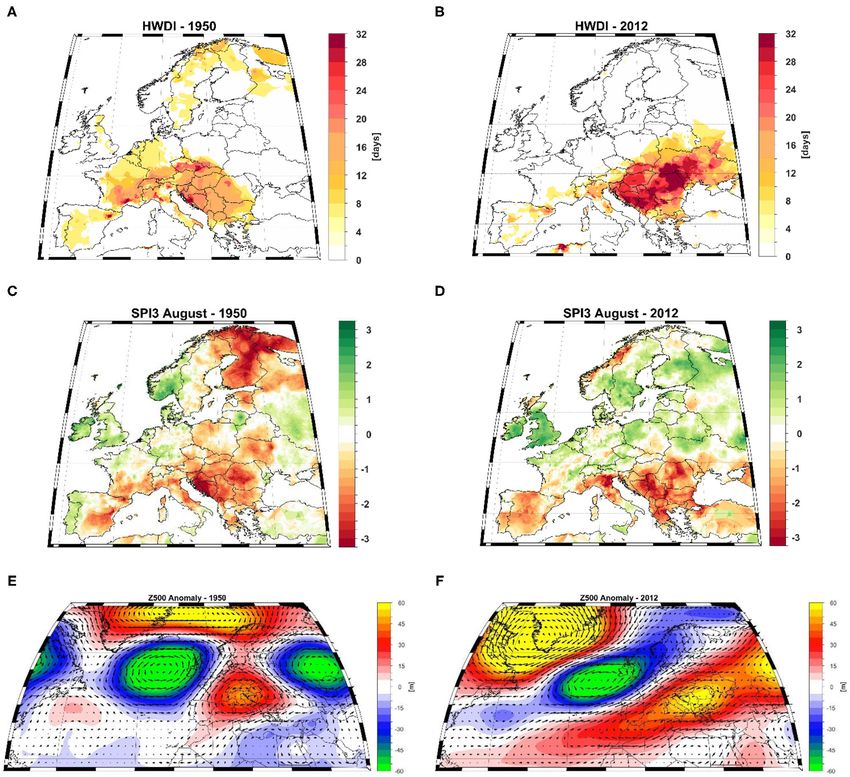
Ionita et al.                                                                                                                       Hot and Dry Summers Europe

  FIGURE 4 | Temporal evolution of the percentage area (11◦ E−40◦ E, 35◦ N−72◦ N) affected by compound hot and dry events over the period 1950–2020.

influenced by the same factors (e.g., the large-scale circulation).                 the amplitude of the PC1 time series (Figure 5B) were recorded
The driest and warmest summers over Fennoscandian and                               in summer 1955 and summer 1959, respectively. The summer
western Russia, in terms of summer PC1 (Figure 5B), were                            1955 and 1959 heatwave and drought as measured by the rank
recorded for the years 1955, 1959, 1975, 1997, and 2006. The                        maps of the summer HWDI, summer Tx and August SPI3
amplitude of the loadings over the southern part of Europe are                      are shown in Figure 6. The most-affected regions during the
much smaller compared to the positive ones over Fennoscandia,                       summer 1955 event were the southern part of Fennoscandia, in
thus we argue that EOF1 is a good indicator for the spatio-                         terms of heatwave duration (Figure 6A), small parts of Norway
temporal variability of CHD over the northern part of Europe.                       in terms of extreme temperatures (Figure 6C), and the whole
    The composite map of Z500 anomalies and the corresponding                       Fennoscandia and western part of Russia, in terms of drought
wind vectors for hot and dry years over Fennoscandia and                            amplitude (Figure 6E). Summer 1955 ranks as the longest one
the western part of Russia, as identified by PC1 (Figure 5B),                       in terms of heatwave duration, over the study period (i.e., 1950–
is characterized by a tripole-like structure, with negative Z500                    2020), over the southern part of Norway and Sweden, and as
anomalies over Greenland, positive Z500 anomalies extending                         the driest one over large regions covering Norway, Finland,
from the eastern coast of U.S. to the northern part of Europe                       Sweden, and western Russia (Figure 6E). In summer 1955 there
and negative Z500 anomalies centered over the Mediterranean                         were more than 20 days/season characterized by heatwaves
region (Figure 5C). This pattern resembles the Scandinavian                         (Figure 7A) and the August SPI3 index reached values up to
blocking pattern (van der Wiel et al., 2019). The high-pressure                     −3 over large parts in the northern part of Europe (Figure 7C).
system centered over Fennoscandia reduces the zonal flow and                        This particular summer was characterized by extreme large-scale
diverts the storm tracks southward, and the regions situated                        circulation anomalies (Figure 7E) which resemble the pattern
under the influence of this system experience warmer and drier                      associated with high values of PC1 (Figure 5C). Summer 1955
than normal conditions due to the advection of warm and dry                         was characterized by negative Z500 anomalies over Greenland,
air from the eastern part of Europe and enhanced incoming solar                     positive Z500 anomalies over Fennoscandia, and negative z500
radiation (Bueh and Nakamura, 2007).                                                anomalies centered over the Mediterranean region. The 1959
    Two of the most extreme hot and dry events, over                                event was more restricted, in terms of spatial extent, compared
Fennoscandia and the western part of Russia, as captured by                         to the 1955 event (Figures 6B,D,F). Summer 1959 ranks as the

Frontiers in Climate | www.frontiersin.org                                      7                                           June 2021 | Volume 3 | Article 688991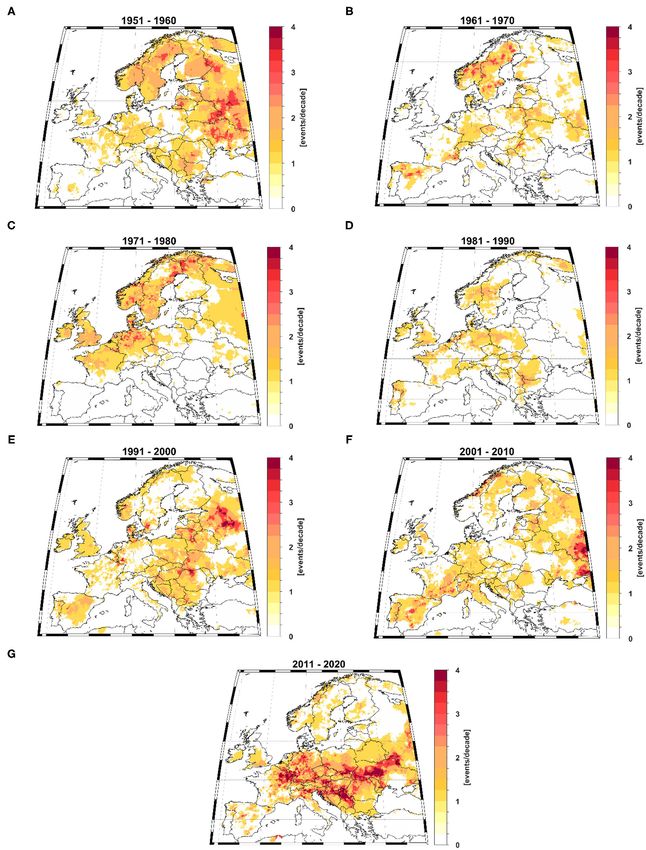
Ionita et al. Hot and Dry Summers Europe
FIGURE 5 | Spatio-temporal variability of compound hot and dry events over the period 1950–2020. (A) First spatial pattern (EOF1); (B) the temporal evolution (PC1)
corresponding to EOF1; (C) The high (PC1 > 1 standard deviation) composite map between PC1 and the summer (JJA) Z500 and the wind vectors at 500 mb. Units:
(C) Z500 [m].
longest one in terms of heatwave duration (Figure 6B) over 2003, 2015, 2018, and 2019. The spatio-temporal structure of
small areas in the north-western part of Russia, and as the EOF2 captures best the extremely warm and dry summer over the
driest one in the southern part of Sweden and small regions last two decades (e.g., 2003, 2015, and 2018) (Schär et al., 2004;
in western Russia (Figure 6D). In summer 1959, there were Ionita et al., 2017, 2020a; Bakke et al., 2020; Ionita and Nagavciuc,
up to 20 days/season characterized by heatwaves (Figure 7B). 2020).
The magnitude of the 1959 drought event was smaller (in The composite map of Z500 anomalies and the corresponding
terms of amplitude) compared to the 1955 event (Figure 7D). wind vectors for hot and dry years over central Europe, as
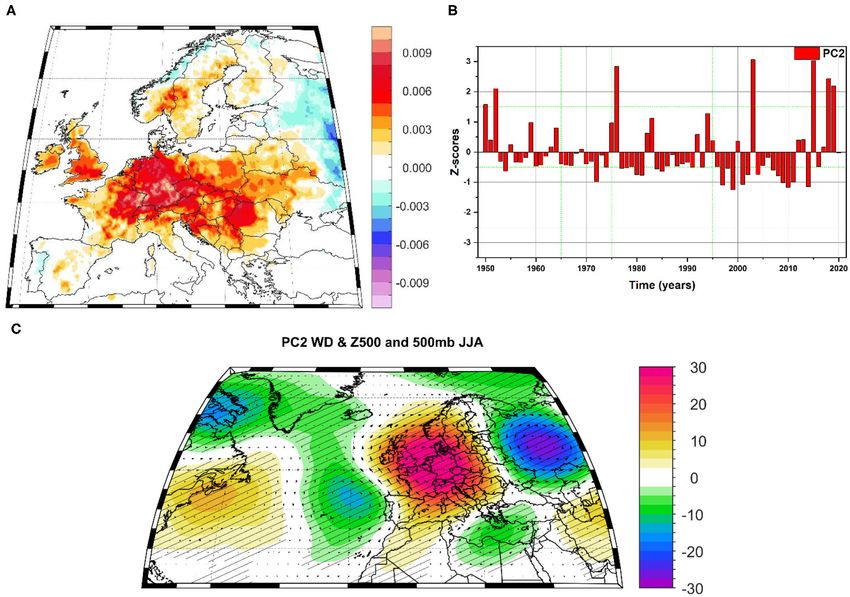
The prevailing large-scale atmospheric circulation associated identified by PC2 (Figure 8B), is characterized by a wave train
with the 1959 events resembles the one in summer 1955, with with positive Z500 anomalies over the eastern coast of the U.S.,
positive Z500 anomalies over Fennoscandia flanked by negative negative Z500 anomalies over central North Atlantic Ocean,
Z500 anomalies over Greenland and the Mediterranean Sea positive Z500 anomalies over central Europe and negative Z500
(Figure 7F). anomalies over western Russia (Figure 8C). The wave-train like
pattern of alternating Z500 anomalies, resembling an -like
Second Mode of Variability and Large-Scale Drivers blocking pattern, suggests a stationary Rossby wave signal which
The second EOF pattern (Figure 8A) describes 9.7% of the total is usually associated with droughts and heatwaves over the
variance of the summer CHD variability and is characterized by Eurasian continent (Ionita et al., 2012, 2015; Schubert et al.,
positive loadings over central Europe, with the highest amplitude 2014).
over Germany. Summer PC2 (Figure 8B) is characterized by Two of the most extreme hot and dry events, over the
interannual variability with driest and warmest summers, in central part of Europe, as captured by the amplitude of the
terms of summer PC2 amplitude, recorded for the years 1976, PC2 time series (Figure 8B) were recorded in summer 2003
Frontiers in Climate | www.frontiersin.org 8 June 2021 | Volume 3 | Article 688991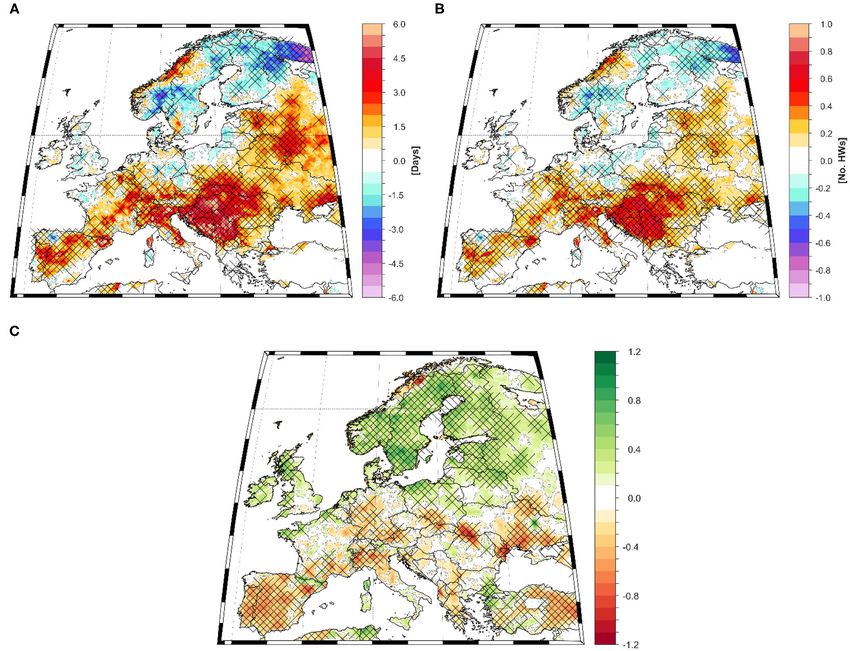
Ionita et al.                                                                                                                             Hot and Dry Summers Europe

  FIGURE 6 | (A) Top-eight ranking of summer 1955 HWDI; (B) Top-eight ranking of summer 1959 HWDI; (C) Top-eight ranking of summer 1955 Tx ; (D) Top-eight
  ranking of summer 1959 Tx ; (E) Top-eight ranking of 1955 August SPI3; (F) Top-eight ranking of 1959 August SPI3; 1st means the longest heatwave (HWDI), hottest
  (Tx ), and driest (SPI3) since 1950, 2nd signifies the second longest, hottest and/or driest, etc., and all ranks >8 are shown in white. Analyzed period: 1950–2020.

Frontiers in Climate | www.frontiersin.org                                         9                                              June 2021 | Volume 3 | Article 688991
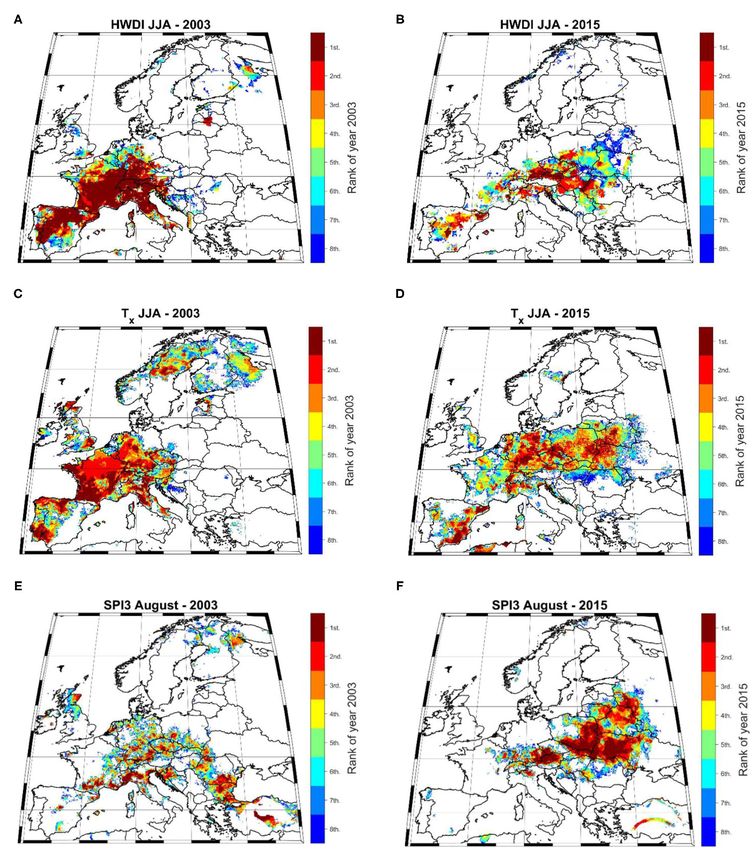
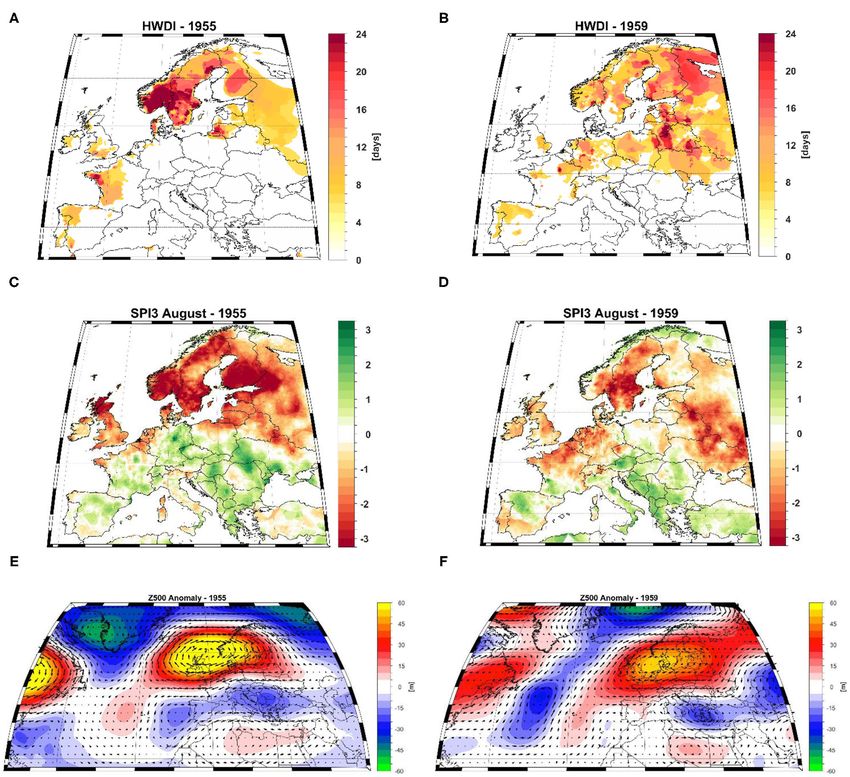
Ionita et al.                                                                                                             Hot and Dry Summers Europe

  FIGURE 7 | Study cases 1955 and 1959. (A) HWDI−1955, (B) HWDI−1959; (C) August SPI3–1955; (D) August SPI3–1959; (E) Summer Z500 anomalies−1955 and
  (F) Summer Z500 anomalies−1959. The anomalies are computed relative to the period 1971–2000.

and summer 2015, respectively. Summer 2003 experienced the                    −3 over large parts of the central part of Europe (Figure 10C).
longest heatwave (Figure 9A) and the warmest summer on                        This particular summer was characterized by extreme large-scale
record over most of central Europe, including the northwestern                circulation anomalies (Figure 10E) which resemble a Rossby
parts of Spain, France, Italy, Germany, Switzerland, and Austria,             wave train, similar to the one associated with high values of PC2
and the western part of the Czech Republic (Figure 9C). In                    (Figure 8B). Summer 2003 was characterized by negative Z500
terms of drought, summer 2003 was among the driest one over                   anomalies over the central North Atlantic Ocean, positive Z500
small areas in the southern part of Germany and northern                      anomalies over central Europe, and negative Z500 anomalies over
part of Italy (Figure 9E). The 2003 event was much clearly                    western Russia.
visible in terms of heat wave duration, and to a lesser extent                   The 2015 event, was shifted toward the eastern part of Europe
in terms of drought. In summer 2003 there were more than                      compared to the 2003 event. In 2015, the longest heatwave
40 days/season characterized by extremely high temperatures                   (Figure 9B) and the hottest regions were the southern part
(Figure 10A) and the August SPI3 index reached values up to                   of Germany, the Czech Republic, eastern part of Austria, and

Frontiers in Climate | www.frontiersin.org                               10                                        June 2021 | Volume 3 | Article 688991
Ionita et al.                                                                                                                       Hot and Dry Summers Europe

  FIGURE 8 | Spatio-temporal variability of compound hot and dry events over the period 1950–2020. (A) Second spatial pattern (EOF2); (B) the temporal evolution
  (PC2) corresponding to EOF2; (C) The high (PC2 > 1 standard deviation) composite map between PC2 and the summer (JJA) Z500 and the wind vectors at 500 mb.
  Units: (C) Z500 [m].

small regions from the eastern part of Europe (Figure 9D).                          by positive loadings over south-eastern Europe (i.e., Romania,
Summer 2015 was also the driest one on record over the                              Bulgaria, Hungary, Serbia, Croatia), negative but very weak
eastern part of Austria, the eastern part of Poland, the western                    (in terms of amplitude) loadings over Poland and Ukraine
part of Ukraine, and eastern part of Belarus (Figure 9F). In                        and positive, but weak, amplitudes over the northern part
summer 2015 there were up to 25 days/season characterized                           of Finland. The driest and warmest summers, based on
by extremely high temperatures (Figure 10B) and the August                          the temporal evolution of summer PC3 (Figure 11B), were
SPI3 index reached the highest amplitude over the central and                       recorded for the years 1950, 1955, 1980, 1998, 2000, 2003,
eastern part of Europe (Figure 10D). In summer 2015, the                            2006, and 2012.
Z500 anomalies are projecting onto an -like block pattern                             The composite map of Z500 anomalies and the corresponding
with negative Z500 anomalies over the middle of the North                           wind vectors for hot and dry years over the south-eastern part
Atlantic Ocean, an anomalous positive center of Z500 anomalies                      of Europe, as identified by PC3 (Figure 11C), is characterized
over central Europe, and negative z500 anomalies over western                       by a wave train with negative Z500 anomalies over the central
Russia (Figure 10F). Under the influence of  blocks and                            North Atlantic Ocean, positive Z500 anomalies over the south-
northward shifted storm tracks, warm dry air from southern                          eastern part of Europe coupled to another center of positive
Europe and Africa was pulled northward, pushing temperatures                        Z500 anomalies over Fennoscandia and negative Z500 anomalies
higher than normal over the Iberian Peninsula, central Europe,                      over western Russia (Figure 11C). This kind of pattern favors
and the Balkans.                                                                    the advection of dry and warm air from the southeastern part of
                                                                                    Europe, reduced precipitation, and high temperatures over the
Third Mode of Variability and Large-Scale Drivers                                   region situated under the influence of the high-pressure system.
The third EOF pattern (Figure 11A) describes 7.4% of the total                      For the case studies, based on the PC3 amplitude, we have chosen
variance of the summer CHD variability and is characterized                         the years with the highest amplitude: 1950 and 2012, respectively.

Frontiers in Climate | www.frontiersin.org                                     11                                            June 2021 | Volume 3 | Article 688991
Ionita et al. Hot and Dry Summers Europe FIGURE 9 | (A) Top-eight ranking of summer 2003 HWDI; (B) Top-eight ranking of summer 2015 HWDI; (C) Top-eight ranking of summer 2003 Tx ; (D) Top-eight ranking of summer 2015 Tx ; (E) Top-eight ranking of 2003 August SPI3; (F) Top-eight ranking of 2015 August SPI3. 1st means the longest heatwave (HWDI), hottest (Tx ), and driest (SPI3) since 1950, 2nd signifies the second longest, hottest and/or driest, etc., and all ranks >8 are shown in white. Analyzed period: 1950–2020. In summer 1950 record breaking heatwaves were observed over of Hungary and Croatia (Figure 12C), but this summer was the small regions in the southern part of Europe (Figure 12A) and driest one on record over the northern part of Finland and small record-breaking temperatures were observed in the southern part regions over the southern part of Europe (i.e., Croatia, Bosnia Frontiers in Climate | www.frontiersin.org 12 June 2021 | Volume 3 | Article 688991
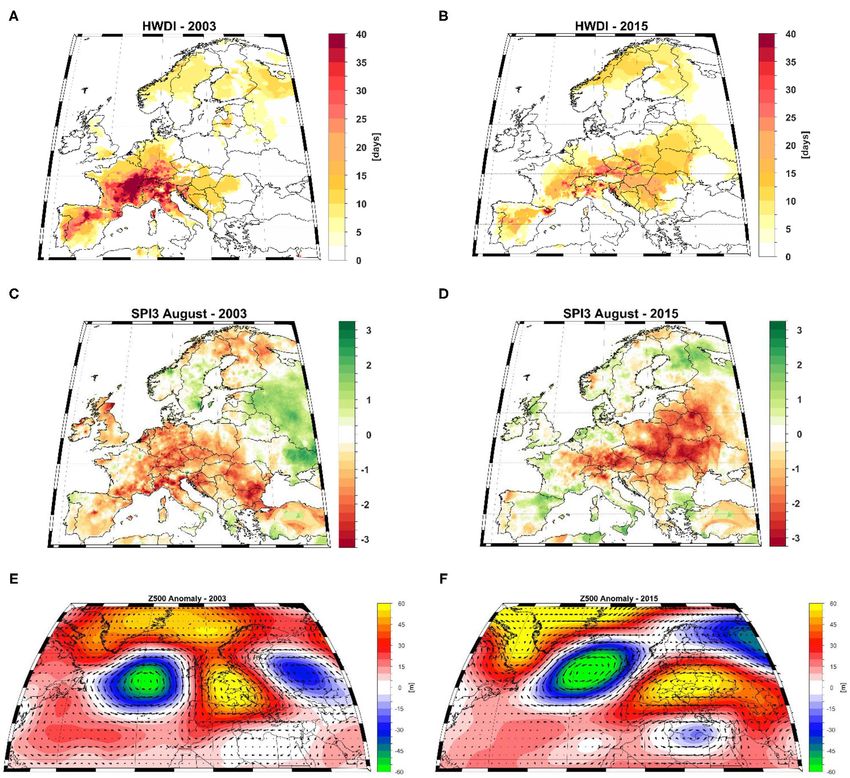
Ionita et al.                                                                                                             Hot and Dry Summers Europe

  FIGURE 10 | Study cases 2003 and 2015. (A) HWDI−2003, (B) HWDI−2015; (C) August SPI3–2003; (D) August SPI3–2015; (E) Summer Z500 anomalies−2003
  and (F) Summer Z500 anomalies−2015. The anomalies are computed relative to the period 1971–2000.

and Herzegovina, Romania) (Figure 12E). In summer 1950 there                  and negative Z500 anomalies over western Russia (Figure 13E).
were up to 18 days/season of extremely high temperatures                      The wave trains observed throughout summer 1950, resembles
(Figure 13A) over the southern part of Europe, with a focus                   an omega-like blocking. Under the influence of this omega-like
on Croatia, Bosnia, and Herzegovina, Serbia, and the western                  blocking situation, the storm tracks were shifted northwards and
part of Romania, complemented by extremely dry conditions                     the regions under the influence of the high-pressure system were
over these regions (Figure 13C). Dry conditions were recorded                 characterized by warm and dry conditions (Figures 13A,C).
also over Finland and the north-western part of Russia, but over                 Opposite to the 1950 event, the summer 2012 event was more
this region no heatwaves were recorded (Figure 13A). The large-               prominent in terms of temperature extremes (Figures 12B,D)
scale atmospheric circulation, throughout summer 1950 was                     and to a lesser extent in terms of drought (Figure 12F). Summer
characterized by a wave train-like in the Z500, with negative Z500            2012 was the longest one on record in terms of heat wave duration
anomalies over the central North Atlantic Ocean, positive Z500                over large areas in the south-eastern part of Europe, including
anomalies over southern Europe and the Mediterranean Sea,                     Croatia, Bosnia and Herzegovina, Serbia, Slovakia, Romania,

Frontiers in Climate | www.frontiersin.org                               13                                        June 2021 | Volume 3 | Article 688991
Ionita et al.                                                                                                                       Hot and Dry Summers Europe

  FIGURE 11 | Spatio-temporal variability of compound hot and dry events over the period 1950–2020. (A) Third spatial pattern (EOF3); (B) the temporal evolution
  (PC3) corresponding to EOF3; (C) The high (PC3 > 1 standard deviation) composite map between PC2 and the summer (JJA) Z500 and the wind vectors at 500 mb.
  Units: (C) Z500 [m].

Ukraine, Moldova, Hungary, and Bulgaria (Figure 12B) and the                        (Leonard et al., 2014). The observed increase in CHDs, which
hottest one on record mainly over Romania (Figure 12D). Over                        severally impacted the society, economy, and the environment
these regions there were up to 32 days/season with extremely high                   over the past decades, has brought the scientific community to
temperatures (Figure 13B). The most affected areas, in terms                        make an extensive analysis of the variability, trends, and future
of drought (Figures 12D, 13D), were Serbia, Bulgaria, and the                       projection of these events, either at global scale (Feng et al.,
central part of Romania. The prevailing large-scale circulation,                    2020; Ridder et al., 2020; Mukherjee and Mishra, 2021) or at
throughout summer 2012 (Figure 13F), was characterized by                           regional scale (Kattsov et al., 2005; Von Buttlar et al., 2018; Hao
a wave train-like pattern, with positive Z500 anomalies over                        et al., 2019; Russo et al., 2019; Vogel et al., 2019; Bezak and
Greenland, negative Z500 anomalies over the central North                           Mikoš, 2020; Kong et al., 2020). In this respect, we explored the
Atlantic Ocean, and positive Z500 anomalies extending from the                      spatio-temporal variability of CHDs at European level and we
northern part of Africa toward the eastern part of Europe up to                     quantified the relationship between the occurrence of CHDs
Russia. Overall, the spatial distribution of the Z500 anomalies for                 and the large-scale atmospheric circulation. The study was
summer 2012 are different compared to the ones in Figure 11C.                       motivated by the fact, that to our knowledge no study is available
The highest Z500 anomalies are observed over the region where                       at European scale which investigates both the spatio-temporal
the hottest and driest conditions were recorded in summer 2012,                     variability of CHD as well as with their driving factors. This
namely the south-eastern part of Europe (Figures 13A,D,F).                          has been accomplished by performing an EOF analysis over
                                                                                    the period 1950–2020 on CHDs computed at European scale,
CONCLUSIONS                                                                         in order to analyze the spatio-temporal variability, followed
                                                                                    by analyzing the prevailing large-scale atmospheric circulation
Concurrent hot and dry events (CHDs) can result in significant                      corresponding to each spatial CHD mode of variability. The
socio-economic damages, compared to individual events                               main conclusions of this study can be summarized as follows:

Frontiers in Climate | www.frontiersin.org                                     14                                            June 2021 | Volume 3 | Article 688991
Ionita et al. Hot and Dry Summers Europe FIGURE 12 | (A) Top-eight ranking of summer 1950 HWDI; (B) Top-eight ranking of summer 2012 HWDI; (C) Top-eight ranking of summer 1950 Tx ; (D) Top-eight ranking of summer 2012 Tx ; (E) Top-eight ranking of 1950 August SPI3; (F) Top-eight ranking of 2012 August SPI3. 1st means the longest heatwave (HWDI), hottest (Tx ), and driest (SPI3) since 1950, 2nd signifies the second longest, hottest and/or driest, etc., and all ranks >8 are shown in white. Analyzed period: 1950–2020. Frontiers in Climate | www.frontiersin.org 15 June 2021 | Volume 3 | Article 688991
Ionita et al.                                                                                                             Hot and Dry Summers Europe

  FIGURE 13 | Study cases 1950 and 2012. (A) HWDI−1950, (B) HWDI−2012; (C) August SPI3–1950; (D) August SPI3–2012; (E) Summer Z500 anomalies−1950
  and (F) Summer Z500 anomalies−2012. The anomalies are computed relative to the period 1971–2000.

• There is a large variability in the co-occurrence of CHDs at                • Most of the spatio-temporal variability of CHDs can be
  European level over the last ∼70 years. The period 2011–                      explained by the first three EOF patterns which have a
  2020 is characterized by an increase in the number of                         preferred center of action. EOF1 has a dipole-like structure,
  CHD events/decade (∼4 CHD/decade) compared to previous                        with the highest amplitude over Fennoscandia and the
  decades, with a special focus on the central and south-eastern                north-western part of Russia, and loadings of opposite
  part of Europe. The increase in the number of CHD events                      sign (but smaller in amplitude) over the Balkans. The
  over the south-eastern part of Europe is mainly due to an                     years with the most severe CHDs over Fennoscandia,
  increase in the frequency of heatwaves over this region (∼0.20                as capture by the temporal evolution of PC1, were:
  events/decade), as well as due to an increase in the duration                 1955, 1959, 1975, 1997, and 2006, respectively. Summer
  of the heatwaves (∼2 days/decade). In the case of the SPI3, no                1955 stands out as the driest one on record over large
  significant changes at European level have been observed over                 regions covering Fennoscandia and the western part
  the last ∼70 years (Figures 2, 3).                                            of Russia.

Frontiers in Climate | www.frontiersin.org                               16                                        June 2021 | Volume 3 | Article 688991
Ionita et al.                                                                                                                                    Hot and Dry Summers Europe

• The second mode of variability, represents the spatio-temporal                              atmospheric system. The high-pressure system acts as a
  CHDs variability over central Europe, with the highest                                      barrier, preventing low-pressure systems from moving
  amplitude over Germany. The years with the most severe                                      over Europe and pushing them instead to the north. The
  CHDs over central Europe, as captured by the temporal                                       predominance of anticyclonic atmospheric circulation
  evolution of PC2, were: 1976, 2003, 2015, 2018, and 2019,                                   regimes seems to be a prerequisite for the development of very
  respectively. All these years were characterized by long lasting                            dry and warm summers.
  drought and record breaking temperatures in central Europe
                                                                                           The present study improves our understanding of the spatio-
  (Schär et al., 2004; Rodda and Marh, 2011; Ionita et al.,
                                                                                           temporal variability of hot and dry summers, at European level,
  2017, 2020a; Bakke et al., 2020; Ionita and Nagavciuc, 2020).
                                                                                           as well as the driving mechanisms of these events. The decadal
  Summer 2003 ranks as the hottest one on record over
                                                                                           changes observed over the last ∼70 years in the frequency of
  northern Spain, France, southern Germany, and large parts
                                                                                           CHDs and the fact that over the last decade central Europe seems
  of Italy, while summer 2015 ranks as the driest one on
                                                                                           to become a hot spot of CHDs could potentially help the decision-
  record over the eastern part of Austria, the eastern part
                                                                                           makes to develop more appropriate mitigation strategies. The
  of Poland, the western part of Ukraine and eastern part
                                                                                           results of this study are particularly useful for CHD impact
  of Belarus.
                                                                                           assessment on health risk, energy demands, and agriculture,
• The third mode of variability is concentrated mainly over
                                                                                           among others, that are often neglected by the decision-makers
  the south-eastern part of Europe, with the highest loadings
                                                                                           and stakeholders.
  over Romania, Bulgaria, Hungary, Serbia, and Croatia. The
  driest and warmest summers over the south-eastern part of
  Europe, based on the temporal evolution of summer PC3,                                   DATA AVAILABILITY STATEMENT
  were recorded for the years 1950, 1955, 1980, 1998, 2000,
                                                                                           The original contributions presented in the study are included
  2003, 2006, and 2012. Summer 2012 ranks as the hottest on
                                                                                           in the article/Supplementary Material, further inquiries can be
  record over large areas in the south-eastern part of Europe,
                                                                                           directed to the corresponding author.
  where up to 32 days/season with extremely high temperatures
  were recorded.
• Hot and dry summers are, in general, associated with a                                   AUTHOR CONTRIBUTIONS
  persistent high-pressure system over the regions affected by
  CHDs. CHDs over Fennoscandia are associated with a Z500                                  MI designed the study and wrote the paper. DC and VN helped
  pattern resembling the Scandinavian blocking pattern (van                                write the paper and interpret the results. All authors contributed
  der Wiel et al., 2019), characterized by a high-pressure system                          to the article and approved the submitted version.
  centered over Fennoscandia, which in turns reduces the
  zonal flow and diverts the storm tracks southward. CHDs                                  FUNDING
  over the central part of Europe, are usually associated with
  a Rossby wave-train which propagates from the USA to                                     MI was supported by Helmholtz Association through the
  Russia. High frequency of CHDs over the southern part of                                 joint program Changing Earth–Sustaining our Future (PoF IV)
  Europe are associated with a wave train, in the summer                                   program of the AWI. Funding by the AWI Strategy Fund
  Z500 field, characterized by negative Z500 anomalies over                                Project–PalEX and by the Helmholtz Climate Initiative–REKLIM
  central North Atlantic Ocean, positive Z500 anomalies over                               is gratefully acknowledged. VN was supported partially by project
  the south-eastern part of Europe coupled to another center of                            number PN-III-P1-1.1-PD-2019-0469.
  positive Z500 anomalies over Fennoscandia and negative Z500
  anomalies over western Russia.                                                           SUPPLEMENTARY MATERIAL
• Overall, the positive Z500 anomalies associated with each
  mode of variability largely suppresses ascending motions,                                The Supplementary Material for this article can be found
  reduces water vapor condensation and precipitation                                       online at: https://www.frontiersin.org/articles/10.3389/fclim.
  formation, leading to drought conditions below this                                      2021.688991/full#supplementary-material

REFERENCES                                                                                 Ben-Ari, T., Boé, J., Ciais, P., Lecerf, R., Van Der Velde, M., and Makowski, D.
                                                                                              (2018). Causes and implications of the unforeseen 2016 extreme yield loss in the
Bakke, S. J., Ionita, M., and Tallaksen, L. M. (2020). The 2018 Northern European             breadbasket of France. Nat. Commun. 9:1627. doi: 10.1038/s41467-018-04087-x
   hydrological drought and its drivers in a historical perspective. Hydrol. Earth         Bezak, N., and Mikoš, M. (2020). Changes in the compound drought and extreme
   Syst. Sci. 24, 5621–5653. doi: 10.5194/hess-24-5621-2020                                   heat occurrence in the 1961–2018 period at the European scale. Water 12:3543.
Barriopedro, D., Fischer, E. M., Luterbacher, J., Trigo, R. M., and García-Herrera,           doi: 10.3390/w12123543
   R. (2011). The hot summer of 2010: redrawing the temperature record map of              Bueh, C., and Nakamura, H. (2007). Scandinavian pattern and its climatic impact.
   Europe. Science 332, 220–224. doi: 10.1126/science.1201224                                 Q. J. R. Meteorol. Soc. 133, 2117–2132. doi: 10.1002/qj.173
Barriopedro, D., García-Herrera, R., and Trigo, R. M. (2010). Application of               Ciais, P., Reichstein, M., Viovy, N., Granier, A., Ogée, J., Allard, V., et al. (2005).
   blocking diagnosis methods to general circulation models. Part I: a novel                  Europe-wide reduction in primary productivity caused by the heat and drought
   detection scheme. Clim. Dyn. 35, 1373–1391. doi: 10.1007/s00382-010-0767-5                 in 2003. Nature 437, 529–533. doi: 10.1038/nature03972

Frontiers in Climate | www.frontiersin.org                                            17                                                 June 2021 | Volume 3 | Article 688991
Ionita et al. Hot and Dry Summers Europe Cornes, R. C., van der Schrier, G., van den Besselaar, E. J. M., and Jones, P. D. Leonard, M., Westra, S., Phatak, A., Lambert, M., van den Hurk, B., McInnes, (2018). An ensemble version of the E-OBS temperature and precipitation data K., et al. (2014). A compound event framework for understanding extreme sets. J. Geophys. Res. Atmos. 123, 9391–9409. doi: 10.1029/2017JD028200 impacts. WIREs Clim. Change 5, 113–128. doi: 10.1002/wcc.252 Della-Marta, P. M., Luterbacher, J., von Weissenfluh, H., Xoplaki, E., Brunet, Manning, C., Widmann, M., Bevacqua, E., Van Loon, A. F., Maraun, D., and Vrac, M., and Wanner, H. (2007). Summer heat waves over western Europe 1880- M. (2018). Soil moisture drought in Europe: a compound event of precipitation 2003, their relationship to large-scale forcings and predictability. Clim. Dyn. 29, and potential evapotranspiration on multiple time scales. J. Hydrometeorol. 19, 251–275. doi: 10.1007/s00382-007-0233-1 1255–1271. doi: 10.1175/JHM-D-18-0017.1 Diffenbaugh, N. S., Singh, D., Mankin, J. S., Horton, D. E., Swain, D. L., Manning, C., Widmann, M., Bevacqua, E., Van Loon, A. F., Maraun, D., and Touma, D., et al. (2017). Quantifying the influence of global warming on Vrac, M. (2019). Increased probability of compound long-duration dry and hot unprecedented extreme climate events. Proc. Natl. Acad. Sci. U.S.A. 114, events in Europe during summer (1950–2013). Environ. Res. Lett. 14:094006. 4881–4886. doi: 10.1073/pnas.1618082114 doi: 10.1088/1748-9326/ab23bf Feng, S., Wu, X., Hao, Z., Hao, Y., Zhang, X., and Hao, F. (2020). A database for McKee, T. B., Nolan, J., and Kleist, J. (1993). “The relationship of drought characteristics and variations of global compound dry and hot events. Weather frequency and duration yo time scales,” in Eighth Conference on Applied Clim. Extrem. 30:100299. doi: 10.1016/j.wace.2020.100299 Climatology 17–22 January 1993 (Anaheim, CA), 1–6. Fischer, E. M., Seneviratne, S. I., Lüthi, D., and Schär, C. (2007). Contribution of Mueller, B., and Seneviratne, S. I. (2012). Hot days induced by precipitation land-atmosphere coupling to recent European summer heat waves. Geophys. deficits at the global scale. Proc. Natl. Acad. Sci. U.S.A. 109, 12398–12403. Res. Lett. 34:L06707. doi: 10.1029/2006GL029068 doi: 10.1073/pnas.1204330109 Geirinhas, J. L., Russo, A., Libonati, R., Sousa, P. M., Miralles, D. G., and Mukherjee, S., and Mishra, A. K. (2021). Increase in compound drought Trigo, R. M. (2021). Recent increasing frequency of compound summer and heatwaves in a warming world. Geophys. Res. Lett. 48:e2020GL090617. drought and heatwaves in Southeast Brazil. Environ. Res. Lett. 16:034036. doi: 10.1029/2020GL090617 doi: 10.1088/1748-9326/abe0eb Munich RE (2020). Heatwaves, Drought, and Forest Fires in Europe: Billions of Hao, Z., Hao, F., Xia, Y., Singh, V. P., and Zhang, X. (2019). A monitoring Dollars in Losses for Agricultural Sector. Munich: Munich Re. and prediction system for compound dry and hot events. Environ. Res. Lett. Najibi, N., Devineni, N., Lu, M., and Perdigão, R. A. P. (2019). Coupled flow 14:114034. doi: 10.1088/1748-9326/ab4df5 accumulation and atmospheric blocking govern flood duration. Npj Clim. Hersbach, H., Bell, B., Berrisford, P., Hirahara, S., Horányi, A., Muñoz-Sabater, J., Atmos. Sci. 2:19. doi: 10.1038/s41612-019-0076-6 et al. (2020). The ERA5 global reanalysis. Q. J. R. Meteorol. Soc. 146, 1999–2049. North, G. R., Bell, T. L., Cahalan, R. F., and Moeng, F. J. (1982). Sampling doi: 10.1002/qj.3803 errors in the estimation of empirical orthogonal functions. Mon. Weather Rev. Hirschi, M., Seneviratne, S. I., Alexandrov, V., Boberg, F., Boroneant, C., 110, 699–706. Christensen, O. B., et al. (2011). Observational evidence for soil-moisture Perkins, S. E., and Alexander, L. V. (2013). On the measurement of heat waves. J. impact on hot extremes in southeastern Europe. Nat. Geosci. 4, 17–21. Clim. 26, 4500–4517. doi: 10.1175/JCLI-D-12-00383.1 doi: 10.1038/ngeo1032 Raymond, C., Horton, R. M., Zscheischler, J., Martius, O., AghaKouchak, A., Balch, Hori, M. E., Inoue, J., Kikuchi, T., Honda, M., and Tachibana, Y. (2011). J., et al. (2020). Understanding and managing connected extreme events. Nat. Recurrence of intraseasonal cold air outbreak during the 2009/2010 winter in Clim. Change 10, 611–621. doi: 10.1038/s41558-020-0790-4 Japan and its ties to the atmospheric condition over the Barents-Kara Sea. Sola Ridder, N. N., Pitman, A. J., Westra, S., Ukkola, A., Do, H. X., Bador, M., et al. 7, 25–28. doi: 10.2151/sola.2011-007 (2020). Global hotspots for the occurrence of compound events. Nat. Commun. Ionita, M., Boronean,?, C., and Chelcea, S. (2015). Seasonal modes of dryness 11:5956. doi: 10.1038/s41467-020-20502-8 and wetness variability over Europe and their connections with large scale Rimbu, N., Lohmann, G., and Ionita, M. (2014). Interannual to multidecadal atmospheric circulation and global sea surface temperature. Clim. Dyn. 45, Euro-Atlantic blocking variability during winter and its relationship with 2803–2829. doi: 10.1007/s00382-015-2508-2 extreme low temperatures in Europe. J. Geophys. Res. Atmos. 119, 13621–13636. Ionita, M., Dima, M., Nagavciuc, V., Scholz, P., and Lohmann, G. (2021). doi: 10.1002/2014JD021983 Past megadroughts in central Europe were longer, more severe, and Rodda, J., and Marh, T. (2011). The 1975-76 Drought–A Contemporary and less warm than modern droughts. Commun. Earth Environ. 2:61. Retrospective Review. Bailrigg: Centre for Ecology and Hydrology doi: 10.1038/s43247-021-00130-w Russo, A., Gouveia, C. M., Dutra, E., Soares, P. M. M., and Trigo, R. M. (2019). The Ionita, M., Lohmann, G., Rimbu, N., Chelcea, S., and Dima, M. (2012). synergy between drought and extremely hot summers in the Mediterranean. Interannual to decadal summer drought variability over Europe and its Environ. Res. Lett. 14:014011. doi: 10.1088/1748-9326/aaf09e relationship to global sea surface temperature. Clim. Dyn. 38, 363–377. Samaniego, L., Thober, S., Kumar, R., Wanders, N., Rakovec, O., Pan, M., et al. doi: 10.1007/s00382-011-1028-y (2018). Anthropogenic warming exacerbates European soil moisture droughts. Ionita, M., and Nagavciuc, V. (2020). Forecasting low flow conditions months in Nat. Clim. Change 8, 421–426. doi: 10.1038/s41558-018-0138-5 advance through teleconnection patterns, with a special focus on summer 2018. Schär, C., Vidale, P. L., Lüthi, D., Frei, C., Häberli, C., Liniger, M. A., et al. (2004). Sci. Rep. 10:13258. doi: 10.1038/s41598-020-70060-8 The role of increasing temperature variability in European summer heatwaves. Ionita, M., and Nagavciuc, V. (2021). Changes in drought features at European Nature 427, 332–336. doi: 10.1038/nature02300 level over the last 120 years. Nat. Hazards Earth Syst. Sci. Discuss. 2021, 1–31. Schubert, S. D., Stewart, R. E., Wang, H., Barlow, M., Berbery, E. H., Cai, W., et al. doi: 10.5194/nhess-2021-46 (2016). Global meteorological drought: a synthesis of current understanding Ionita, M., Nagavciuc, V., and Guan, B. (2020b). Rivers in the sky, flooding on with a focus on sst drivers of precipitation deficits. J. Clim. 29, 3989–4019. the ground: the role of atmospheric rivers in inland flooding in central Europe. doi: 10.1175/JCLI-D-15-0452.1 Hydrol. Earth Syst. Sci. 24, 5125–5147. doi: 10.5194/hess-24-5125-2020 Schubert, S. D., Wang, H., Koster, R. D., Suarez, M. J., and Groisman, P. Y. Ionita, M., Nagavciuc, V., Kumar, R., and Rakovec, O. (2020a). On the curious case (2014). Northern Eurasian heat waves and droughts. J. Clim. 27, 3169–3207. of the recent decade, mid-spring precipitation deficit in central Europe. Npj doi: 10.1175/JCLI-D-13-00360.1 Clim. Atmos. Sci. 3:49. doi: 10.1038/s41612-020-00153-8 Seneviratne, S. I., Nicholls, N., Easterling, D., Goodess, C. M., Kanae, S., Kossin, Ionita, M., Tallaksen, L. M., Kingston, D. G., Stagge, J. H., Laaha, G., Lanen, H. A. J., et al. (2012). “Changes in climate extremes and their impacts on the natural J., et al. (2017). The European 2015 drought from a climatological perspective. physical environment,” in Managing the Risks of Extreme Events and Disasters Hydrol. Earth Syst. Sci. 21, 1397–1419. doi: 10.5194/hess-21-1397-2017 to Advance Climate Change Adaptation: Special Report of the Intergovernmental Kattsov, V. M., Källén, E., Cattle, H., Christensen, J., Drange, H., Hanssen-Bauer, Panel on Climate Change, eds C. B. Field, Q. Dahe, T. F. Stocker, and V. Barros I., et al. (2005). “Chapter 4, future climate change: modeling and scenarios (Cambridge: Cambridge University Press), 109–230. for the Arctic,” in Arctic Climate Impact Assessment (Cambridge: Cambridge Trenberth, K. E., and Shea, D. J. (2005). Relationships between University Press), 1042. Available online at: http://www.acia.uaf.edu precipitation and surface temperature. Geophys. Res. Lett. 32:L14703. Kong, Q., Guerreiro, S. B., Blenkinsop, S., Li, X.-F., and Fowler, H. J. (2020). doi: 10.1029/2005GL022760 Increases in summertime concurrent drought and heatwave in Eastern China. van der Wiel, K., Bloomfield, H. C., Lee, R. W., Stoop, L. P., Blackport, R., Weather Clim. Extrem. 28:100242. doi: 10.1016/j.wace.2019.100242 Screen, J. A., et al. (2019). The influence of weather regimes on European Frontiers in Climate | www.frontiersin.org 18 June 2021 | Volume 3 | Article 688991
Ionita et al.                                                                                                                                      Hot and Dry Summers Europe

   renewable energy production and demand. Environ. Res. Lett. 14:094010.                  Zhang, R. R., Sun, C., Zhu, J., Zhang, R. R., and Li, W. (2020). Increased European
   doi: 10.1088/1748-9326/ab38d3                                                              heat waves in recent decades in response to shrinking Arctic sea ice and
Vicente-Serrano, S. M., Domínguez-Castro, F., Murphy, C., Hannaford, J., Reig,                Eurasian snow cover. Npj Clim. Atmos. Sci. 3:7. doi: 10.1038/s41612-020-0110-8
   F., Peña-Angulo, D., et al. (2021). Long-term variability and trends in                 Zscheischler, J., Westra, S., van den Hurk, B. J. J. M., Seneviratne, S. I., Ward, P. J.,
   meteorological droughts in Western Europe (1851–2018). Int. J. Climatol. 41,               Pitman, A., et al. (2018). Future climate risk from compound events. Nat. Clim.
   E690–E717. doi: 10.1002/joc.6719                                                           Change 8, 469–477. doi: 10.1038/s41558-018-0156-3
Vogel, M. M., Zscheischler, J., Wartenburger, R., Dee, D., and Seneviratne,
   S. I. (2019). Concurrent 2018 hot extremes across northern hemisphere                   Conflict of Interest: The authors declare that the research was conducted in the
   due to human-induced climate change. Earth’s Futue 7, 692–703.                          absence of any commercial or financial relationships that could be construed as a
   doi: 10.1029/2019EF001189                                                               potential conflict of interest.
Von Buttlar, J., Zscheischler, J., Rammig, A., Sippel, S., Reichstein,
   M., Knohl, A., et al. (2018). Impacts of droughts and extreme-                          Copyright © 2021 Ionita, Caldarescu and Nagavciuc. This is an open-access article
   temperature events on gross primary production and ecosystem                            distributed under the terms of the Creative Commons Attribution License (CC BY).
   respiration: a systematic assessment across ecosystems and climate                      The use, distribution or reproduction in other forums is permitted, provided the
   zones.     Biogeosciences   15,    1293–1318.        doi:     10.5194/bg-15-129         original author(s) and the copyright owner(s) are credited and that the original
   3-2018                                                                                  publication in this journal is cited, in accordance with accepted academic practice.
von Storch, H., and Zwiers, F. W. (1999). Statistical Analysis in Climate Research.        No use, distribution or reproduction is permitted which does not comply with these
   Cambridge: Cambridge University Press.                                                  terms.

Frontiers in Climate | www.frontiersin.org                                            19                                                  June 2021 | Volume 3 | Article 688991
Table S1. Description of the affected regions and associated impact for six extreme CHDs: 1950, 1959,
 2003, 2012 and 2015.
1950   Anomalously dry summer characterized also by high temperatures in central Europe (Briffa et al., 2009); The
       longest and one of the most severe droughts over European Russia; Rainfall deficit at Pan-European level
       (Spinoni et al., 2015)
1955   The longest drought event in Fennoscandia; the most affected area was the Northern Europe (Spinoni et al.,
       2015); Reduced productivity of annual crop cultivation: crop losses, damage to crop quality or crop failure
       due to dieback, premature ripening, drought-induced pest infestations or diseases, reduced productivity of
       livestock farming (e.g. reduced yields or quality of milk, reduced stock weights) and increased costs/economic
       losses in Scandinavia (EDC, 2012)
1959   The most severe drought in Fennoscandia, the most affected area was the northern and eastern part of Europe
       (Spinoni et al., 2015); Reduced productivity of annual crop cultivation: crop losses, damage to crop quality
       or crop failure due to dieback, premature ripening, drought-induced pest infestations or diseases, in
       Northern/Central Europe, reduced productivity of livestock farming in Northern/Central Europe, increased
       costs/economic losses (458 million euros in Nederland), reduced tree growth and vitality, local water supply
       shortage / problems (drying up of springs/wells, reservoirs, streams), limitations in water supply to households
       in rural areas, (temporary) water quality deterioration/problems of surface waters, increased mortality of
       aquatic species, increased burned area, increased number of wildfires (EDC, 2012)
2003   Severe drought from May to September (EDC, 2013); The most affected areas were central France and eastern
       Austria (Laaha et al., 2017); Air temperatures were extremely abnormal with monthly anomalies of up to 6
       ◦C in a large part of Europe (Rebetez et al., 2006), over 100 million affected people (EU, 2010) and direct
       economic impacts of 17.134 billion Euro (EEA, 2019); Local limitations and serious shortage problems in
       public water, decreased the quantity and quality of the harvests, particularly in Central and Southern European
       agricultural areas; important loss of crops more than 25 000 fires were recorded in Portugal, Spain, Italy,
       France, Austria, Finland, Denmark and Ireland; the estimation of forest areas destroyed reached 647 069
       hectares; decrease in nuclear power production and water use restrictions in 75 % of the French departments;
       local limitations and serious shortage problems in public water supply (UNEP, 2003);
2012   Severe drought in Romania, grain production fell by almost 40% in Romania, but also in Bulgaria and
       Hungary (Pana, 2013); Economic costs due to climatological events : 3.909 million Euro (EEA, 2019); In
       July 2012 there were 16 consecutive days of heat, rainfall deficit, almost the whole month of July with an
       average temperature of over 32°C; in some regions in Romania, the crop production loss was ~97%
       (Pavnutescu, 2012); Several localities were left without drinking water due to the prolonged drought, the
       authorities restricting consumption and transported water by tankers for the population and animals
       (economica.net, 2012a); Temperatures repeatedly exceeded 35ᵒC in July, from eastern Italy to the Black Sea
       region and even Ukraine, mean temperature was with about 5 degrees above normal for this period
       (economica.net, 2012b); In the Republic of Moldova the drought has strained the situation of the cereals
       market, there has been an increase in market prices of wheat, corn and other cereals, the drought caused a
       economic crisis (point.md, 2012);
2015   In France, Benelux, western Germany, northern Italy, northern Spain, the Czech Republic, Poland, Ukraine
       and Belarus the rainfall deficit was greater than 100-130 mm, representing a reduction of about 50-60%, and
       in some cases even 80%, compared to the long-term average (EDO, 2015); Almost 75% of the area of
       Germany was under at least moderate drought in July 2015 (Ionita et al., 2017); Maximum daily temperatures
       consistently above 30°C for durations of 30 to 35 days (DG Environment – European Commission, 2007);
       The most affected areas were the central and eastern part of Europe and the northern Balkans (Laaha et al.,
       2017); Restrictions to civil and industrial water uses, losses in agricultural production reductions or even the
       complete cessation of inland water transportation, increases in forest wildfires, impacts on forestry (e.g.
       reduced biomass accumulation, insect attacks and diseases), limitations to energy production (hydropower
       and cooling) (EDO, 2015), Direct economic impacts 2.172 billion Euro (EEA, 2019) and ∼1250 related deaths
       (Munich RE, 2020); Crop losses of up to 50% were reported in the Czech Republic, Germany, Poland and
       Slovakia, across central Europe and parts of eastern Europe (e.g. Romania) hundreds of towns and villages
       faced drinking water supply deficiencies (Van Lanen et al., 2016).
References: Briffa, K. R., van der Schrier, G. and Jones, P. D.: Wet and dry summers in europe since 1750: Evidence of increasing drought, International Journal of Climatology, 29(13), doi:10.1002/joc.1836, 2009. DG Environment – European Commission: Water Scarcity and Droughts in-depth assessment Second Interim Report – June 2007, The European Commission [online] Available from: https://ec.europa.eu/environment/water/quantity/pdf/comm_droughts/2nd_int_report.pdf, 2007. economica.net: Seceta începe să lase populaţia din Vaslui fără apă potabilă. ISU intervine în zonele afectate, economica.net [online] Available from: https://www.economica.net/seceta-incepe-sa-lase- populatia-din-vaslui-fara-apa-potabila-isu-intervine-in-zonele-afectate_29975.html, 2012a. economica.net: Valul de căldură din Europa afectează grav recolta de porumb, în paralel cu seceta din SUA, economica.net [online] Available from: https://www.economica.net/valul-de-caldura-din-europa- afecteaza-grav-recolta-de-porumb-in-paralel-cu-seceta-din-sua_29780.html, 2012b. EDC: European Drought Impact Inventory Query, European Drought Centre [online] Available from: https://www.geo.uio.no/edc/droughtdb/edr/impactdatabaseresults.php, 2012. EDC: Drought of 2003, Europe, European Drought Centre [online] Available from: https://www.geo.uio.no/edc/droughtdb/edr/DroughtEvents/_2003_Event.php, 2013. EDO: Drought News August 2015, EDO Combined Drought Indicator (CDI) –Situation on 31 July 2015. [online] Available from: http://edo.jrc.ec.europa.eu, 2015. EEA: Economic losses from climate-related extremes in Europe — European Environment Agency, [online] Available from: https://www.eea.europa.eu/data-and-maps/indicators/direct-losses-from- weather-disasters-3, 2019. EU: Water Scarcity and Drought in the European Union, European Union Publication Office [online] Available from: https://ec.europa.eu/environment/pubs/pdf/factsheets/water_scarcity.pdf, 2010. Ionita, M., Tallaksen, L. M., Kingston, D. G., Stagge, J. H., Laaha, G., Van Lanen, H. A. J., Scholz, P., Chelcea, S. M., Haslinger, K., Lanen, H. A. J. Van, Chelcea, S. M., Haslinger, K., Scholz, P., Chelcea, S. M. and Haslinger, K.: The European 2015 drought from a climatological perspective, Hydrology and Earth System Sciences, 21, 1397–1419, doi:doi:10.5194/hess-21-1397-2017, 2017. Laaha, G., Gauster, T., Tallaksen, L. M., Vidal, J. P., Stahl, K., Prudhomme, C., Heudorfer, B., Vlnas, R., Ionita, M., Scholz, P., Van Lanen, H. A. J., Adler, M. J., Caillouet, L., Delus, C., Fendekova, M., Gailliez, S., Hannaford, J., Kingston, D., Van Loon, A. F., Mediero, L., Osuch, M., Romanowicz, R. J., Sauquet, E., Stagge, J. H. and Wong, W. K.: The European 2015 drought from a hydrological perspective, Hydrology and Earth System Sciences, 21(3), 3001–3024, doi:10.5194/hess-21-1397- 2017, 2017. Van Lanen, H. A. J., Laaha, G., Kingston, D. G., Gauster, T., Ionita, M., Vidal, J. P., Vlnas, R., Tallaksen, L. M., Stahl, K., Hannaford, J., Delus, C., Fendekova, M., Mediero, L., Prudhomme, C., Rets, E., Romanowicz, R. J., Gailliez, S., Wong, W. K., Adler, M. J., Blauhut, V., Caillouet, L., Chelcea, S., Frolova, N., Gudmundsson, L., Hanel, M., Haslinger, K., Kireeva, M., Osuch, M., Sauquet, E., Stagge, J. H. and Van Loon, A. F.: Hydrology needed to manage droughts: the 2015 European case, Hydrological Processes, 30(17), 3097–3104, doi:10.1002/hyp.10838, 2016. Munich RE: Heatwaves, drought and forest fires in Europe: Billions of dollars in losses for agricultural
You can also read