Fracture Analysis of α-Quartz Crystals Subjected to Shear Stress - MDPI
←
→
Page content transcription
If your browser does not render page correctly, please read the page content below
minerals
Article
Fracture Analysis of α-Quartz Crystals Subjected to
Shear Stress
Giovanni Martinelli 1,2,3, * , Paolo Plescia 4 , Emanuela Tempesta 4 , Enrico Paris 5
and Francesco Gallucci 5
 1   INGV Istituto Nazionale di Geofisica e Vulcanologia, Via Ugo La Malfa 153, 90146 Palermo, Italy
 2   Northwest Institute of Eco-Environment and Resources, Chinese Academy of Sciences,
     Lanzhou 730000, China
 3   Key Laboratory of Petroleum Resources, Lanzhou 730000, China
 4   CNR-IGAG, Institute of Environmental Geology and Geoengineering, Research area of Rome-1,
     00015 Monterotondo, Italy; ilplescia@gmail.com (P.P.); emanuela.tempesta@igag.cnr.it (E.T.)
 5   CREA-ING, Consiglio per la Ricerca in Agricoltura e l’Analisi dell’Economia Agraria, Unità di Ricerca per
     l’Ingegneria Agraria, 00015 Monterotondo, Italy; enrico.paris@crea.gov.it (E.P.);
     francesco.gallucci@crea.gov.it (F.G.)
 *   Correspondence: giovanni.martinelli15@gmail.com

 Received: 18 July 2020; Accepted: 29 September 2020; Published: 30 September 2020

 Abstract: This study assesses the correlations between the intensity of stress undergone by crystals
 and the morphological characteristics of particles and fracturing products. The effects of the fractures
 on the microstructure of quartz are also studied. Alpha quartz, subjected to shear stress, is quickly
 crushed according to a fracturing sequence, with a total fracture length that is correlated to the stress
 rate. The shear stress generates a sequence of macro and microstructural events, in particular localized
 melting phenomena, never highlighted before on quartz and the formation of different polymorphs,
 such as cristobalite and tridymite together with amorphous silica.

 Keywords: quartz; shear stress; tribochemistry; fracturing

1. Introduction
      The possibility that fractured quartz turns into cristobalite and tridymite poses serious problems
in the safe management of industrial milling. In the last twenty years, numerous laboratories have
sprung up all over the world conducting experiments on rocks in the conditions of friction typical of
technologies utilized in rock grinding. To a large extent, these experiments are carried out trying to
correlate the friction coefficient with stress (tangential and normal), the speed and the spaces covered
by the simulated fault [1,2]. At the same time, attention has grown towards the “dynamometamorphic”
phenomena suffered by rocks and linked to stress: heating, gas dissociation, partial or total melting of
the friction layers. In the recent past, several working groups have focused their attention on the role
of quartz in the sliding phenomena of rocks, and the idea is that the heating of the contact surface by
friction produces a partial melting of the material, the formation of a silica layer amorphous which is
quickly hydrated by ambient moisture, which thus becomes a lubricating gel that drastically reduces
the friction coefficient of the defects [3,4]. In a recent publication, we formulated another hypothesis
to explain the lowering of the coefficient of friction in experiments on quartz-containing rocks. This
hypothesis is based on the progressive formation of nanocrystalline cristobalite, which works as a
solid lubricant [5,6]. The silica polymorph called cristobalite has the particularity of being an auxetic
material, i.e., with a negative Poisson ratio, both in the form of low temperature (alpha) and in that of
high temperature (beta). If a layer of cristobalite is found in shear conditions, it can reduce its contact
area as a result of the volume contraction and equally reduces the friction coefficient.

Minerals 2020, 10, 870; doi:10.3390/min10100870                                  www.mdpi.com/journal/minerals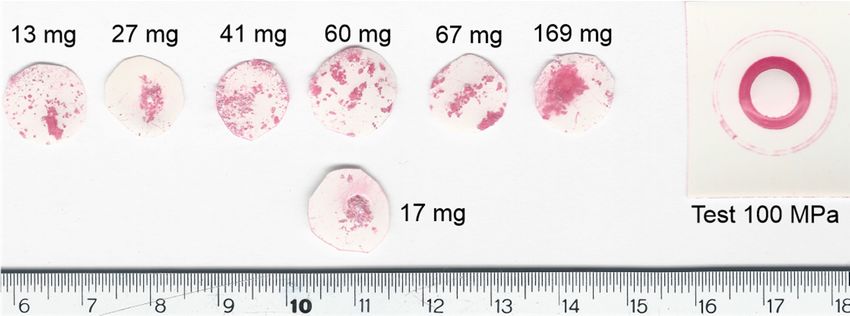
Minerals 2020, 10, 870                                                                               2 of 18

     The hypothesis is that quartz, subjected to a prolonged reticular distortion over time, tends to take
on a structure with ever greater disturbance, but formed by cristobalite nanophases. This phase would
be nanocrystalline, not visible by X diffraction but visible by Raman spectroscopy. The accumulation
of this phase in the interface between the sliding surfaces would cause the friction coefficient to decay
more or less rapidly, depending on the intensity of the dynamometamorphic action [6]. Furthermore,
quartz’s structural decay is marked by the decay of the electromagnetic signals generated by its
fracturing, which diminishes over time as fracturing and damage of the original crystalline structure
proceed [5,6]. A key element is missing in this theory: how and when the patina of cristobalite is
generated. The purpose of present work is to contribute to a better understanding of the processes
related to quartz tribochemistry.

2. Experimental Procedure
      The task of this experimental work is to understand the mechanisms that link the progressive
demolition of the crystal structure of quartz and the appearance of polymorphic phases during the
application of sliding stresses. In two previous works [5,6], the authors of this work reported details
on the polymorphic phases of silica that are formed during fracturing and on the correlations between
fractures and the amount of very low frequency electromagnetic energy emitted by the crystals during
the fracturing.
      An innovative “piston cylinder” was used to carry out these studies. It is equipped with two
steel pistons which compress the sample and which represent the armatures of a condenser, equipped
with an insulating Teflon jacket, which allows the containment of the material. Thanks to Teflon, the
pressure distribution exerted is anisotropic, and this is due to the materials that make up the cell
itself. The materials that exert the pressure (stainless steel) and the containment material (Teflon)
are different in terms of elasticity, coefficient of Poisson and compressive strength. This determines
a condition of anisotropy in the exercise of compression: the mineral is not subjected to equal
stresses in all directions, but greater according to the direction of the piston and less in the directions
perpendicular to it. This anisotropy allows one to create a fracturing system by shear, which generates
fractures favoring the development of a network of microcracks. The entire piston cylinder is first
evacuated and subsequently subjected to an analytical grade nitrogen flow to ensure an anhydrous
atmosphere. The system was created taking into account similar systems published in the past by
various authors [7–10]. The pressure is applied through a motorized hydraulic press, which develops
a maximum load of 4.9 kN.
      The quartz-α samples come from natural quartz crystals, purchased at Ward (Ward, West Henrietta,
NY, USA; www.wardsci.com), previously analyzed in optical microscopy to detect any defects, such as
inclusions and fractures. The crystals were chosen in the weight range from 0.05 to 1.5 g. Each test
generated powders and fragments that were analyzed for shape, size, area and volume, through the
new Morphology G3ID image analysis system (Malvern, UK) based on optical scanning microscopy.
The automated scanning system allows one to measure and analyze about 1 million particles per hour
and to know the values of the perimeter, area and volume of each particle, from 300 µm to 1 µm. This
scanning microscope has already been used previously by the authors for investigations on asbestos
fibers in soils and recently on quartz crystals [5,6]. To determine the morphologies, the particles are
dispersed on the surface of the optical plate. Scanning takes place at constant magnification on all
particles following an x-y scanning mechanism; the depth of the particles is reconstructed through the
“z-stacking” mechanism that allows one to shoot the same image of the particle on different focal planes.
      In this work, we used the data of the optical scan to estimate the quantities of “new” surfaces
generated by the fracture, the statistics on morphologies (equivalent diameter, area for every particle).
These data were compared to the entity of the stress rate. The calculation of the real volume deserves
special mention. The instrument software measures the volume by the diameter equivalent to the
sphere (SE Volume), but this value is very far from reality. Therefore, we used an algorithm that
is based on the measurement of the attenuation of the intensity of light transmitted by the particle.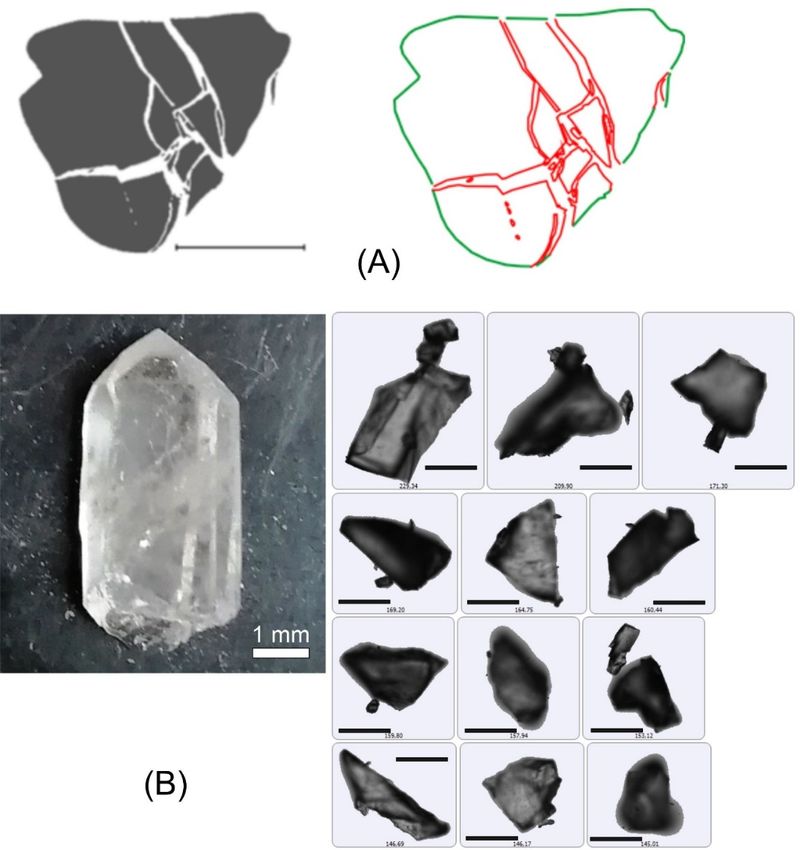
Minerals 2020, 10, 870                                                                                                    3 of 18

     Minerals 2020, 10, x FOR PEER REVIEW                                                                              3 of 18
For non-scattering media, the Beer–Lambert law (BL, or absorption law) is well recognized to describe
     that is basedbetween
the relationship   on the measurement
                          transmittanceofand
                                          the sample
                                               attenuation of theas:
                                                      thickness   intensity of light transmitted by the
     particle. For non-scattering media, the Beer–Lambert law (BL, or absorption law) is well recognized
                                               T = exp(−µ
     to describe the relationship between transmittance anda d)
                                                             sample thickness as:                        (1)
                                                        T= exp(−μad)
where T is the transmittance, d is the sample thickness, and µa is the absorption coefficient (cm−1 ).
                                                                                                                         (1)

Thiswhere
      expression
            T is the istransmittance,
                        based on the random        naturethickness,
                                        d is the sample    of stochastic
                                                                     and μlight    absorption,
                                                                             a is the absorptioncharacterized
                                                                                                  coefficient (cmby −1).the
                                                                                                                         Thisrate
constant  µa . Since
     expression    is based    on the random
                        the transmitted    lightnature    of stochastic
                                                  intensity  is measured light
                                                                             forabsorption,    characterized
                                                                                  each particle,  and since we  by are
                                                                                                                    the always
                                                                                                                         rate
     constant  μ   . Since   the transmitted    light  intensity is measured       for each    −1
                                                                                             particle,
in the presence of quartz, which has an absorption coefficient from 664 cm at 450 nm to 312 cm
                 a                                                                                      and   since  we     −1 at
                                                                                                                          are
     always  in the    presence  of quartz,   which   has an  absorption   coefficient   from  664 cm  −1 at 450 nm to 312
650 nm [10], the thickness “d” can be derived for all particles. Figure 1A shows the effect of fracturing
     cm−1 atgrains;
on quartz    650 nmthe   [10], the thickness
                            images   have been “d” modified
                                                    can be derived
                                                               after for
                                                                     Zhao,all particles.  Figure
                                                                               B. et al. [11].  On1A
                                                                                                   theshows    the can
                                                                                                         left, we  effectseeofthe
     fracturing on quartz grains; the images have been modified after Zhao, B. et al. [11]. On the left, we
two-dimensional projection of the particles obtained from the compression fracturing of a quartz grain.
     can see the two-dimensional projection of the particles obtained from the compression fracturing of
The perimeter of the granule, obtained from the two-dimensional projection, is expressed in green.
     a quartz grain. The perimeter of the granule, obtained from the two-dimensional projection, is
The perimeters of the projections of the individual particles obtained from the fracturing are indicated
     expressed in green. The perimeters of the projections of the individual particles obtained from the
in red.  In Figure
     fracturing  are 1B,   images
                       indicated  in of the
                                     red. In original
                                              Figure 1B,crystal,
                                                          imagesaoftip
                                                                     theweighing       207 mg
                                                                          original crystal,     and
                                                                                             a tip   some of207
                                                                                                   weighing      themgparticles
                                                                                                                         and
obtained   from   the   fracturing   can   be  observed.
     some of the particles obtained from the fracturing can be observed.

           Figure
      Figure       1. (A)
               1. (A)     Breakage
                       Breakage   of of a grain:ononthe
                                      a grain:       theleft,
                                                         left,projection
                                                               projection images
                                                                          images of
                                                                                 ofparticles
                                                                                    particlescreated
                                                                                              createdbyby
                                                                                                        thethe
                                                                                                             breaking of of
                                                                                                                breaking
           first grain; on the right, original perimeter   (green)  and  new perimeter (red). (B) On the left,
      first grain; on the right, original perimeter (green) and new perimeter (red). (B) On the left, the imagethe image
           of the original crystal fragment, 207 mg in weight; on the right, the 12 largest fragments of the left
      of the original crystal fragment, 207 mg in weight; on the right, the 12 largest fragments of the left
           crystal; each fragment of the crystal, from 0.3 mm to 1 μm, was analyzed from the morphological and
      crystal; each fragment of the crystal, from 0.3 mm to 1 µm, was analyzed from the morphological and
           dimensional point; in total, the left crystal produced over 320,000 fragments; the black barindicates
      dimensional point; in total, the left crystal produced over 320,000 fragments; the black barindicates
           150 μm
      150 µm.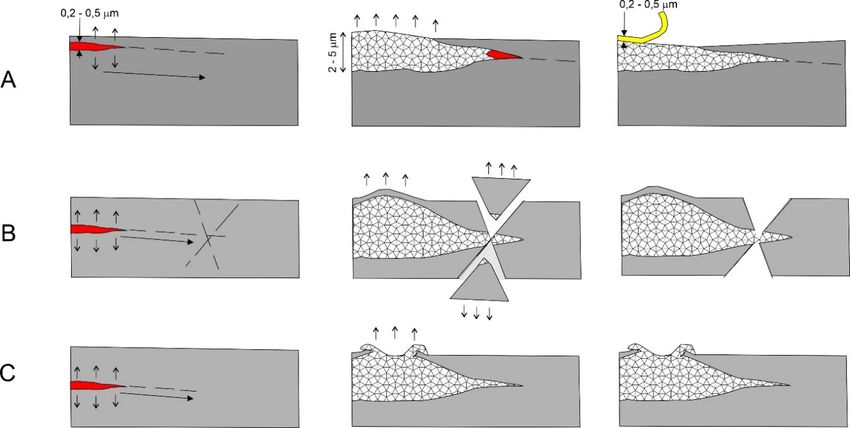
Minerals 2020,
Minerals 10, x870
2020, 10, FOR PEER REVIEW 44 of
of 18
18
The surfaces of the “internal” granules are, in fact, the new fracture surfaces, created when the
The surfaces of the “internal” granules are, in fact, the new fracture surfaces, created when the
imposed stress exceeds the critical stress level. The sum of the surfaces of the particles will be
imposed stress exceeds the critical stress level. The sum of the surfaces of the particles will be equivalent
equivalent to the sum of the new surfaces created by the fractures, Stot, plus the original surface. In
to the sum of the new surfaces created by the fractures, Stot , plus the original surface. In this way, it
this way, it is possible to calculate the total area created by the fractures. By extrapolating this concept,
is possible to calculate the total area created by the fractures. By extrapolating this concept, it is also
it is also possible to calculate the total length of the fractures. The total perimeter of all particles is
possible to calculate the total length of the fractures. The total perimeter of all particles is correlated
correlated with the total length of the fractures, minus the original perimeter of the crystal and the
with the total length of the fractures, minus the original perimeter of the crystal and the loss of data
loss of data due to the two-dimensional transposition of the three-dimensional particles. The latter
due to the two-dimensional transposition of the three-dimensional particles. The latter error is reduced
error is reduced if the particles analyzed by microscopy are in very large numbers. For this reason,
if the particles analyzed by microscopy are in very large numbers. For this reason, the analyses in
the analyses in morphology must be carried out on a high number of particles, usually above 100,000
morphology must be carried out on a high number of particles, usually above 100,000 particles.
particles.
In order to determine the nature of silica polymorphs, a Raman microprobe inserted in the
In order to determine the nature of silica polymorphs, a Raman microprobe inserted in the
Morphology G3ID was used, which uses a 785 nm laser with a spot of 2 microns in diameter.
Morphology G3ID was used, which uses a 785 nm laser with a spot of 2 microns in diameter. The
The Raman laser power is 40 mW.
Raman laser power is 40 mW.
To determine the stress to which the crystal is subjected, a measurement method was developed
To determine the stress to which the crystal is subjected, a measurement method was developed
using the image of the shattered crystal printed on a pressure sensitive film (Pressurex Inc., Madison,
using the image of the shattered crystal printed on a pressure sensitive film (Pressurex Inc., Madison,
NJ, USA; www.sensorprod.com). These films have an ink layer that produces a color, and the intensity
NJ, USA; www.sensorprod.com). These films have an ink layer that produces a color, and the
of which is proportional to pressure. Figure 2 shows the pressure marks left on the film by different
intensity of which is proportional to pressure. Figure 2 shows the pressure marks left on the film by
quartz crystals
different quartz crystals
Figure
Figure 2.
2. Images
Images of
ofthe
thefilms
filmsimpressed
impressed by
byseveral
severalcompressed
compressed crystals;
crystals; on
on the
theright,
right,aacalibration
calibrationtest.
test.
The numbers represent the weight of samples in
The numbers represent the weight of samples in mg.mg.
Finally, we used
Finally, we used scanning
scanning electron
electron microscopy
microscopy toto determine
determine the
the microscopic
microscopic characteristics
characteristics of
of
fractures
fractures at different stress levels (Zeiss EVO MA10, Zeiss Gmbh, Ulm, Germany). Thesamples
at different stress levels (Zeiss EVO MA10, Zeiss Gmbh, Germany). The samples to
to be
be
analyzed
analyzed ininthe
theSEM
SEMwerewere
leftleft in their
in their original
original condition,
condition, without
without cleaning,
cleaning, since on
since debris debris on the
the surfaces
surfaces of the granules can provide important
of the granules can provide important information. information.
3. Results
Results
3.1. Particle
3.1. Particle Size
Size Distributions
Distributions Related
Related to
to Stress
Stress Conditions
Conditions
The sizes
The sizes of
of the
the quartz
quartz particles
particles show
show complex
complex correlations
correlations with
with pressure
pressure undergone
undergone and
and linear
linear
correlations between
correlations between thethe rate
rate of
of increase
increase in
in pressure
pressure and
and the
the average
average size.
size.
The particle size curves (Figure 3) obtained from the tests show a distribution of
The particle size curves (Figure 3) obtained from the tests show a distribution of variable
variable shape:
shape:
•• For
Forparticles
particlesfrom
from samples
samples subjected
subjected to to a more intense stress
stress rate
rate (MPa·s
(MPa·s−1
−1), the distribution is
), the distribution
shifted
shiftedtowards
towardsthethelarger
largerparticles,
particles,and
andthethe shape
shape of
of the
the curve
curve isis monomodal.
monomodal.
•• For
For the particlesthat
the particles thathave
have undergone
undergone a slower
a slower pressure
pressure rate, rate, the particles
the particles have hadhave had
time time to
to fracture
fracture
more, andmore, and the distribution
the distribution is shifted is shiftedsmaller
towards towards smaller with
particles, particles, with curve
a bimodal a bimodal
shape.curve
shape.Minerals 2020, 10, 870 5 of 18
Minerals 2020, 10, x FOR PEER REVIEW 5 of 18
CE Diameter (µm) smoothed over 41 points
0.8
0.7
0.6
0.5
%
0.4
0.3
0.2
0.1
0.0
1 10 100
CE Diameter (µm)
Record 1: QCR 0.102 gr [1 of 4] Record 3: QCR 0.506 gr [3 of 4]
Record 8: QCR 0.154 gr [4 of 4] Record 14: QCR0.67097 area mag [2 of 4]
Record 15: QCR0.92789 area mag [3 of 4] Record 17: QRC 0.1714gr [1 of 4]
Record 23: QRC 0.512gr [3 of 4] Record 24: QRC 0.35gr [4 of 4]
Figure
Figure 3.
3. CE
CEdiameter
diameter distribution
distribution curves
curves ofof quartz
quartz particles
particles (the
(the meaning
meaning of
of CE
CEisis“circle
“circleequivalent”;
equivalent”;
the curves are obtained from the smoothing by average of 41 readings; the results are
the curves are obtained from the smoothing by average of 41 readings; the results are expressed expressedininx-y
x-
ygraphs
graphsand
andnotnotininhistograms,
histograms,dueduetotothe
thehigh
highnumber
numberof ofreading
readingchannels;
channels; and
and grgr is
is the
the weight
weight of
of
sample,
sample, e.g., 0.102 gr
e.g., 0.102 gr as
as grams,
grams, 102
102 mg).
mg).
Figure 4 shows the correlation between the total length of the fractures per unit of quartz weight
the particles)
(calculated on the basis of the total perimeter of the particles) and
and stress
stress rate.
rate.
100
y = 0.2314x2 - 2.9854x + 13.864
90 R² = 0.8634
80
Fractures total length [m/g]
70
60
50
40
30
20
10
Figure 4. Correlation between the stress rate and total fracture length.
0
3.2. Determination of0the Morphological
5 10
Characteristics of15the Fractures
20 25 30
Stress rate [MPa/s]
The morphologies of the fractures in the quartz granules after the cutting effort are extremely
varied and interesting, showing that the fracture phenomenon of this mineral is very complex and
connected to a largeFigure 4. Correlation
number between
of parameters. Wetheanalyzed
stress ratethe
anddata
totalobtained
fracture length.
from the analysis of the
images, starting from the samples that underwent the least intense pressures, to end with those that
underwent the greatest pressure.
In Figure 5, the fracture forms left on the quartz granules by stress rates of about 0.5 MPa/s are
observed. Stress creates a first series of conchoidal-shaped fractures. Around it, there are “sawtooth”Minerals 2020, 10, 870 6 of 18
3.2. Determination of the Morphological Characteristics of the Fractures
The morphologies of the fractures in the quartz granules after the cutting effort are extremely
varied and interesting, showing that the fracture phenomenon of this mineral is very complex and
connected to a large number of parameters. We analyzed the data obtained from the analysis of the
images, starting from the samples that underwent the least intense pressures, to end with those that
underwent the greatest pressure.
In Figure 5, the fracture forms left on the quartz granules by stress rates of about 0.5 MPa/s are
observed. Stress creates a first series of conchoidal-shaped fractures. Around it, there are “sawtooth”
shapes of homogeneous dimensions. The average height of the teeth is 2.3 µm. The area filled with
these teeth is extremely large and covers several hundred µm2 . We initially thought that these forms
were related to a Dauphine twinning; after careful examination we decided not to include this result, as
it is still unclear. Dauphine gemination is however compatible with the stress regime to which quartz
crystals are subjected in our experiments; in particular, Laughner et al. [12] demonstrated that the stress
required to produce twins can be lower than 88 MPa. Since the strength of quartz on compression is
200–300 MPa, Dauphiné twinning generally precedes brittle fracture.
In samples subjected to stress of greater intensity and rate (5–50 Mpa/s), simpler fractures are
generated that extend for distances from a few units to a few tens of µm. Figure 6 is a mosaic of eight
photos taken on a quartz particles with some ridges and fractures. These fractures (Figure 6) show a
profile raised above the surface with a vaguely triangular section and an average length of 20–30 µm
from the beginning of the fracture until the first bifurcation, which invariably occurs at angles of 27◦ .
In larger grains, the fractures end with euhedral shaped craters of very variable sizes, from 150 nm to
1–2 µm (Figure 7). The shapes of the craters are regular, with hexagonal, square and trigonal geometries;
only the smaller craters are elliptical (Figure 7). Most of these craters are aligned in directions inclined
with respect to the direction of the fractures. These alignments reach conspicuous dimensions, often
exceeding 100 µm. In some areas, where the density of craters is of the order of one every 2–3 µm, the
craters unite and form open fractures, ranging from a few to ten µm wide and proportional lengths
of up to 100 µm. In the fragments of the samples subjected to the maximum stress, the presence of
“bubbles” is observed on the surface of the material with fractures on the surface (Figure 7C). These
bubbles open in some places, forming small craters (50–100 nm), resembling real “hot spots” with a
raised edge of apparently melted material (Figure 8). At the apex of some fractures, there are also real
“protrusions” (Figure 9), while in rare areas, there are open fractures and craters filled with quartz
crystals, that are elongated and small, with diameters of 0.5–0.8 µm and lengths of 1–1.5 µm, and
often twinned (Figure 10). The same phenomenon can be observed in some open fractures, completely
covered by newly formed quartz crystals, from which the crystals are arranged according to a design
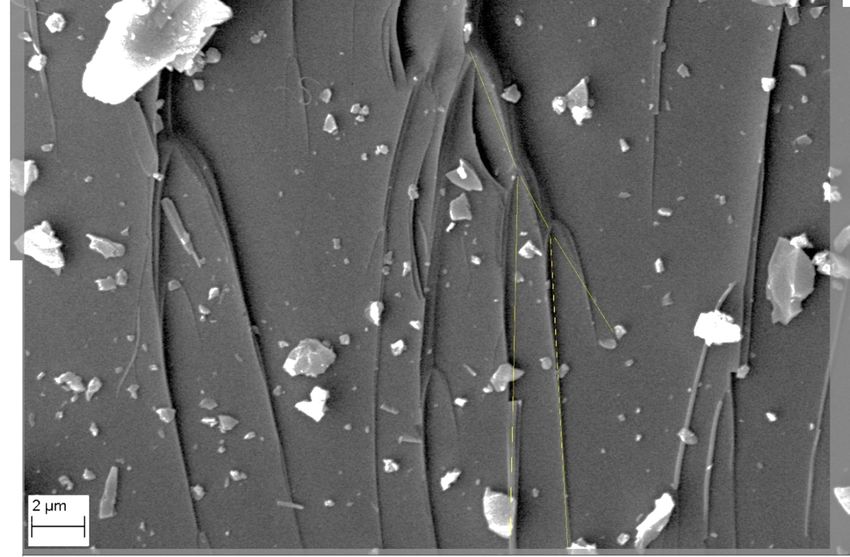
that mimics an exit direction of the precursor material. Along the fractures, detachments of filamentous
material are observed, starting from the starting point of the fracture (Figure 11). These filaments are
composed of silica alone. These fibers are characterized by diameters between 50 and 200 nm and
lengths of from a few µm to tens of µm, and they follow the fractures until they detach, and, then, they
can take on twisted, curled or meandering shapes. Their section is slightly flattened, almost as if they
were ribbons. On the points of the greatest concentration of fractures, hundreds of these filaments
are observed, which start from the fractures in a crystallographic direction and then tend to detach
(Figure 11).Minerals 2020, 10, 870 7 of 18
Minerals 2020, 10, x FOR PEER REVIEW 7 of 18
Figure
Figure 5. 5. Sawtoothforms
Sawtooth formsgenerated
generatedby by the
the combination
combination of
oftwo
twoconchoidal
conchoidalfractures
fracturesonon
the surface
the of of
surface
the quartz granules; stress rate: 0.5 MPa/s.
the quartz granules; stress rate: 0.5 MPa/s.Minerals 2020, 10, 870 8 of 18
Minerals 2020, 10, x FOR PEER REVIEW 8 of 18
Figure
Figure 6.
6. Fractures
Fractures on
on the
the surface
surface of
of aa quartz
quartz granule
granule subjected
subjected toto 100
100 MPa;
MPa; the
the bifurcations
bifurcations show
show
angles of about 27° (taken from the work of Martinelli et al. [5]).
angles of about 27◦ (taken from the work of Martinelli et al. [5]).Minerals 2020, 10, 870 9 of 18
Minerals 2020, 10, x FOR PEER REVIEW 9 of 18
Figure 7. Fractures in the granules at 150–200 MPa; in photo (A) the euhedral shapes of the craters at
Figure 7. Fractures in the granules at 150–200 MPa; in photo (A) the euhedral shapes of the craters at
the apex of fractures of a few microns are well observed. Photo (B) shows the formation of several
the apex of fractures of a few microns are well observed. Photo (B) shows the formation of several
generations of fractures starting from the craters. In photo (C), there are open fractures formed by the
generations of fractures starting from the craters. In photo (C), there are open fractures formed by
coalescence of the craters that form at the end of the fractures; on the left, aligned bubbles, barely
the coalescence of the craters that form at the end of the fractures; on the left, aligned bubbles, barely
visible on the surface of the granules. In white, the apparent directions taken by the fractures, in black
visible on the surface of the granules. In white, the apparent directions taken by the fractures, in black
the visible directions.
the visible directions.Minerals 2020, 10, 870 10 of 18
Minerals2020,
Minerals 2020,10,
10, xx FOR
FOR PEER
PEER REVIEW
REVIEW 10
10of
of18
18
Figure 8. Quartz,120
120 MPa: “hot
“hot spot”
spot” on
onquartz
quartzparticle
particlesurfaces.
Figure8.8.Quartz,
Figure Quartz, 120 MPa:
MPa: spot” on quartz particle surfaces.
surfaces.
Figure 9. Quartz, 220 MPa: amorphous silica extruded from a fracture on quartz surface.
Figure9.9.Quartz,
Figure Quartz,220
220MPa:
MPa: amorphous
amorphous silica
silica extruded
extrudedfrom
fromaafracture
fractureon
onquartz
quartzsurface.
surface.Minerals 2020, 10, 870 11 of 18
Minerals 2020, 10, x FOR PEER REVIEW 11 of 18
Figure 10. Quartz, 230 MPa: crystallization and growth of quartz microcrystals from silica near
Figure 10. Quartz, 230 MPa: crystallization and growth of quartz microcrystals from silica near
fractures and hot spots.
fractures and hot spots.Minerals 2020, 10, 870 12 of 18
Minerals 2020, 10, x FOR PEER REVIEW 12 of 18
Figure 11. Filamentous forms of silica that are an integral part of fractures of the type shown in Figure 6.
Figure 11. Filamentous forms of silica that are an integral part of fractures of the type shown in Figure 6.
3.3.3.3. Raman
Raman AnalysisofofSolid
Analysis SolidPhases
Phaseson
onFracture
Fracture Surfaces
Surfaces
Raman
Raman analyses
analyses werewere performed
performed on fracture
on fracture surfaces
surfaces that appear
that appear darkanunder
dark under opticalanmicroscope
optical
microscopelight
in polarized in polarized lightwhere
and on areas and on areas where
fracture streaksfracture streakstraces
with fibrous with are
fibrous traces
present. are present.
Figure 12 shows
Figure 12 shows some spectra taken respectively in dark isotropic areas. Given the size
some spectra taken respectively in dark isotropic areas. Given the size of the Raman laser spot used of the Raman
(≈2laser
µm),spot
the used (≈2 μm), the analysis cannot select only the filament areas that are smaller than 1/10
analysis cannot select only the filament areas that are smaller than 1/10 of spot, but will also
of spot, but will also include areas where there is certainly undisturbed quartz. Despite this, the
include areas where there is certainly undisturbed quartz. Despite this, the analysis clearly shows the
analysis clearly shows the presence of α-cristobalite and tridymite in very variable proportions
presence of α-cristobalite and tridymite in very variable proportions (Figure 12). In the first spectrum
(Figure 12). In the first spectrum (white) the 465, 404 and 365 cm−1 bands of alpha quartz are observed.
(white) the 465, 404 and 365 cm−1 bands of alpha quartz are observed. It belongs to an optically
It belongs to an optically non-isotropic zone. The underlying spectra, indicated as Black1, Black2 and
non-isotropic zone. The underlying spectra, indicated as Black1, Black2 and Black3 in Figure 12, are
Black3 in Figure 12, are three selected areas within optically isotropic areas of approximately 4 μm2
three selected
each. areas within
In the spectra optically
we observe isotropic
the presence ofareas
the mostof approximately µm2 each.
intense bands of4quartz, In the
but also spectra we
of tridymite
observe the presence
and cristobalite, of the
albeit most intense
of reduced bands
intensity. Theofidentified
quartz, but also of tridymite
cristobalite and cristobalite,
is of the alpha type, while albeit
the
of reduced intensity. The identified cristobalite is of the alpha type, while the tridymite is similar to theMinerals 2020, 10, 870 13 of 18
Minerals 2020, 10, x FOR PEER REVIEW 13 of 18
PO10 polytype, as per Ruff standard of said mineral. On the right, an enlargement of the spectra is
tridymite is similar to the PO10 polytype, as per Ruff standard of said mineral. On the right, an
observed in the range of 440 to 320 cm−1 . The Black1, 2, 3 spectra have been recorded at 200 Mpa; the
enlargement of the spectra is observed in the range of 440 to 320 cm−1. The Black1, 2, 3 spectra have
quantity of these isotropic patches seems to increase with increasing pressure and with time of stay
been recorded at 200 Mpa; the quantity of these isotropic patches seems to increase with increasing
under stress.
pressure and with time of stay under stress.
Figure
Figure 12. 12.
RamanRaman spectra
spectra of stressed
of stressed quartz
quartz fragments;
fragments; the spectra
the three three spectra below from
below derive derive
thefrom the
collection
collection of Raman spectra included in the RRUFF collection (RRUFF Project,
of Raman spectra included in the RRUFF collection (RRUFF Project, Department of Geosciences, Department of
Geosciences, University of Arizona, 1040 E 4th, Tucson, AZ, USA. 85721-0077): (Cristobalite
University of Arizona, 1040 E 4th, Tucson, AZ, USA. 85721-0077): (Cristobalite (low)-R060648, Tridymite (low)-
R060648, Tridymite
PO10-R040143, QuartzPO10-R040143, Quartz
(low)-R050125.3); on(low)-R050125.3); on the right,ofanthe
the right, an enlargement enlargement
area betweenof the
440area
and
cm−1 . 440 and 320 cm .
320between
−1
4. Discussion
4. Discussion ofof Data
Data
The
The data
data obtainedininthis
obtained thisstudy
studyshould
shouldbe be seen
seen in
in the light
light of
of the
themost
mostrecent
recentliterature
literatureonon the
the
effects of shear stress on alpha quartz, literature to which the authors have also contributed
effects of shear stress on alpha quartz, literature to which the authors have also contributed [5,6]. [5,6]. The
Thefractures
fractureswewe have observed
have observedshow an evolution
show which,
an evolution we believe,
which, depends
we believe, substantially
depends on the stress
substantially on the
rate rather than on the pressure itself. In fact, we have verified that even a pressure
stress rate rather than on the pressure itself. In fact, we have verified that even a pressure of 50 MPa, of 50 MPa,
supplied
supplied in in times
times exceedingone
exceeding oneminute,
minute,generates
generates aa more
more intense
intense fragmentation
fragmentationthanthana apressure
pressure ofof
100 MPa supplied in times of a few tens of seconds. The most relevant phenomena observed
100 MPa supplied in times of a few tens of seconds. The most relevant phenomena observed on quartz on quartz
granules
granules that
that have
have undergoneincreasing
undergone increasingstress
stressare
areas
asfollows:
follows:
• Formation of craters with euhedral shape at the apex of the fracture;
• Formation of craters with euhedral shape at the apex of the fracture;
• Coalescence of the craters to form open fractures;
• • Coalescence
Detachment of of
theapparently
craters to amorphous
form open fractures;
siliceous material, fibrous in shape from the ridges and
• Detachment of apparently
traces of fractures; amorphous siliceous material, fibrous in shape from the ridges and
• traces of fractures;
Bubble formation on the surface, some of which show amorphous silica extrusions;
• • Bubble
Formation of craters
formation onsurface,
on the the surface
somefrom
of which amorphous silica issilica
show amorphous expelled;
extrusions;
• • Formation of craters on the surface from which amorphous silica is expelled; points, such as
Formation of secondary quartz crystallizations, which radiate from “emission”
• craters and
Formation open fractures.
of secondary quartz crystallizations, which radiate from “emission” points, such as
craters and open fractures.Minerals 2020, 10, 870 14 of 18
From Figure 4 it can be observed that the fracture length increases exponentially with the increase
in the stress rate. This is reasonable, since the total length is related to the number of particles and
this to the number of bifurcations of the cracks that are generated during the breaking of the quartz
crystals. Cracks that reach critical speed tend to divide into two cracks (bifurcations) with an acute
angle between them, as demonstrated by Tromans and Meech [13–15]. Consequently, if the stress
velocity is greater, the cracks’ opening speed will also be greater, and this will produce more fractures
and a greater number of particles.
In Figure 6, the ridges indicate the presence of fractures under the surface. The crests indicate an
increase in volume propagated linearly along the fractures. The fractures separate into two sections
with an acute angle of 27◦ . As is known, the angle of forking varies with the stress state. In particular,
the bifurcation angle indicates the relationship between shear stress and normal stress τ/σn . An angle
of 27◦ corresponds to a ratio from −0.3 to −0.5, which essentially indicates a bending stress (Richter,
2003) [16]. Both the total length of the fractures and the amplitude of the bifurcation angle are
parameters to be framed in a wider context of energy analysis of the fracturing phenomenon, for which
the reader is referred to the cited bibliography. In this context, it is sufficient to remember that the
fracture length is connected with the fracturing speed [13–15]. The cited authors calculate that in
alpha quartz, the fractures split in two when the propagation speed reaches the climit (limit speed of
1990 m/s). At that moment, the ratio between the size of the new fracture, ai and the initial size, a,
is equal to 2, and the speeds of the two daughter fractures is reduced to 30–50% of climit. The two
fractures thus formed increase their speed and must again fork when they reach climit and at an ai /a
ratio of 4, according to relation:
(ai /a)branch4 = 2(ai /a)branch3 = 2(ai /a)branch2 = 2(ai /a)branch1 = 2(ai /a)climit
It is important to note that an increase in the propagation speed leads to a higher frequency of
bifurcations and therefore to a greater fragmentation. This is confirmed by the observations made
with the analysis of the morphological image of the particles, where it is evident that a higher stress
rate increases the number of particles and the total fracture length (Figure 4). It is noteworthy that
the propagation of fractures in the minerals causes an accumulation of deformation energy, and this
energy must dissipate; in mineral mechanics, the ways of disposing of the plastic deformation energy
are essentially two: the bifurcation of fractures and, above all, the increase in temperatures in the
deformation areas at the fracture tip [17,18].
The formation of the craters visible in Figure 7A–C is consequential to the propagation of fractures.
In Figure 7A,B it is observed that the fractures end with a regular-shaped crater, often mimicking
a crystalline form with five to six faces. The volume of matter removed from these craters seems
independent of the visible (or superficial) length of the fractures. We believe that the loss of fragments
of material with crystalline forms is linked to the presence of fracture lines already existing in the
crystal, parallel to crystallographic directions. The reader should also note the correspondence between
the apex of the fracture and the corresponding crater. We believe this is due to the undermining of
the material by the wave at ultrasonic speed connected to the propagation of the fractures. Figure 7C
shows the presence of surface bubbles that show cracks of about 40 nm width and lengths of about
1 µm. The bubbles also appear aligned, according to directions that lie at 60◦ with respect to the
fractures. We believe that these bubbles are the superficial manifestation of the melting effect at
ultrasonic speed that occurs inside the quartz grains during the crack propagation and which produces
most of the phenomena we are describing. The same phenomenon is responsible for the formation
of the craters aligned with the amorphous silica extrusions, visible in Figure 8, the silica extrusions
in Figure 9, the recrystallized quartz from silica extrusion in Figure 10 and, finally, the filamentous
fibers in Figure 11 that are, perhaps, the most interesting part of the discoveries made in this work.
The Raman analysis performed on the silica fibers associated with the fractures shows that this silica
is organized in the form of α-cristobalite and tridymite (Figure 12). The presence of cristobalite had
already been highlighted by the authors of this work [5,6], where the structural changes of quartz inMinerals 2020, 10, 870 15 of 18
nanocrystalline cristobalite were described when alpha quartz was subjected to shear stresses. In the
aforementioned work, we have shown that the action of prolonged shear stress on the quartz crystals
determines a reticular distortion so large as to lead the quartz itself to an amorphization; in this
“amorphous silica”, the radial distribution function analysis (RDF) has highlighted the formation of
short-term clusters with a six-tetrahedron organization, similar to cristobalite and tridymite and no
longer to four tetrahedrons [6]. It has also been shown that, if these amorphous phases are brought to
1200 ◦ C, they tend to transform nano-cristobalite into a well-crystallized cristobalite, well visible in
X-ray diffraction analysis [6]. The same association of minerals had been reported in a paper of Brodie
and Rutter (2000) on quartz samples subjected first to tensile stress and then to heating at 1200 ◦ C [17].
To explain the data collected, we hypothesized a mechanism that can materialize thanks to the
speed of propagation of the fractures. The heart of the mechanism is tensile stress, which induces
the opening of a large number of fractures in the quartz volume. Fracture propagation occurs at
an estimated speed between 50% and 60% of the shear wave, therefore between 650 and 1000 m/s,
and for this reason we can speak of ultrasonic speed. At these speeds, the fractures tend to fork after
just 25–30 µm, and the crack tip transit times are therefore in the order of 30 ÷ 50ns. In such a short
fraction of time, the amount of heat produced by the passage of the crack tip cannot have transferred
to the volume outside the fracture. Weichert had already measured temperatures above 2000 K on the
fractured quartz, and this has been confirmed by other authors [18,19]. These temperature increases
generate channels of fused silica, which has a decidedly lower density than quartz (2.2 g/cm3 against
2.65 g/cm3 ). The decrease in density causes an immediate expansion in volume which causes surface
fracturing. In actual fact, we can say that during the melting, the molar volume increases from
22.688 cm3 /mol to 27.20 cm3 /mol, with an expansion of 16.5% [19], more than enough to open the
surface over the crack and bring out the fused and clotted silica filament that is inside it.
The events we have described are summarized in the diagrams in Figure 13. In the first one, we
observe the simulation of the silica filaments growth, starting from the fractures; Figure 13B shows the
formation of fractures ending with the euhedral craters and the formation of bullous-shaped growths.
Figure 13C shows the pattern of crater formation (“hot spot”) and silica protrusion from subsurface
melted areas. Our data demonstrate that the friction action applied to quartz in totally anhydrous
conditions leads to the formation of amorphous silica, which quickly organizes itself into nanostructures
of cristobalite and tridymite [5,6]. Cristobalite has a structure consisting of rings with 6 tetrahedra, with
structural arrangements that show an auxetic behavior, that is, with a negative Poisson’s ratio [20,21]
(Table 1). This means that a tangential compression produces a reduction in length in the normal
direction and not an expansion, as expected from solids with a positive Poisson’s ratio. The effect is
particularly felt by the alpha cristobalite, whose Poisson ratio reaches the considerable negative value
of −0.169. In practice, if the tangential contraction is 100 mm, the normal contraction will be 16.9 mm;
this reduces the contact surface and correspondingly reduces its friction. It should also be taken into
account that the phenomena whose generation we have verified are extremely fast, because they occur
in the time interval that elapses during the final phase of propagation of the fractures. The speed of
these contractions is linked to the propagation speed of the ultrasonic wave.Minerals 2020, 10, 870 16 of 18
Minerals 2020, 10, x FOR PEER REVIEW 16 of 18
Figure 13. Scheme of propagation of fractures in quartz granules; (A) beginning of the phenomenon,
Figure 13. Scheme of propagation of fractures in quartz granules; (A) beginning of the phenomenon,
as the fractures spread; (B) formation of fractures ending with the euhedral craters and superficial
as the fractures spread; (B) formation of fractures ending with the euhedral craters and superficial
“elevations”; (C) formation of craters (“hot spots”) and the protrusion of silica from the molten areas
“elevations”; (C) formation of craters (“hot spots”) and the protrusion of silica from the molten
below.
areas below.
Table1.1. Mechanical
Table Mechanical parameters
parameters forfor silica
silica polymorphs
polymorphs [13,14,20], G == Shear
[13,14,20], G modulus, EE == Young
Shear modulus, Young
modulus, nn == Poisson ratio, %ρ =
modulus, = density, εε =
= strain.
Silica
Silica PolymorphsG G
Polymorphs EE υυ ρ % ε ε
GpaGpa Gpa
Gpa nn g/cm g/cm % %
3 3
quartz quartz
alpha alpha 44.144.1 95.6
95.6 0.084
0.084 2.65
2.65 8.4 8.4
quartz beta beta 41.541.5
quartz 99.1
99.1 0.194 2.53
0.194 2.53 19.4 19.4
cristobalite alpha 37.1 61.3 −0.169 2.32 −16.9
cristobalite alpha 37.1 61.3 −0.169 2.32 −16.9
cristobalite beta 32.6 62.3 −0.044 2.20 −4.4
cristobalite
tridymite low beta 28.832.6 62.3
58.1 −0.044
0.004 2.20
2.27 −4.4 0.4
tridymite
tridymite high low 26.728.8 58.1
52.8 0.004
−0.011 2.27
2.26 0.4 −1.1
tridymite
Silica glass high 33.426.7 52.8
79.3 −0.011
0.187 2.26
2.20 −1.1 18.7
Silica glass 33.4 79.3 0.187 2.20 18.7
If the application of stress is continuous, there is an accumulation of amorphous silica that
quickly If the application
transforms of stress isand
into cristobalite continuous,
tridymite there is an
near the accumulation
fracture and sliding of areas.
amorphous silica that
The mechanisms
described also explain the so-called “flash melting” which is observed by numerous authors in The
quickly transforms into cristobalite and tridymite near the fracture and sliding areas. the
mechanisms described also explain the so-called “flash melting” which
shear stress tests on quartz and, above all, the sudden drop in the coefficient of friction that all the is observed by numerous
authorsobserve
authors in the shear
whenstress tests on
the quartz is quartz
subjected and,to above
severeall, the sudden
friction drop[1].
conditions in the coefficient
Various authorsofsupport
friction
that all the authors observe when the quartz is subjected to severe friction
the thesis that the friction, exerted on quartz-rich rocks, generates a sort of silica gel lubricating conditions [1]. Various
authors
film, support thematerial
an amorphous thesis that the
rich infriction, exerted on
water, deriving fromquartz-rich rocks, generates
the environment where thea test
sort takes
of silica gel
place.
lubricating film, an amorphous material rich in water, deriving from the
The concept of the lubricating gel is also taken up by [4], who had detected the presence of amorphousenvironment where the test
takesin
silica place. The concept
the flow tracks ofof the lubricating
experiments gel is also
by means taken up by
of tribometric [4], who
rotating had detected
friction the presence
apparatuses, such as
of amorphous silica in the flow tracks of experiments by means of
the “pin-on-disk” on quartz [3,4]. Authors detected, via Raman spectroscopy, the peaks attributable tribometric rotating friction
apparatuses, such as the “pin-on-disk” on quartz [3,4]. Authors detected,
to moganite (metastable phase of silica, quickly converted into cristobalite and tridymite) and to via Raman spectroscopy,
the peaks attributable
amorphous to moganite
silica, as well (metastable
as reticular distortions phase of silica,
of alpha quickly
quartz. convertedthe
In addition, intoauthors
cristobalite
showedand
spectra in FTIR microspectrophotometry to prove the presence of water in the amorphous silicathe
tridymite) and to amorphous silica, as well as reticular distortions of alpha quartz. In addition, of
authors
these showed
traces of flow. spectra in FTIR
The results microspectrophotometry
obtained, albeit preliminary, do to prove
appearthe presenceInofparticular,
interesting. water in the the
amorphous
fact silica ofsilica
that amorphous these
hastraces
hydratedof flow. The results humidity
with atmospheric obtained,isalbeit
possible,preliminary,
but it doesdo notappear
prove
interesting. In particular, the fact that amorphous silica has hydrated with atmospheric
that it is the means of sliding the faults that insist on quartz-based rocks. In our tests, carried out under humidity is
possible, but it does not prove that it is the means of sliding the faults
anhydrous conditions, there can be no water presence, but the same amorphous silica and cristobalite that insist on quartz-based
rocks. In our tests, carried out under anhydrous conditions, there can be no water presence, but the
same amorphous silica and cristobalite and nanocrystalline tridymite are formed, which, as we have
said, have the characteristic of reacting to efforts by decreasing the contact area, with relativeMinerals 2020, 10, 870 17 of 18
and nanocrystalline tridymite are formed, which, as we have said, have the characteristic of reacting to
efforts by decreasing the contact area, with relative reduction of the friction coefficient. At the end of
this long discussion of data, we would like to summarize the events that, in our opinion, characterize
the transformation of quartz into a low friction coefficient material:
1. the tensile stress field generates fractures that open quickly, spreading over the entire volume of
the area subjected to shear stress;
2. the propagation of the fractures generates the local melting of the quartz, producing the formation
of amorphous silica, whose density is lower than that of the quartz; the difference in density
and thermal expansion causes the fracture of the surfaces and the dispersion of the silica, which
quickly solidifies in the form of nanocrystalline cristobalite (which has a marked auxetic behavior)
and sometimes tridymite;
3. the accumulation of these polymorphs in the rock volumes subject to greater stress leads to a
progressive reduction of friction and, easily, to the triggering of the movement.
In none of these events is the presence of water necessary.
5. Conclusions
In this work we have definitively shown that anisotropic stress on quartz crystals causes the
formation of amorphous silica and, from it, at least two silica polymorphs, cristobalite and tridymite,
in nanocrystalline form. These phases accumulate with the advancement of the fractures and can
profoundly modify the behavior of the solid in terms of friction coefficient. Amorphous silica is,
therefore, not a simple friction melting product of the surface portion of the rock subject to friction, but
it is a precursor of far more complex phases that represent the memory of the event. This observation
contrasts sharply with what had been hypothesized by several authors, who aim to explain the lowering
of the friction coefficient of the quartz subjected to shear stress due to the simple presence of silica gel.
Given the extreme speed with which cristobalites and tridymites are formed, we can argue that
these mineral phases are generated while the fracture phase is still active and that their accumulation
is such as to heavily modify the rock’s mechanical behavior.
Cristobalite can thus be the main cause of the collapse of the friction coefficient occurring in the
friction tests on quartz and on rocks rich in quartz.
Author Contributions: Conceptualization: G.M. and P.P.; Methodology: G.M. and P.P.; Analyses and investigation:
P.P., E.T., E.P.; Writing—original draft preparation: P.P.; Writing-review and editing: G.M. and P.P.; Resources and
project administration: F.G. All authors have read and agreed to the published version of the manuscript.
Funding: This research received no external funding.
Acknowledgments: Thanks are due to two anonymous reviewers who contributed, with their suggestions, to
improve the quality of the present paper. The Chinese Academy of Sciences Visiting Professorship partially
supported Giovanni Martinelli for Senior International Scientists (2018VMA0007).
Conflicts of Interest: The authors declare no conflict of interest.
References
1. Di Toro, G.; Goldsby, D.L.; Tullis, T.E. Friction falls towards zero in quartz rock as slip velocity approaches
seismic rates. Nature 2004, 427, 436–439. [CrossRef]
2. Hirose, T.; Shimamoto, T. Growth of molten zone as a mechanism of slip weakening of simulated faults in
gabbro during frictional melting. J. Geophys. Res. Space Phys. 2005, 110. [CrossRef]
3. Hayashi, N.; Tsutsumi, A. Deformation textures and mechanical behavior of a hydrated amorphous silica
formed along an experimentally produced fault in chert. Geophys. Res. Lett. 2010, 37, 12305. [CrossRef]
4. Nakamura, Y.; Muto, J.; Nagahama, H.; Shimizu, I.; Miura, T.; Arakawa, I. Amorphization of quartz by
friction: Implication to silica-gel lubrication of fault surfaces. Geophys. Res. Lett. 2012, 39, 21303. [CrossRef]
5. Martinelli, G.; Plescia, P.; Tempesta, E. Electromagnetic emissions from quartz subjected to shear stress:
Spectral signatures and geophysical implications. Geosciences 2020, 10, 140. [CrossRef]Minerals 2020, 10, 870 18 of 18
6. Martinelli, G.; Plescia, P.; Tempesta, E. “Pre-Earthquake” Micro-Structural Effects Induced by Shear Stress on
α-Quartz in Laboratory Experiments. Geosciences 2020, 10, 155. [CrossRef]
7. Tavares, L.M.; King, R.P. Single particle fracture under impact loading. Int. J. Miner. Process. 1998, 54, 1–28.
[CrossRef]
8. Tavares, L.M. Optimum routes for particles breakage by impact. Powder Technol. 2004, 142, 81–91. [CrossRef]
9. Tugcam Tuzcu, E.; Rajamani, R.K. Modeling breakage rates in mills with impact energy spectra and ultra fast
load cell data. Miner. Eng. 2011, 24, 252–260. [CrossRef]
10. Marcos, L.V.R.; Larruquert, J.I.; Méndez, J.A.; Aznárez, J.A. Self-consistent optical constants of SiO2 and
Ta2 O5 films. Opt. Mater. Express 2016, 6, 3622–3637. [CrossRef]
11. Zhao, B.; Wang, J.; Coop, M.R.; Viggiani, G.; Jiang, M. An investigation of single sand particle fracture using
X-ray micro-tomography. Géotechnique 2015, 65, 625–641. [CrossRef]
12. Laughner, J.W.; Newnham, R.E.; Cross, L.E. Mechanical Twinning in small quartz crystals. Phys. Chem. Min.
1982, 8, 20–24. [CrossRef]
13. Tromans, D.; Meech, J. Enhanced dissolution of minerals: Stored energy, amorphism and mechanical
activation. Miner. Eng. 2001, 14, 1359–1377. [CrossRef]
14. Tromans, D.; Meech, J.A. Fracture toughness and surface energies of minerals: Theoretical estimates for
oxides, sulphides, silicates and halides. Miner. Eng. 2002, 15, 1027–1041. [CrossRef]
15. Tromans, D.; Meech, J.A. Fracture toughness and surface energies of covalent minerals: Theoretical estimates.
Miner. Eng. 2002, 17, 1–15. [CrossRef]
16. Richter, H. Fractography of Bioceramics. In Key Engineering Materials; Dusza, J., Ed.; Trans Tech Publications:
Baech, Switzerland, 2003; Volume 223, pp. 157–180.
17. Weichert, R.; Shonert, K. Heat generation at the tip of a moving crack. J. Mech. Phys. Solids 1978, 26, 151–161.
[CrossRef]
18. Rittel, D. On the conversion of plastic work to heat during high strain deformation of glassy polymers. Mech.
Mater. 1999, 31, 131–139. [CrossRef]
19. Brodie, K.H.; Rutter, E.H. Rapid stress release caused by polymorphic transformation during the experimental
deformation of quartz. Geophys. Res. Lett. 2000, 27, 3089–3092. [CrossRef]
20. Pabst, W.; Gregorova, E. Elastic Properties of silica polymorphs—A review. Ceram. Silik. 2013, 57, 167–184.
21. Yeganeh-Haeri, A.; Weidner, D.J.; Parise, J.B. Elasticity of a-Cristobalite: A Silicon Dioxide with a Negative
Poisson’s Ratio. Science 1992, 257, 650–652. [CrossRef] [PubMed]
© 2020 by the authors. Licensee MDPI, Basel, Switzerland. This article is an open access
article distributed under the terms and conditions of the Creative Commons Attribution
(CC BY) license (http://creativecommons.org/licenses/by/4.0/).You can also read