Electron Backscattered Diffraction to Estimate Residual Stress Levels of a Superalloy Produced by Laser Powder Bed Fusion and Subsequent Heat ...
←
→
Page content transcription
If your browser does not render page correctly, please read the page content below
materials
Article
Electron Backscattered Diffraction to Estimate
Residual Stress Levels of a Superalloy Produced by
Laser Powder Bed Fusion and Subsequent
Heat Treatments
Mathieu Terner 1, * , Jiwon Lee 1,2 , Giulio Marchese 3 , Sara Biamino 3         and Hyun-Uk Hong 1
 1   Department of Materials Science and Engineering, Changwon National University, 20 Changwondaehak-ro,
     Changwon, Gyeongnam 51140, Korea; jwlee10@changwon.ac.kr (J.L.); huhong@changwon.ac.kr (H.-U.H.)
 2   Institut Clément Ader (ICA), Université de Toulouse, CNRS, IMT Mines Albi, INSA, ISAE-SUPAERO, UPS,
     Campus Jarlard, F-81013 Albi, France
 3   Department of Applied Science and Technology, Politecnico di Torino, Corso Duca degli Abruzzi 24,
     10129 Torino, Italy; giulio.marchese@polito.it (G.M.); sara.biamino@polito.it (S.B.)
 *   Correspondence: mathieu@changwon.ac.kr

 Received: 23 September 2020; Accepted: 15 October 2020; Published: 17 October 2020

 Abstract: Metal Additive Manufacturing and Laser Powder Bed Fusion (LPBF), in particular,
 have come forth in recent years as an outstanding innovative manufacturing approach. The LPBF
 process is notably characterized by very high solidification and cooling rates, as well as repeated
 abrupt heating and cooling cycles, which generate the build-up of anisotropic microstructure and
 residual stresses. Post-processing stress-relieving heat treatments at elevated temperatures are often
 required in order to release some of these stresses. The effects of 1 h–hold heat treatments at different
 specific temperatures (solutionizing, annealing, stress-relieve and low-temperature stress-relieve)
 on residual stress levels together with microstructure characterization were therefore investigated
 for the popular Alloy 625 produced by LPBF. The build-up of residual stress is accommodated
 by the formation of dislocations that produce local crystallographic misorientation within grains.
 Electron backscattered diffraction (EBSD) was used to investigate local misorientation by means of
 orientation imaging, thereby assessing misorientation or strain levels, in turn representing residual
 stress levels within the material. The heavily constrained as-built material was found to experience
 full recrystallization of equiaxed grains after solutionizing at 1150 ◦ C, accompanied by significant
 drop of residual stress levels due to this grains reconfiguration. Heat treatments at lower temperatures
 however, even as high as the annealing temperature of 980 ◦ C, were found to be insufficient to
 promote recrystallization though effective to some extent to release residual stress through apparently
 dislocations recovery. Average misorientation data obtained by EBSD were found valuable to evaluate
 qualitatively residual stress levels. The effects of the different heat treatments are discussed and
 suggest that the peculiar microstructure of alloys produced by LPBF can possibly be transformed to
 suit specific applications.

 Keywords:      laser powder bed fusion;            superalloys;    residual stress;    heat treatment;
 electron backscattered diffraction; Alloy 625

1. Introduction
     For several years, Metal Additive Manufacturing has become an undisputable alternative
to conventional manufacturing. It offers many advantages including versatility, complex and
near-net-shape manufacturing, elimination of tooling, materials waste reduction, shorter lead time

Materials 2020, 13, 4643; doi:10.3390/ma13204643                             www.mdpi.com/journal/materials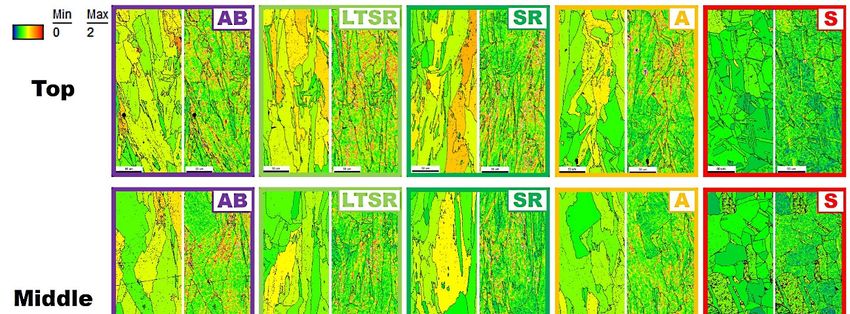
Materials 2020, 13, 4643                                                                                2 of 18

and more. Laser Powder Bed Fusion (LPBF), in particular, consists in selective fusion of regions of
a powder bed by means of a fast-scanning high-power laser beam. It is notably characterized by
very high solidification and cooling rates, as high as 105 –106 ◦ C/s, as well as repeated and sharp
heating-and-cooling cycles as the laser beam travels over the powder bed and the consolidated
parts according to the selected scanning strategy [1–6]. These unique characteristics, as opposed
to conventional manufacturing, are responsible for the peculiar microstructure of LPBFed parts.
This microstructure can be effectively controlled, to some extent, by varying the numerous process
parameters. However, this severe thermal cycling also leads to stresses sometimes approaching or
even exceeding the elastic limit of the materials associated with the build-up of anisotropic residual
stresses. As a result, these high levels of residual stress may cause parts’ distortion and/or cracking
thus significantly affecting mechanical properties (fatigue in particular). The reader is conveniently
invited to refer to the excellent review recently published by Bartlett and Li [7] addressing residual
stresses in metal powder bed fusion. While processing parameters can also be optimized with regards
to their significant effect on residual stress buildup, post-processing stress relieving heat treatments at
elevated temperatures to be applied shortly after manufacturing are often advised in order to release
these stresses to some extent.
       In previous studies, the effects of different heat treatments on microstructure and associated
tensile properties of Alloy 625 produced by LPBF were investigated [8–10]. Alloy 625 is a popular
Nb-rich solid-solution strengthened Ni-based superalloy characterized by attractive high temperature
resistance for applications in aerospace and land-based gas turbines in particular [11–14]. In previous
works, we found that the microstructure fully recrystallized upon solution treatment above
1150 ◦ C [8–10]. This is remarkable as for Alloy 625, and most polycrystalline materials for that
matter, recrystallization is usually achieved by application of external stress such as cold working
followed by heating above the recrystallization temperature (which depends on the amount of cold
work). Dynamic recrystallization is also possible by simultaneous application of stress and temperature
during hot working. Recrystallization is a standard process of nucleation and growth of new strain-free
and equiaxed grains from a severely strained microstructure, driven by the difference in internal energy
(i.e., strain energy) between the strained and recrystallized material [15]. This suggests that strain energy
built up in the as-built material produced by LPBF was high enough to lead to full recrystallization
during solution treatment. A large number of authors also reported similar recrystallization after
solution treatment of metals produced by LPBF [16–27], discussed later in Section 4.1. There exist
several methods commonly utilized to evaluate stress levels within materials including the hole-drilling
method, the contour method and diffraction methods such as X-ray Diffraction (XRD) and Neutron
Diffraction (ND) [7]. While these methods provide some extent of quantitative characteristics of stress,
their protocols may be challenging.
       The as-built microstructure of Alloy 625 produced by LPBF is virtually always characterized by
strong texture, large anisotropy, inhomogeneous solute distribution, a very fine dendritic structure, and a
very high dislocations density primarily within the interdendritic regions [6,8–10,28–31]. The very high
dislocations density, in particular, is the result of the peculiar solidification and thermal history inherited
from LPBF, thus highlighting the high degree of strain energy previously mentioned. Perhaps naively,
the assumption is that the higher the strain levels and associated residual stress, the higher the
dislocations density and associated sub-micrometer deviation from perfect crystalline ordering.
For this reason, electron microscopy methods such as electron backscattered diffraction (EBSD),
which allow us to evaluate misorientation within crystals through Orientation Imaging Microscopy
(OIM), seem appropriate to “visualize” strain levels. The present study uses EBSD to evaluate the
effects of different 1 h–hold heat treatments at the standard temperatures of solutionizing (1150 ◦ C),
annealing (980 ◦ C), stress-relieve (870 ◦ C), and at an experimental low-temperature stress-relieve
(650 ◦ C). Microstructures and misorientation levels are studied to discuss the role of heat treatments
and the suitability of EBSD techniques to assess residual stress in metals produced by LPBF.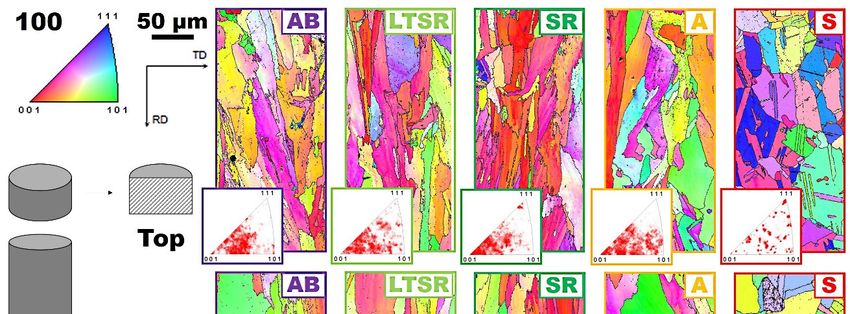
Materials 2020, 13, 4643                                                                                  3 of 18

2. Materials and Methods

2.1. Raw Materials and LPBF Processing
     Gas-atomized pre-alloyed Alloy 625 powder suitable for LPBF production was provided by the
machine manufacturer EOS GmbH (Munich, Germany). The element composition of the powder
given by the supplier and verified by Inductively Coupled Plasma (ICP) and Infrared absorption (IR)
analyses is reported in Table 1. Most particles were spherical, with a typical Gaussian size distribution
measured between d10 = 16 µm and d90 = 48 µm. Samples were produced with a commercial EOSINT
M270 Dual Mode machine (EOS GmbH, Munich, Germany). The scanning strategy used stripes of
5 mm overlapping by 0.12 mm and a laser scanning direction rotated by 67◦ between subsequent
layers. Optimized parameter conditions for Alloy 625 were utilized (laser power P = 195 W, scanning
speed v = 1200 mm/s, hatching distance h = 90 µm and layer thickness t = 20 µm). These conditions
are the result of an optimization campaign leading to the production of specimens with a residual
porosity less than 0.1% [30]. Thereby, 100 mm–long cylindrical specimens with a diameter of 25 mm
were produced, vertically, for characterization and subsequent heat treatments.

                     Table 1. Chemical composition of the Alloy 625 powder in weight percent.

  Composition         Ni      Cr       Mo        Fe       Nb        Co      Si        Ti         Al      C
    Supplier        ≥58.0    20–23     8–10      ≤5     3.15–4.15   ≤1.0   ≤0.5      ≤0.4       ≤0.4    ≤0.1
     ICP/IR          Bal.     22.8      8.1     0.43      3.66      0.17    0.1      0.17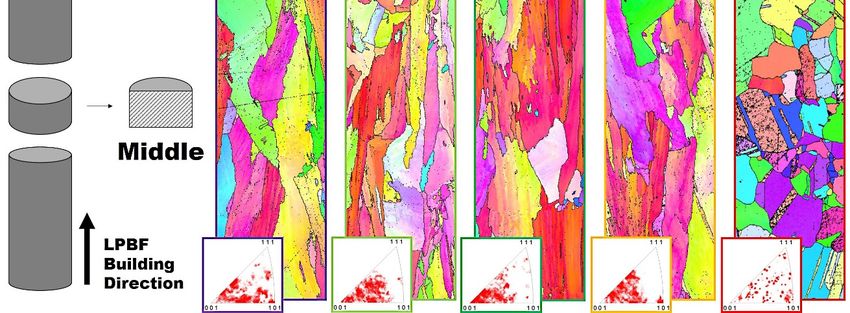
Materials 2020,
Materials 2020, 13,
                13, 4643
                    4643                                                                                      44 of 17
                                                                                                                 of 18

      Figure 1. Schematic diagram of the different heat treatments superimposed on the conventional
      Figure 1. Schematic diagram of the different heat treatments superimposed on the conventional Time–
      Time–Temperature Transformation (TTT) diagram for Alloy 25 [12].
      Temperature Transformation (TTT) diagram for Alloy 25 [12].
2.3. Microstructure Characterization and Residual Strain Levels
      All heat treatments were carried out in a muffle furnace with a ±5 °C precision, equipped with a
      Specimens for microstructure analyses were cautiously sectioned, hot mounted in phenolic resin
 K-type thermocouple located close to the sample. Each specimen was eventually quenched in water
and carefully ground with SiC abrasive papers, followed by sequential polishing with diamond paste
 to preserve microstructure. It should be noted that water quenching, due to rapid cooling, induces
down to 1 µm. The microstructure was revealed by means of a 100 mL HCl + 0.5 g CrO3 etching
 thermal contraction residual stress particularly significant at the periphery of cylindrical specimens,
solution and investigated by optical microscopy (OM, OLYMPUS BX51M, Tokyo, Japan) and scanning
 cooling first and rapidly. This quenching stress prevents the use of XRD for assessing LPBF process
electron microscopy (SEM, JSM-6510, JEOL, Tokyo, Japan). Specimens for transmission electron
 residual stress levels on the surface of specimens.
microscopy (TEM, field-emission type JEM-2100F operating at 200 kV, JEOL, Tokyo, Japan) were
extracted   from theCharacterization
 2.3. Microstructure    middle of specimens.      ThinStrain
                                         and Residual  foils were
                                                               Levelsprepared by fine grinding and polishing,
to a thickness of approximately 200 µm, punching of 3 mm diameter discs and electropolishing to
      Specimens
perforation   with for  microstructure
                    a 200 mL perchloricanalyses    were
                                          acid + 800     cautiouslysolution
                                                     mL methanol       sectioned,  hot mounted
                                                                               at −26~−28          in phenolic
                                                                                            ◦ C, using           resin
                                                                                                       a jet polisher
 and carefully
(TenuPol-5,      groundCopenhagen,
              Struers,     with SiC abrasive  papers,
                                         Denmark)      followedat
                                                     operating     by50
                                                                      sequential
                                                                         mA and polishing      with Backscattering
                                                                                   25 V. Electron    diamond paste
 down   to 1  µm.   The   microstructure   was  revealed   by   means   of  a 100  mL
Diffraction (EBSD) with a field-emission scanning electron microscope (FE-SEM, MIRA-II,HCl   +  0.5 g  CrOTESCAN,
                                                                                                            3 etching

 solution  and    investigated   by   optical  microscopy     (OM,    OLYMPUS        BX51M,    Tokyo,
Brno, Czech Republic) was carried out. To avoid artifacts from metallographic preparation, the final    Japan)    and
1scanning   electron
  µm polishing    step microscopy
                        was executed, (SEM,
                                        usingJSM-6510,
                                              a colloidalJEOL,    Tokyo, Japan).
                                                          silica suspension,   and noSpecimens    for transmission
                                                                                        etching solution   was used.
 electron  microscopy     (TEM,  field-emission   type JEM-2100F      operating 2 at 200 kV,  JEOL,
All five cylindrical bars were sectioned to extract approximately 1 cm specimens in the middle and    Tokyo,   Japan)
                                                                                                                    at
the top for observation in the cross-section parallel to the building direction. A schematic diagramand
 were  extracted    from    the middle    of specimens.    Thin   foils  were  prepared    by   fine  grinding      of
 polishing,
the  samplesto    a thickness
               is given          of 2.approximately 200 µm, punching of 3 mm diameter discs and
                         in Figure
 electropolishing to perforation with a 200 mL perchloric acid + 800 mL methanol solution at −26~−28
 °C, using a jet polisher (TenuPol-5, Struers, Copenhagen, Denmark) operating at 50 mA and 25 V.
 Electron Backscattering Diffraction (EBSD) with a field-emission scanning electron microscope (FE-
 SEM, MIRA-II, TESCAN, Brno, Czech Republic) was carried out. To avoid artifacts from
 metallographic preparation, the final 1 µm polishing step was executed, using a colloidal silica
 suspension, and no etching solution was used. All five cylindrical bars were sectioned to extract
 approximately 1 cm2 specimens in the middle and at the top for observation in the cross-section
 parallel to the building direction. A schematic diagram of the samples is given in Figure 2.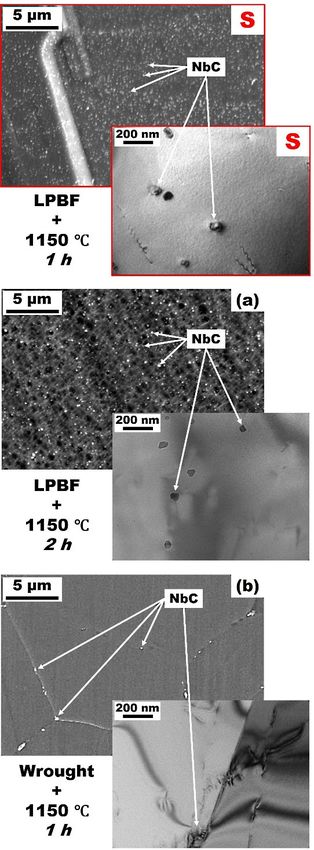
Materials 2020, 13, 4643                                                                                                5 of 17
             Materials 2020, 13, 4643                                                                         5 of 18

                                   Figure 2. Schematic diagram of the specimens and 5 different conditions.
                        Figure 2. Schematic diagram of the specimens and 5 different conditions.
             3. Results

3. Results 3.1. Microstructure
                The microstructure of the Alloy 625 produced by LPBF as-built and after the four isothermal
           heat treatments was observed at different length scale. Optical microscopy (OM) allows evidencing
3.1. Microstructure
           the typical processing features proper to the LPBF process, such as melt pools, as well as the
     The microstructure        of the Alloy
           grain structure. Scanning    electron625 produced
                                                 microscopy  (SEM)byhighlights
                                                                      LPBF as-built      and after the
                                                                               the cellular/dendritic      four isothermal
                                                                                                      structure
           and segregation. Transmission electron microscopy (TEM) reveals the finer details, in particular,
heat treatments was observed at different length scale. Optical microscopy (OM) allows evidencing
           subgrain structure and dislocations. Figure 3 shows the corresponding microstructures in the middle
the typicalofprocessing
              the cylindricalfeatures proper to the LPBF process, such as melt pools, as well as the grain
                              specimens.
structure. Scanning electron microscopy (SEM) highlights the cellular/dendritic structure and
segregation. Transmission electron microscopy (TEM) reveals the finer details, in particular, subgrain
structure and dislocations. Figure 3 shows the corresponding microstructures in the middle of the
cylindrical specimens.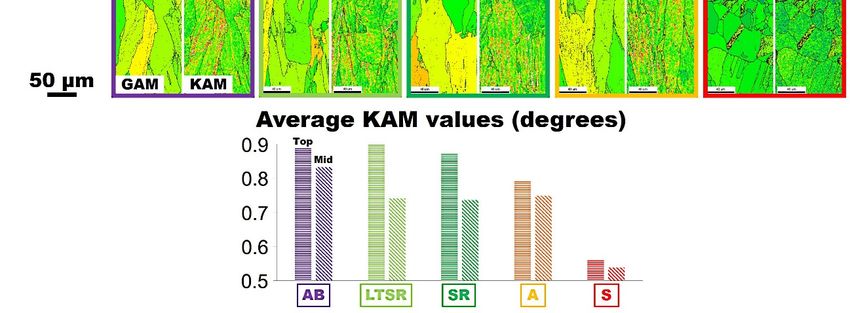
The microstructure of the Alloy 625 produced by LPBF as-built and after the four isothermal
heat treatments was observed at different length scale. Optical microscopy (OM) allows evidencing
the typical processing features proper to the LPBF process, such as melt pools, as well as the grain
structure. Scanning electron microscopy (SEM) highlights the cellular/dendritic structure and
segregation. Transmission electron microscopy (TEM) reveals the finer details, in particular, subgrain
Materials 2020, 13, 4643 6 of 18
structure and dislocations. Figure 3 shows the corresponding microstructures in the middle of the
cylindrical specimens.
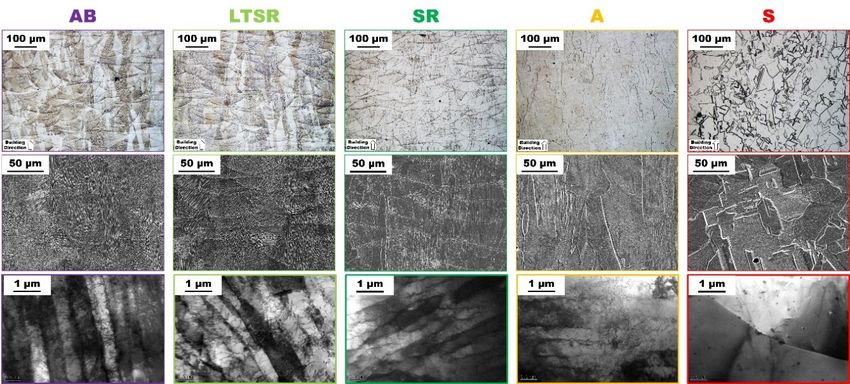
Figure 3. Optical (top), scanning electron (middle) and transmission electron (bottom) micrographs of
as-built (AB), low-temperature stress-relieved (LTSR), stress-relieved (SR), annealed (A) and solutionized
(S) in the middle of Alloy 625 specimens produced by LPBF. The TEM micrograph for AB (bottom-left)
was reproduced with permission from [8].
The microstructure of the as-built material (AB in Figure 3) was characterized by a very
fine cellular/dendritic structure with grains intercepting several melt pools elongated along the
building direction. Melt pools are clearly visible on the representative OM and SEM micrographs,
characterized by the so-called fish-scale structure. The rapidly solidified AB microstructure is also
characterized by inhomogeneous distribution of the constituting elements of Alloy 625, illustrated
in particular by different contrasts in the SEM micrograph. The finer features of the typical AB
microstructure were evidenced by the high-magnification TEM micrographs in Figure 3. At this
scale, the microstructure exhibited a very fine cellular/dendritic structure, high dislocations density
particularly within interdendritic areas and the presence of very fine Nb-carbides with a size ≤50 nm.
The high density of dislocations is indicative of accommodation for residual thermal stress due to the
rapid cooling and heating cycles inherent to the LPBF process and therefore illustrates the high levels
of strain energy accumulated within the material. This peculiar microstructure is typical of alloys
produced by AM powder bed fusion processes such as LPBF [6,8–10,28–31].
The microstructure of the low-temperature stress-relieved specimen (650 ◦ C, LTSR in Figure 3) was
nearly identical to that of the as-built material. Melt pools, elongated grains, segregation, cellular/dendritic
structure, and high dislocations density were clearly identified. In a previous study [8], hardness values
varied after aging between 600 and 700 ◦ C for 2 h. Although no clear evidence emerged from TEM
observations, the formation of phases such as γ” or δ cannot be excluded at this temperature due to
faster kinetics of precipitation in AM alloys [29,32].
After one hour at the standard temperature of stress-relieve 870 ◦ C (SR in Figure 3), the microstructure
was also similar to that of the reference AB alloy. There was no sign of recrystallization, melt pools
were still clearly visible and the fine dendritic structure was preserved. The dislocations density of SR
in Figure 3 appears slightly lower compared to AB; however, drawing a conclusion is difficult due
to the very small volume of analysis allowed by TEM (~100 µm3 ). Significant precipitation of the
δ-phase has been detected in these conditions similarly to a previous research [10], which is consistent
with the more rapid precipitation kinetics of the δ-phase as a result of segregation mentioned earlier.
δ-phase formation under similar thermal exposure (from 700 to 900 ◦ C) for prolonged times (200 h)
was also reported, revealing that segregations tend to limit its growth [33].
After annealing for 1 h at 980 ◦ C (A in Figure 3), the microstructure exhibited clear differences
with that of AB. While virtually no signs of recrystallization were presently observed (OM and
SEM micrographs in Figure 3), melt pools were barely visible by OM and clearly less pronounced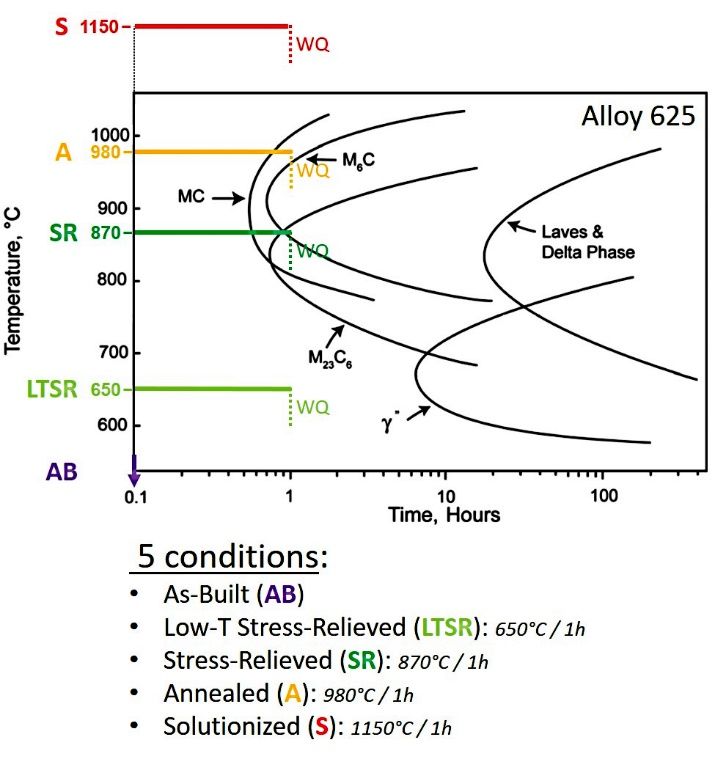
Materials 2020, 13, 4643                                                                             7 of 18

by SEM. The absence of melt pool contours had also been observed in a previous research and
attributed to homogenization [10]. It is believed that melt pools’ boundaries are revealed by chemical
etching due to significantly different concentration of solute elements as a result of the solidification
sequence. Occasional signs of recrystallization were also observed in Reference [10], suggesting that
recrystallization may be promoted at this temperature upon longer exposure. At lower scale, while a
fine dendritic structure could be observed in some location, homogenization was clear, and the dendritic
structure disappeared otherwise. The TEM micrograph (A in Figure 3) highlights the relatively high
dislocations density remaining in spite of the heat treatment, as well as the disappearance of the heavily
segregated and strained interdendritic regions. The presence of fine nanometric Nb-carbides was also
evidenced; however, it was not clear whether nucleation or growth dominated from the AB state.
      On the contrary, the microstructure in the middle of the solutionized alloy (S in Figure 3) exhibited
fully recrystallized equiaxed grains with an approximate grain size of 80 µm and significant amount of
twinning (annealing twins). For this Alloy 625 produced by LPBF, the formation of equiaxed grains
and annealing twins typically occur under high temperatures [8–10,27]. In this case, the S state present
slightly smaller equiaxed grains with respect to the solutionized version performed with a holding
time of 2 h mainly around 90 µm also with a fraction of smaller grains around 10 µm, as reported in a
previous work [8]. A large amount of fine globular precipitates was observed all over the material.
These were identified as Nb-rich MC carbides. Similar NbC precipitates have been reported in Alloy
625 produced by SLM and subjected to solution treatments [8–10,28,34]. The representative TEM
micrograph of the solutionized alloy highlights the recrystallized structure with only a low amount
of dislocations.

3.2. Electron Backscattered Diffraction Analysis
      As mentioned in introduction, electron backscattered diffraction (EBSD) analyses by means of
scanning electron microscopy allows understanding crystallographic aspects of microstructure, such as
the crystallographic orientation. As a consequence, it allows mapping and quantifying, to some extent,
ordering deviations within crystals, more precisely orientation deviations from neighboring points
within grains. Figure 4 shows the Inverse Pole Figure (IPF) maps recorded at the top and in the middle
of all five Alloy 625 specimens produced by LPBF and subjected to the heat treatments considered
(see Figure 1). IPF data show the variations with crystallographic orientations and therefore is a valuable
approach to evaluate texture. It is clear in Figure 4 that, while only the alloy submitted to solutionizing
(S in Figure 4) exhibited a fully recrystallized microstructure with randomly oriented equiaxed grains
and significant twinning (annealing twins), the alloys heat treated at lower temperatures (A, SR and
LTSR in Figure 4) had elongated grains along the building direction oriented preferentially along
, similar to the as-built material (AB in Figure 4). Inserts in Figure 4 clearly highlight texture.
This indicated, in particular, that 1 h at the relatively high temperature of annealing (980 ◦ C) was not
sufficient to promote recrystallization of the as-built Alloy 625 produced by LPBF. Similar results were
obtained in a recent study [10]. There seemed to be little significant difference between the middle and
the top of specimens besides a slightly lower grain size at the latter, processed last.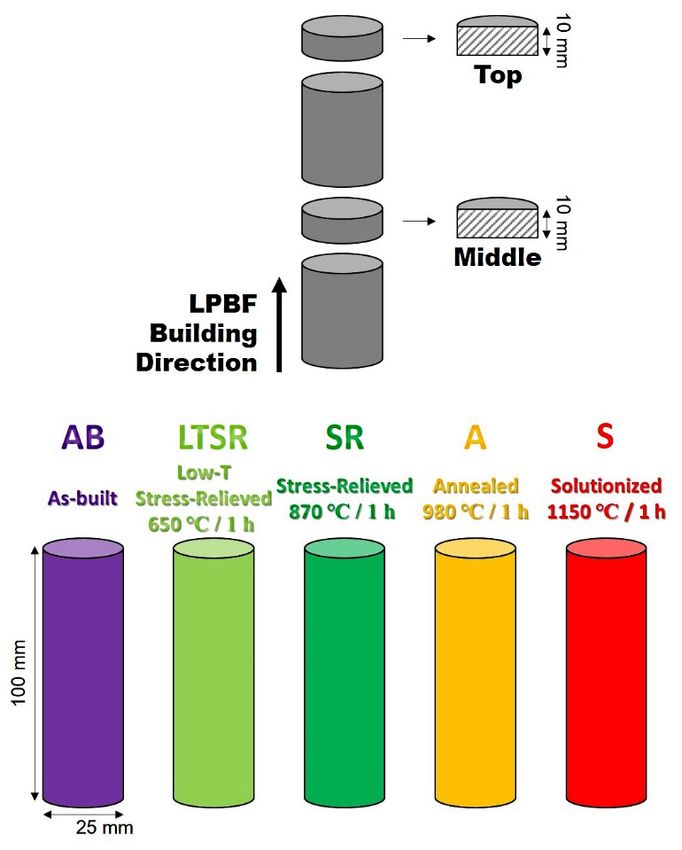
LTSR in Figure 4) had elongated grains along the building direction oriented preferentially along ,
similar to the as-built material (AB in Figure 4). Inserts in Figure 4 clearly highlight texture. This
indicated, in particular, that 1 h at the relatively high temperature of annealing (980 °C) was not
sufficient to promote recrystallization of the as-built Alloy 625 produced by LPBF. Similar results were
obtained in a recent study [10]. There seemed to be little significant difference between the middle and
 Materials 2020, 13, 4643                                                                           8 of 18
the top of specimens besides a slightly lower grain size at the latter, processed last.

     Figure
      Figure4.4.Inverse
                 InversePole
                         PoleFigure
                              Figure(IPF)
                                     (IPF)maps
                                           mapsatatthe
                                                    thetop
                                                        topand
                                                            andininthe
                                                                    themiddle
                                                                        middleofofas-built
                                                                                   as-built(AB),
                                                                                            (AB),low-temperature
                                                                                                  low-temperature
     stress-relieved
      stress-relieved(LTSR),
                      (LTSR),stress-relieved
                               stress-relieved(SR),
                                               (SR),annealed
                                                      annealed(A)(A)and
                                                                     and solutionized
                                                                          solutionized(S)(S)Alloy
                                                                                             Alloy625
                                                                                                    625 specimens
                                                                                                         specimens
     produced
      producedby  byLPBF.
                    LPBF.

      The peculiar processing conditions of innovative LPBF technologies induce steep thermal cycles,
including partial remelting of the underlying consolidated material. This, as mentioned previously,
generates large stresses in the material due to rapid thermal expansion and contraction, which causes
strain [7]. This plastic residual strain in turns manifests within relief of the distortion in the crystal
lattice by the formation of dislocations. An excellent review by Wright et al. [35] explores the use of
EBSD analyses for evaluating strain levels in materials. It suggests, in particular, that, while EBSD
is limited to qualitative analyses, it is a powerful means for visualization of strain, using orientation
imaging microscopy (OIM) maps since dislocations and dislocations density describe plastic strain
levels. As described by Wright et al. [35], the residual strain caused by dislocations forming in the
material is apparent as local lattice orientation variations, which therefore indicate strain distribution
within the material. Figure 5 compares grain average misorientation (GAM, left) and kernel average
misorientation (KAM, right) maps at the top and in the middle of all five Alloy 625 specimens. GAM is
the average misorientation between each neighboring pair of measurement points within the grain.
KAM is the average misorientation between all neighboring points within a defined kernel.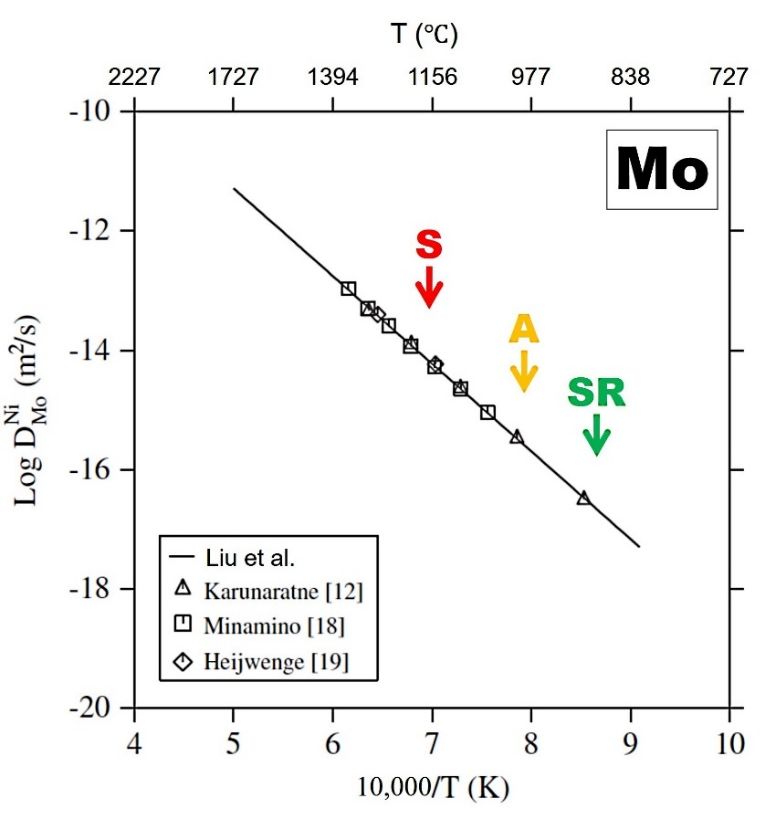
levels. As described by Wright et al. [35], the residual strain caused by dislocations forming in the
material is apparent as local lattice orientation variations, which therefore indicate strain distribution
within the material. Figure 5 compares grain average misorientation (GAM, left) and kernel average
misorientation (KAM, right) maps at the top and in the middle of all five Alloy 625 specimens. GAM
isMaterials
   the average
            2020, 13,misorientation
                      4643          between each neighboring pair of measurement points within the grain.
                                                                                                      9 of 18
KAM is the average misorientation between all neighboring points within a defined kernel.

      Figure5.
     Figure      Grain(left)
              5. Grain   (left)and
                                andkernel
                                    kernel(right)
                                           (right)average
                                                   averagemisorientation
                                                            misorientationmaps
                                                                             mapsatatthe
                                                                                       thetop
                                                                                           topand
                                                                                               andininthe
                                                                                                       themiddle
                                                                                                          middleofof
      as-built (AB),
     as-built   (AB),low-temperature
                        low-temperature stress-relieved (LTSR),
                                            stress-relieved     stress-relieved
                                                             (LTSR),            (SR), annealed
                                                                       stress-relieved          (A) and solutionized
                                                                                         (SR), annealed    (A) and
      (S) Alloy 625 (S)
     solutionized    specimens    produced
                           Alloy 625          by LPBF.
                                       specimens        Averageby
                                                    produced     values
                                                                    LPBF.of kernel average
                                                                             Average         misorientation
                                                                                        values                (KAM)
                                                                                                of kernel average
      are also plotted.
     misorientation    (KAM) are also plotted.

       In Figure
      In  Figure 5,5,the
                       theas-built  material
                             as-built         (AB (AB
                                        material   in Figure    5) exhibited
                                                         in Figure            severe residual
                                                                       5) exhibited     severe strain   levels
                                                                                                 residual       manifested
                                                                                                            strain  levels
 by  large   degree   of   local misorientation     and    illustrated   by  lighter   yellow
manifested by large degree of local misorientation and illustrated by lighter yellow and orange and   orange    regions  in
 both   GAM     and   KAM      maps.     Average    KAM       values   in  Figure   5,  to some
regions in both GAM and KAM maps. Average KAM values in Figure 5, to some extent, representing      extent,  representing
 comparativelythe
comparatively      thelevel
                         levelofofstrain
                                    strain energy
                                         energy     within
                                                  within    thethe  considered
                                                                 considered      region,
                                                                              region,      indicated
                                                                                        indicated       values
                                                                                                    values  wellwell
                                                                                                                  overover
                                                                                                                        0.8
 0.8 degrees.  This  is representative    of heavily  stressed    as-built materials produced     by
degrees. This is representative of heavily stressed as-built materials produced by LPBF, as mentioned LPBF,  as mentioned
 previously. There
previously.    Therewaswasaaslightly
                               slightlyhigher
                                         higherlevel
                                                  levelofofmisorientation
                                                             misorientationdetected
                                                                               detectedatatthe
                                                                                             thetop
                                                                                                  topofofthe
                                                                                                          theas-built
                                                                                                              as-builtbar.
                                                                                                                        bar.
 While   significance   is doubtful   due  to statistical considerations     and  the  relatively
While significance is doubtful due to statistical considerations and the relatively small area     small  area  considered
 by EBSD (approximately
considered                      43,000 µm2 ), similar
               by EBSD (approximately           43,000 results
                                                          µm2), for   the other
                                                                   similar       conditions
                                                                            results  for the bring
                                                                                               otherconfidence.
                                                                                                       conditions On    the
                                                                                                                     bring
                                                                                     ◦
 contrary, after one hour at the solutionizing temperature of 1150 C (S in Figure 5), strain levels
 were much lower (illustrated qualitatively by green regions) with average KAM values approaching
 0.5 degrees. The full recrystallization process is likely responsible for releasing a large amount of
 strain in the material, in particular by accommodating both statistically stored dislocations (SSDs) and
 geometrically necessary dislocations (GNDs). GAM and KAM maps showed similar features at the top
 and in the middle of the cylindrical specimen.
       From Figure 5, the effects of heat treatments at lower temperatures (A, SR and LTSR in Figure 5)
 were more puzzling. As first consideration, there are notable differences between the top and the middle
 of specimens. This is highlighted by the average KAM values bar chart, at the bottom, in Figure 5.
 It also is intuitively observed on both GAM and KAM maps comparing the top and middle regions.
 The top of the samples, regardless of the condition of the specimen, exhibited higher strain levels than
 the middle. The effect of heat treatments at temperatures below recrystallization seems to be more
 impactful in the middle than at the top of the specimens.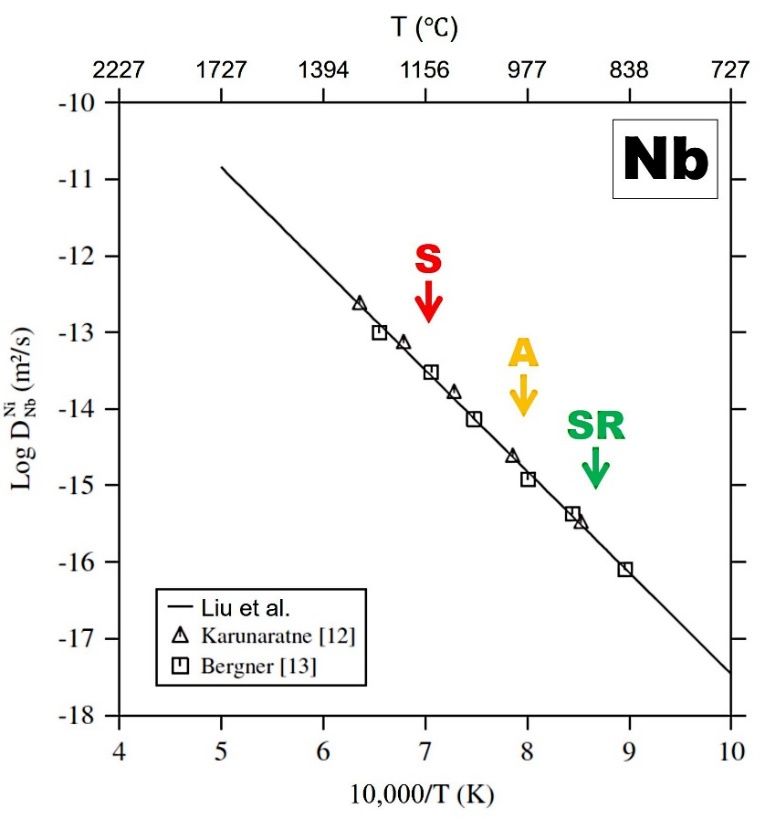
Materials 2020, 13, 4643                                                                             10 of 18

     With considerations to the middle of the cylindrical specimens, the impact of temperature was
surprisingly not clear. All three unrecrystallized materials exhibited similar strain levels with average
KAM values around 0.75 degrees, in spite of significantly different heat-treatment temperatures.
Differently, EBSD results from the top of the specimens subjected to different temperatures suggested,
as one could anticipate, that higher temperature promotes stress-relieving to the point of full
recrystallization at least above 1150 ◦ C. The materials subjected to the low-temperature stress-relieve
heat treatment (LTSR in Figure 5) exhibited strain levels at the top similar to that of the as-built
specimen. Likewise, while recorded values appeared slightly lower, strain levels at the top after
the stress-relieve treatment (SR in Figure 5) were similar to that of the as-built specimen. After heat
treatment at the higher temperature of annealing (A in Figure 5), strain levels at the top were clearly
lower than for the as-built material, with average KAM values below 0.8 degrees. With comparison
to the fully recrystallized materials after solutionizing (S in Figure 5), residual stain levels were still
clearly higher for A, consistent with the fact that recrystallization is most effective for relieving stress.

4. Discussion

4.1. Recrystallization
     The popular Alloy 625 was produced by LPBF and subjected to 1 h–hold heat treatments at
different temperatures. Perhaps the most obvious consideration that can be drawn from the results is
that recrystallization was complete after heat treatment at 1150 ◦ C (S in Figure 1) for 1 h. This was
particularly clear by microscopy (S in Figure 3) and from IPF data (S in Figure 4): The microstructure
after S consisted in fine strain-free equiaxed grains with random orientation. This recrystallization
accommodates the heavily stressed as-built microstructure to resemble the conventional recrystallized
microstructure of its wrought counterpart. Such observation was already mentioned in previous
studies where full recrystallization of Alloy 625 similarly produced by SLM was observed after solution
treatment at the same temperature of 1150 ◦ C for 2 h [8–10]. The present study confirms that 1 h at
1150 ◦ C is sufficient to promote full recrystallization. Figure 6 shows representative SEM and TEM
micrographs of Alloy 625 produced by LPBF and subjected to either the present 1 h–hold at 1150 ◦ C
(S in Figure 6) or a 2 h–hold at 1150 ◦ C (Figure 6a), [8]). In addition, representative SEM and TEM
micrographs of a conventional wrought Alloy 625 [9] subjected to a similar 1 h–hold at 1150 ◦ C were
included in Figure 6b for comparison.
Materials 2020, 13, 4643 11 of 18
Materials 2020, 13, 4643 11 of 17
Figure6.6. SEM
Figure SEM and TEM TEM micrographs
micrographsofofAlloy
Alloy625
625produced
producedbyby
LPBF and
LPBF submitted
and to 1toh–hold
submitted (S) and
1 h–hold (S)
and 2 h–hold
2 h–hold (a) solution
(a) [8] [8] solution treatment
treatment at 1150 ℃;°C;
at 1150 (b) (b) conventional
conventional wrought
wrought andand solutionized
solutionized ℃°C
at 1150
at 1150 for
for
1 h1Alloy
h Alloy
625.625.
Comparing the effect
Recrystallization of theproduced
of metals holding time at temperature
by LPBF between
when subjected 1 and 2 h (S and asolution
to high-temperature in Figure 6,
heat
respectively),
treatments has there
beenseemed
reported to be
for no significant
a wide varietydifference.
of materials.As For
mentioned
example,previously, the alloys
recrystallization was
produced
reported for a 316L stainless steel produced by LPBF and exposed to solution treatment at 1200of°C
by LPBF and subjected to solution treatments clearly exhibited a large number fine
for
globular precipitates, identified as Nb-rich MC carbides, distributed within the γ-matrix.
2 h [16,17]. Recrystallization of a similar alloy 316L produced by LPBF and subjected to only 1100 °C for Although it
has not been appropriately quantified due to length scale considerations, the size distribution
10 min was only observed after laser shot peening [18]. Recrystallization was, in particular, correlated of these
carbides
to higherwas slightly
local larger after
misorientation 2 h after
level than laser
after only
shot 1peening.
h. It could
Thealso be noted thattemperature
recrystallization grain size wasfor
also slightly higher after 2 h (approximate maximum grain size of 90 µm), compared
another LPBF alloy 316L, defined as the temperature at which recrystallization reaches 50% after 1 h, to 1 h–hold
(approximate
was evaluatedmaximum
at 1100 °Cgrain[19]. size of 80 superalloy
An LPBF µm). These wereexhibited
IN718 significantly
fullysmaller than the
recrystallized average
grains after
grain size of a wrought and similarly solutionized alloy at 1150 ◦ C for 1 h (~130 µm), as discussed
solutionizing at 1150 °C for 2 h, while homogenization at the lower temperature of 1065 °C for 1.5 h
in Reference
was found to[9].be Itinsufficient
could be noted here
[20]. In that much
another study,smaller grain
this alloy size,produced
IN718 critical forbyitsLPBF
contribution
exhibitedtoa
much higher of volume fraction of recrystallized grains after a simulated HIP treatment, underMaterials 2020, 13, 4643 12 of 18
strength, is usually observed for conventional wrought Alloy 625 (for example hot-rolled, in absence of
solutionizing), with approximate grain size as low as 15 µm on average [11,13,36,37].
The most significant difference between Alloy 625 produced by LPBF and its conventional
solutionized wrought counterpart in Figure 6b was the significant presence of these Nb-rich MC
carbides. While the wrought material exhibited only a small amount of relatively large solidification
MC precipitates despite the solution treatment (Figure 6b), the volume fraction in the material produced
by LPBF was clearly much higher (S and a in Figure 6). Briefly mentioned earlier in Section 3.1,
the large presence of very fine Nb-carbides with a size ≤50 nm was systematically observed within the
as-built material [8–10]. This contrasts with much larger primary Nb-rich MC carbides precipitated
during solidification and often distributed along the rolling direction in conventional wrought Alloy
625 [11,13,36,37]. As a result, it is reasonable to assume that the very fine Nb-carbides of the as-built
material experienced significant growth during the solution treatment at the relatively low temperature
of 1150 ◦ C. This is consistent with the NbC start precipitation temperature for Alloy 625 reported at
1250 ◦ C by Zhao et al. [38], which contrasts with the TTT diagram for Alloy 625 given in Figure 1 [12,14].
The pinning effect of this fine precipitation may well be an important factor for the relatively low grain
coarsening rate during solution treatment with grains only growing by about 10 µm in diameter as
a result of an additional one-hour hold at temperature. The resulting microstructure after solution
treatment led to tensile properties at room temperature in terms of strength and ductility favorably
comparable to conventional wrought Alloy 625 [8–10].
Recrystallization of metals produced by LPBF when subjected to high-temperature solution heat
treatments has been reported for a wide variety of materials. For example, recrystallization was
reported for a 316L stainless steel produced by LPBF and exposed to solution treatment at 1200 ◦ C for
2 h [16,17]. Recrystallization of a similar alloy 316L produced by LPBF and subjected to only 1100 ◦ C for
10 min was only observed after laser shot peening [18]. Recrystallization was, in particular, correlated
to higher local misorientation level after laser shot peening. The recrystallization temperature for
another LPBF alloy 316L, defined as the temperature at which recrystallization reaches 50% after 1 h,
was evaluated at 1100 ◦ C [19]. An LPBF superalloy IN718 exhibited fully recrystallized grains after
solutionizing at 1150 ◦ C for 2 h, while homogenization at the lower temperature of 1065 ◦ C for 1.5 h
was found to be insufficient [20]. In another study, this alloy IN718 produced by LPBF exhibited a
much higher of volume fraction of recrystallized grains after a simulated HIP treatment, under normal
pressure, at 1160 ◦ C, for 4 h, than after an initial stress relief annealing treatment at 982 ◦ C for 0.5 h,
followed by HIP (1163 ◦ C, 4 h, 100 MPa pressure in Ar) [21]. This alloy, produced by an alternative yet
similar PBF process called laser solid form, also experienced recrystallization after being subjected to a
first solutionizing step at 1100 ◦ C for 1.5 h, with the authors associating inhomogeneous distribution of
recrystallized grains to uneven distribution of residual thermal stress [22]. Superalloy IN939 produced
by LPBF and exposed to 1160 ◦ C for 4 h also exhibited recrystallized grains [23]. Recrystallization and
annealing twins were also reported for a high-γ’ PM superalloy produced by LPBF and subjected
to solutionizing at 1180 ◦ C for 1 h [24]. Recrystallization after LPBF and solution/annealing heat
treatments at sufficiently high temperature was also reported for pure iron [25], titanium [26] and more.
This brief and non-exhaustive review of the literature suggests, in particular, that the residual
stress levels built-up during the LPBF process due to repeated and sharp heating and cooling cycles
promote recrystallization in a large number of metals during solution treatment at a temperature above
the recrystallization temperature of the alloy. This recrystallization temperature usually depends on the
amount of deformation (for example, cold work)—more precisely, strain energy— which the alloy had
been subjected to. In the case of the LPBF process, it suggests that the recrystallization temperature is a
function of the strain levels generated during production. While these strain levels can be controlled,
to some extent, by careful optimization of the processing parameters, it seems that strain in alloys
produced by LPBF approach those of conventionally wrought materials (that is corresponding to about
20% to 30% deformation).Materials 2020, 13, 4643 13 of 18
4.2. Inhomogeneous Distribution of Strain and Role of Heat Treatment
The results presented in Section 3 suggested that residual strain levels are uneven within materials
produced by LPBF. This was clear from the distribution of strain levels (local misorientation levels) in
KAM maps in Figure 5. This can be explained, in particular, by the nature of heat transfers during
production, which depends on the building strategy (scanning path strategy, layer rotation, scanning
speed, overlapping, laser power, etc.). A simplistic view of residual stress formation during LPBF would
be that, due to rapid scanning of the heat source, the abrupt thermal expansion as it approaches and
thermal contraction as it moves away of a given location generate large thermal stresses accommodated
by the formation of dislocations. Transformation stress for some alloys, such as some steels or titanium
alloys, for example, may also be significant. It should be also understood that thermal stresses generated
by the moving heat source also significantly influence the distribution of stress (or strain) along the
building direction. As the production by LPBF proceeds with subsequent layers, the underlying
material already consolidated into shape does receive heat in quantity inversely proportional to the
distance from the heat source. The heat energy provided during the process is often given as the energy
density Ed in J.mm-3, which is a function of the principal process parameters [30]. Not relevant in
the present study, due to consistent cylindrical shape of the as-built specimens, the geometry of the
built parts plays an important role, as well, particularly when considering that heat conduction and
convection varies between powders and dense solids.
This therefore suggests, in simple terms, that not only stress levels and accordingly strain levels
vary along the height of as-built part, but also the nature of the residual stress varies. In their review,
Bartlett and Li [7] reported for example that the top of as-built parts are usually in tension, while the
middle portions are in compression. Moreover, as the process progresses, underlying consolidated
material undergoes some extent of heat treatment, by diffusion from the heat source through the
part, in spite of severe dynamic considerations. It seems therefore reasonable to assume some degrees
of stress relieving, considering, in particular, the mechanism of dislocations recovery, as well as
homogenization despite limited diffusion due to abrupt heating and cooling together with relatively
short effective time at temperature. Additional evidence relies on the slightly larger grain size in
the middle compared to the top, suggesting grain growth was lightly promoted during production.
This is consistent, in particular, with the slight difference in strain levels between the top and the
middle section of as-built materials (AB in Figure 5). It should however be noted that the residual
strain levels “visualized” by EBSD data consist of local misorientation at the microscale level caused,
in particular, by the formation of dislocations to accommodate these thermal stresses. As such,
OIM data, in particular, seem appropriate to evaluate qualitatively the extent of microscopic strain
energy stored within the material due to thermal stresses generated during the process. However, it is
in no way an actual measure of residual stress. This is clear, as from the results in Figure 5 the tensile or
compressive nature of the stored residual stress is unknown. In simple words, OIM data seem to allow
us to visualize the local extent of stress to which the material was subjected to through recording of
misorientation levels caused by the formation of dislocations to accommodate this stress. Lower levels
of local misorientation or strain levels observed in the middle of the cylindrical specimens in Figure 5,
indicating lower residual stress levels, are therefore coherent due to the aforementioned exposure to
heat within the middle regions of parts. This is, however, not counting on the nature (compression or
tension) of residual stress.
LPBF manufacturing is characterized by the sequential selective melting and solidification of very
small volumes of material by the fast scanning laser heat source. This brief input of high-heat energy
leads to abrupt local thermal cycles, which produces rapid thermal expansion and contraction generating
large thermal stresses. The very rapid solidification and heat cycles sequence lead, in particular, to a very
fine cellular/dendritic structure, fine segregation of constituting elements and very high dislocations
density to accommodate rapid solidification and thermal stresses. OIM data obtained by EBSD allow
us to record crystallographic misorientation levels (GAM and KAM data, for example, in Figure 5),
caused, in particular, by the abovementioned dislocations. However, for appropriately good resolutionMaterials 2020, 13, 4643 14 of 18
FE-SEM EBSD measurements, the contribution of punctual crystalline defects (vacancies or more
importantly alloying elements in solution) may well be significant. Since post-processing heat-treatment
temperatures have a major effect on diffusion and solubility within the solid, OIM data might also
return segregation/homogenization levels, which contribute to some extent to local strain energy levels.
OIM data obtained by EBSD, and local misorientation data, in particular, are sensitive to the
presence of dislocations. However, it seems reasonable to assume that the presence of alloying elements
in solution, in particular, large elements such as Nb and Mo, may generate local misorientation
recorded by EBSD, providing sufficient resolution (i.e., high-resolution FE-SEM). Although it is difficult
to confirm, local segregation of elements may influence, to a non-negligible extent, KAM data in
particular. Assuming this conjecture is revealed correct, the effects of homogenization due to different
heat-treatment temperatures should be taken into account. In a previous research study [10], XRD was
used to measure lattice parameter average values of alloys under similar conditions, in order to define
homogenization levels. It was found that increasing temperature promoted homogenization in LBPFed
Alloy 625. Figure 7 shows the diffusion coefficients in Ni of Nb and Mo as reported by Liu et al. [39].
In Figure 7, the corresponding temperatures of the selected heat treatments (S, A and SR in Figure 1)
were indicated. Obviously, diffusion of both Nb and Mo is significantly promoted as temperature
increases. This therefore suggests that the extent of homogenization, larger after heat treatment at
higher temperature, may contribute to the reduction of average KAM values observed in Figure 5.
This also is consistent to the homogenization of the microstructure, melt pool boundaries and heavily
segregated dendritic structures observed for A in Figure 3.Materials
Materials2020,
2020,13,
13,4643
4643 1415ofof17
18
Figure 7. Diffusion coefficients into Ni of Nb and Mo as a function of temperature reported by
Figure 7. Diffusion coefficients into Ni of Nb and Mo as a function of temperature reported by Liu et
Liu et al. [39].
al. [39].
5. Conclusions
5. Conclusions
The popular Alloy 625 was produced by LPBF and the as-built microstructure was compared to
The popular
those obtained Alloy
after 625 was
1 h–hold produced
heat by LPBF
treatments, at theand the as-built
different microstructure
standard temperatures was compared to
of solutionizing
those obtained
◦ after 1 h–hold
◦ heat treatments, at the
◦ different standard temperatures
(1150 C), annealing (980 C), stress-relieve (870 C) and at an experimental low-temperature stress of solutionizing
(1150 °C),
relieve annealing
(650 ◦ C). The(980 °C), stress-relieve
microstructure (870
and its °C) andwere
features at ancharacterized
experimentalatlow-temperature
different lengthstress
scale
relieve (650 °C). The microstructure and its features were characterized at different
by microscopy, and EBSD techniques were used to evaluate local crystallographic misorientation length scale by
microscopy, and EBSD techniques were used to evaluate local crystallographic misorientation
levels associated with residual stress. OIM data obtained from EBSD allowed us to visualize and levels
associated with residual stress. OIM data obtained from EBSD allowed us to visualize and evaluate
local misorientation levels and distribution, which correlated with residual stress formation. WhileMaterials 2020, 13, 4643 16 of 18
evaluate local misorientation levels and distribution, which correlated with residual stress formation.
While EBSD does not return quantitative values of residual stress levels, it allows to investigate
the amount and distribution of strain energy levels caused by crystallographic defects such as
dislocations themselves produced to accommodate the large thermal stresses generated during LPBF.
Above recrystallization at 1150 ◦ C, a strain-free microstructure formed, and most residual stress was
relieved. Below recrystallization, increasing the heat treatments’ temperature promoted dislocation
recovery and homogenization, which clearly contributed to release stress at the top of the cylindrical
specimens. However, the contribution of higher temperatures was less clear in the middle of specimens.
Author Contributions: Conceptualization, M.T., J.L. and G.M.; methodology, M.T. and G.M.; software, M.T.;
validation, M.T., G.M., S.B. and H.-U.H.; formal analysis, M.T. and J.L.; investigation, M.T. and J.L.; resources,
S.B. and H.-U.H.; data curation, M.T. and J.L.; writing—original draft preparation, M.T.; writing—review and
editing, M.T., J.L., G.M., S.B. and H.-U.H.; supervision, M.T.; project administration, M.T.; funding acquisition,
M.T. All authors have read and agreed to the published version of the manuscript.
Funding: This paper was supported by the Changwon National University Research Fund in 2020.
Acknowledgments: The authors would like to acknowledge the Integrated Additive Manufacturing Centre at
Politecnico di Torino (IAM@PoliTo), where the specimens were fabricated.
Conflicts of Interest: The authors declare no conflict of interest. The funders had no role in the design of the
study; in the collection, analyses or interpretation of data; in the writing of the manuscript; or in the decision to
publish the results.
References
1. Murr, L.E.; Martinez, E.; Amato, K.N.; Gaytan, S.M.; Hernandez, J.; Ramirez, D.A.; Shindo, P.W.; Medina, F.;
Wicker, R.B. Fabrication of Metal and Alloy Components by Additive Manufacturing: Examples of 3D
Materials Science. J. Mater. Res. Technol. 2012, 1, 42–54. [CrossRef]
2. Conner, B.P.; Manogharan, G.P.; Martof, A.N.; Rodomsky, L.M.; Rodomsky, C.M.; Jordan, D.C.; Limperos, J.W.
Making sense of 3-D printing: Creating a map of additive manufacturing products and services. Add. Manuf.
2014, 1, 64–76. [CrossRef]
3. Frazier, W.E. Metal Additive Manufacturing: A Review. J. Mater. Eng. Perform. 2014, 23, 1917–1928.
[CrossRef]
4. Gao, W.; Zhang, Y.; Ramanujan, D.; Ramani, K.; Chen, Y.; Williams, C.B.; Wang, C.C.L.; Shin, Y.C.;
Zhang, S.; Zavattieri, P.D. The status, challenges, and future of additive manufacturing in engineering.
Comput. Aided Des. 2015, 69, 65–89. [CrossRef]
5. Gisario, A.; Kazarian, M.; Martina, F.; Mehrpouya, M. Metal additive manufacturing in the commercial
aviation industry: A review. J. Manuf. Sys. 2019, 53, 124–149. [CrossRef]
6. DebRoy, T.; Weia, H.L.; Zubacka, J.S.; Mukherjee, T.; Elmer, J.W.; Milewski, J.O.; Beese, A.M.; Wilson-Heid, A.;
De, A.; Zhang, W. Additive manufacturing of metallic components—Process, structure and properties.
Prog. Mater. Sci. 2018, 92, 112–224. [CrossRef]
7. Bartlett, J.L.; Li, X. An overview of residual stresses in metal powder bed fusion. Add. Manuf. 2019, 27,
131–149. [CrossRef]
8. Marchese, G.; Lorusso, M.; Parizia, S.; Bassini, E.; Lee, J.W.; Calignano, F.; Manfredi, D.; Terner, M.; Hong, H.U.;
Ugues, D.; et al. Influence of heat treatments on microstructure evolution and mechanical properties of
Inconel 625 processed by laser powder bed fusion. Mater. Sci. Eng. A 2018, 729, 64–75. [CrossRef]
9. Lee, J.W.; Terner, M.; Jun, S.Y.; Hong, H.U.; Copin, E.; Lours, P. Heat treatments design for superior
high-temperature tensile properties of Alloy 625 produced by Selective Laser Melting. Mater. Sci. Eng. A
2020, 790, 139720. [CrossRef]
10. Marchese, G.; Parizia, S.; Rashidi, M.; Saboori, A.; Manfredi, D.; Ugues, D.; Lombardi, M.; Hryha, E.;
Biamino, S. The role of texturing and microstructure evolution on the tensile behavior of heat-treated Inconel
625 produced via laser powder bed fusion. Mater. Sci. Eng. A 2020, 769, 138500. [CrossRef]
11. Eiselstein, H.L.; Tillack, D.J. The invention and definition of Alloy 625. In Proceedings of the Superalloys 718,
625 and Various Derivatives, TMS, Pittsburgh, PA, USA, 23–26 June 1991; pp. 1–14. [CrossRef]
12. Floreen, S.; Fuchs, G.E.; Yang, W.J. The metallurgy of Alloy 625. In Proceedings of the Superalloys 718, 625,
706 and Various Derivatives, TMS, Warrendale, PA, USA, 26–29 June 1994; pp. 13–37. [CrossRef]Materials 2020, 13, 4643 17 of 18
13. Smith, G.D.; Tillack, D.J.; Patel, S.J. Alloy 625—Impressive past/significant presence/awesome future.
In Proceedings of the Superalloys 718, 625, 706 and Various Derivatives, TMS, Pittsburgh, PA, USA,
17–20 June 2001; pp. 35–46. [CrossRef]
14. Shoemaker, L.E. Alloys 625 and 725: Trends in properties and applications. In Proceedings of the Superalloys
718, 625, 706 and Various Derivatives, TMS, Pittsburgh, PA, USA, 2–5 October 2005; pp. 409–418. [CrossRef]
15. Callister, W.D.; Rethwisch, G.G. Materials Science and Engineering: An Introduction, 10th ed.; Wiley:
Hoboken, NJ, USA, 2018; pp. 235–239. ISBN 978-1-119-40549-8.
16. Yan, F.; Xiong, W.; Faierson, E.; Olson, G.B. Characterization of nano-scale oxides in austenitic stainless steel
processed by powder bed fusion. Scripta Mater. 2018, 155, 104–108. [CrossRef]
17. Kong, D.; Ni, X.; Dong, C.; Zhang, L.; Man, C.; Cheng, X.; Li, X. Anisotropy in the microstructure and
mechanical property for the bulk and porous 316L stainless steel fabricated via selective laser melting.
Mater. Lett. 2019, 235, 1–5. [CrossRef]
18. Kalentics, N.; Huang, K.; Ortega Varela de Seijas, M.; Burn, A.; Romano, V.; Logé, R.E. Laser shock peening:
A promising tool for tailoring metallic microstructures in selective laser melting. J. Mater. Process. Technol.
2019, 266, 612–618. [CrossRef]
19. Yan, F.; Xiong, W.; Faierson, E.J. Grain Structure Control of Additively Manufactured Metallic Materials.
Materials 2017, 10, 1260. [CrossRef]
20. Li, X.; Shi, J.J.; Cao, G.H.; Russell, A.M.; Zhou, Z.J.; Li, C.P.; Chen, G.F. Improved plasticity of Inconel 718
superalloy fabricated by selective laser melting through a novel heat treatment process. Mater. Des. 2019,
180, 107915. [CrossRef]
21. Amato, K.N.; Gaytan, S.M.; Murr, L.E.; Martinez, E.; Shindo, P.W.; Hernandez, J.; Collins, S.; Medina, F.
Microstructures and mechanical behavior of Inconel 718 fabricated by selective laser melting. Acta Mater.
2012, 60, 2229–2239. [CrossRef]
22. Liu, F.; Lin, X.; Huang, C.; Song, M.; Yang, G.; Chen, J.; Huang, W. The effect of laser scanning path
on microstructures and mechanical properties of laser solid formed nickel-base superalloy Inconel 718.
J. Alloys Compd. 2011, 509, 4505–4509. [CrossRef]
23. Kanagarajah, P.; Brenne, F.; Niendorf, T.; Maier, H.J. Inconel 939 processed by selective laser melting: Effect
of microstructure and temperature on the mechanical properties under static and cyclic loading. Mater. Sci.
Eng. A 2013, 588, 188–195. [CrossRef]
24. Wu, H.; Zhang, D.; Yang, B.; Chen, C.; Li, Y.; Zhou, K.; Jiang, L.; Liu, R. Microstructural evolution and defect
formation in a powder metallurgy nickel-based superalloy processed by selective laser melting. J. Mater.
Sci. Technol. 2020, 46, 7–17. [CrossRef]
25. Song, B.; Dong, S.; Liu, Q.; Liao, H.; Coddet, C. Vacuum heat treatment of iron parts produced by selective
laser melting: Microstructure, residual stress and tensile behavior. Mater. Des. 2014, 54, 727–733. [CrossRef]
26. Li, C.L.; Won, J.W.; Choi, S.W.; Choe, J.H.; Lee, S.; Park, C.H.; Yeom, J.T.; Hong, J.K. Simultaneous achievement
of equiaxed grain structure and weak texture in pure titanium via selective laser melting and subsequent
heat treatment. J. Alloys Compd. 2019, 803, 407–412. [CrossRef]
27. Kreitcberg, A.; Brailovski, V.; Turenne, S. Effect of heat treatment and hot isostatic pressing on the
microstructure and mechanical properties of Inconel 625 alloy processed by laser powder bed fusion.
Mater. Sci. Eng. A 2017, 689, 1–10. [CrossRef]
28. Wang, P.; Zhang, B.; Tan, C.C.; Raghavan, S.; Lim, Y.F.; Sun, C.N.; Wei, J.; Chi, D. Microstructural characteristics
and mechanical properties of carbon nanotube reinforced Inconel 625 parts fabricated by selective laser
melting. Mater. Des. 2016, 112, 290–299. [CrossRef]
29. Lindwall, G.; Campbell, C.E.; Lass, E.A.; Zhang, F.; Stoudt, M.R.; Allen, A.J.; Levine, L.E. Simulation of TTT
Curves for Additively Manufactured Inconel 625. Metall. Mater. Trans. A 2019, 50, 457–467. [CrossRef]
30. Marchese, G.; Colera, X.G.; Calignano, F.; Lorusso, M.; Biamino, S.; Minetola, P.; Manfredi, D. Characterization
and Comparison of Inconel 625 Processed by Selective Laser Melting and Laser Metal Deposition. Adv. Eng.
Mater. 2016, 19, 1600635. [CrossRef]
31. Amato, K.N.; Hernandez, J.; Murr, L.E.; Martinez, E.; Gaytan, S.M.; Shindo, P.W. Comparison of
Microstructures and Properties for a Ni-Base Superalloy (Alloy 625) Fabricated by Electron and Laser
Beam Melting. J. Mater. Sci. Res. 2012, 1, 3–41. [CrossRef]You can also read