A key factor initiating surface ablation of Arctic sea ice: earlier and increasing liquid precipitation - The Cryosphere
←
→
Page content transcription
If your browser does not render page correctly, please read the page content below
The Cryosphere, 13, 1233–1246, 2019
https://doi.org/10.5194/tc-13-1233-2019
© Author(s) 2019. This work is distributed under
the Creative Commons Attribution 4.0 License.

A key factor initiating surface ablation of Arctic sea ice: earlier and
increasing liquid precipitation
Tingfeng Dou1,2 , Cunde Xiao3,2,4 , Jiping Liu5 , Wei Han6 , Zhiheng Du2 , Andrew R. Mahoney7 , Joshua Jones8 , and
Hajo Eicken8
1 College  of Resources and Environment, University of Chinese Academy of Sciences, Beijing 100049, China
2 State Key Laboratory of Cryospheric Sciences, Cold and Arid Regions Environmental and Engineering Research Institute,
Chinese Academy of Sciences, Lanzhou 730000, China
3 State Key Laboratory of Earth Surface Processes and Resource Ecology, Beijing Normal University, Beijing 100875, China
4 Institute of Polar Meteorology, Chinese Academy of Meteorological Sciences, Beijing 100081, China
5 Department of Atmospheric and Environmental Sciences, University at Albany, State University of New York,

Albany, NY, USA
6 Beijing Meteorological Observation Center, Beijing 102600, China
7 Geophysical Institute, University of Alaska Fairbanks, Fairbanks, AK 99775-7320, USA
8 International Arctic Research Center, University of Alaska Fairbanks, Fairbanks, AK 99775-7340, USA

Correspondence: Cunde Xiao (cdxiao@bnu.edu.cn)

Received: 31 October 2018 – Discussion started: 12 November 2018
Revised: 6 February 2019 – Accepted: 11 March 2019 – Published: 15 April 2019

Abstract. Snow plays an important role in the Arctic climate       can further raise water content in the snow layer, prompting
system, modulating heat transfer in terrestrial and marine         onset of the meltwater output phase in the snowpack. First
environments and controlling feedbacks. Changes in snow            spring rainfall in Utqiaġvik has been observed to shift to ear-
depth over Arctic sea ice, particularly in spring, have a strong   lier dates since the 1970s, in particular after the mid-1990s.
impact on the surface energy budget, influencing ocean heat        Early melt season rainfall and its fraction of total annual
loss, ice growth and surface ponding. Snow conditions are          precipitation also exhibit an increasing trend. These changes
sensitive to the phase (solid or liquid) of deposited precip-      of precipitation over sea ice may have profound impacts on
itation. However, variability and potential trends of rain-on-     ice melt through feedbacks involving earlier onset of surface
snow events over Arctic sea ice and their role in sea-ice losses   melt.
are poorly understood. Time series of surface observations
at Utqiaġvik, Alaska, reveal rapid reduction in snow depth
linked to late-spring rain-on-snow events. Liquid precipita-
tion is key in preconditioning and triggering snow ablation        1   Introduction
through reduction in surface albedo as well as latent heat
release determined by rainfall amount, supported by field          Arctic sea ice has been experiencing rapid decline in both
observations beginning in 2000 and model results. Rainfall         extent and thickness in recent decades (Stroeve et al., 2007,
was found to accelerate warming and ripening of the snow-          2012; Comiso and Nishio, 2008). The 10 lowest sea ice ex-
pack, with even small amounts (such as 0.3 mm recorded on          tent anomalies on record have all occurred in recent decades.
24 May 2017) triggering the transition from the warming            Sea-ice thinning trends (Kwok et al., 2009; Kwok and Un-
phase into the ripening phase. Subsequently, direct heat input     tersteiner, 2011) have been associated with first-year sea ice
drives snowmelt, with water content of the snowpack increas-       replacing thicker multi-year sea ice (Maslanik et al., 2007,
ing until meltwater output occurs, with an associated rapid        2011; Giles et al., 2008). These changes make Arctic sea
decrease in snow depth. Rainfall during the ripening phase         ice more susceptible to variations in thermodynamic forc-
                                                                   ings, increasing interannual variability (Kwok et al., 2009;

Published by Copernicus Publications on behalf of the European Geosciences Union.
1234                                                                T. Dou et al.: Earlier and increasing liquid precipitation

Maslanik et al., 2007, 2011; Nghiem et al., 2007; Notz, 2009;      analysed using long-term meteorological records available at
Laxon et al., 2013). Snow over sea ice plays an important          Utqiaġvik, Alaska.
role in the growth and melt of Arctic sea ice (Maykut and
Untersteiner, 1971; Maykut, 1986; Blazey et al., 2013; Per-
ovich and Polashenski, 2012). Snow has a lower thermal con-        2     Data and methodology
ductivity and higher albedo ( ∼ 0.7–0.9 for wet to dry snow)
than sea ice, which limits the absorption of solar energy by       2.1     Data
sea ice as well as by the ocean beneath sea ice (Eicken et
al., 2004; Perovich and Polashenski, 2012). Screen and Sim-        2.1.1    Micrometeorological observations at the MB site
monds (2012) showed that the fraction of Arctic summer pre-
                                                                   A snow and ice mass balance (MB) site has been deployed
cipitation occurring as snow has declined in recent decades
                                                                   on undeformed landfast first-year ice in the Chukchi Sea
due to lower-atmosphere warming, and this change of precip-
                                                                   north of Utqiaġvik since 1990s. At this location the ice is ho-
itation has likely contributed to the decrease in sea ice extent
                                                                   mogeneous, and it forms primarily through in situ freezing
by reducing the area of snow-covered ice and the resulting
                                                                   rather than advection and deformation and provides ice and
surface albedo during summer.
                                                                   snow data representative of level, undeformed ice (Drucken-
   In spring, changes in the amount of snow can either curb
                                                                   miller and Haas, 2009). The relative humidity was measured
or foster sea ice melt. Thick snow helps maintain high sur-
                                                                   with a Campbell CS500 instrument in 2013 and a Campbell
face albedos during the melt season (Eicken et al., 2004) and
                                                                   HMP155A instrument from 2014 to 2016. Air temperature
reduces solar heating of ice and upper ocean (Sturm et al.,
                                                                   was measured 2 m above the ice with a shielded Campbell
2002). In contrast, thin snow melts back earlier in spring and
                                                                   CS500 sensor in 2013 and with a Campbell HMP155A from
promotes the formation of melt ponds (Eicken et al., 2004;
                                                                   2014 to 2016. The shielded Rotronic HC2S3 that measured
Petrich et al., 2012), which absorb approximately 1.7 times
                                                                   air temperature in 2017 also measured relative humidity.
more solar radiation than bare ice and approximately 5 times
                                                                   Wind direction and speed were measured by two R.M. Young
more than cold, snow-covered sea ice (Perovich et al., 2002;
                                                                   and Campbell 5108-L anemometers, one 2.1 m above the ini-
Perovich and Polashenski, 2012; Webster et al., 2014), ac-
                                                                   tial snow surface and the other 4.1 m above the initial snow
celerating ice decay and solar heating of the upper ocean
                                                                   surface. Data were recorded every 15 min and transferred via
in spring.
                                                                   FTP to the University of Alaska Fairbanks, where they were
   Spring snow depth on sea ice is very sensitive to the phase
                                                                   processed (Druckenmiller and Haas, 2009; Eicken et al.,
of precipitation. Solid precipitation increases snow depth,
                                                                   2012). We used the data for 2013–2017 (https://arcticdata.io/
protecting sea ice from melt. Conversely, liquid precipita-
                                                                   catalog/\T1\textbackslash#view/doi:10.18739/A2D08X, last
tion heats the snowpack, changes snow grain morphology
                                                                   access: 15 March 2018).
and lowers albedo, decreasing snow depth. Data from Opera-
tion IceBridge flights (2009–2013) indicate an average snow        2.1.2    Radiation, albedo, surface temperature and snow
depth on Arctic sea ice of ∼ 20 cm (22.2 cm in the west-                    depth near the MB site
ern Arctic and 14.5 cm in the Beaufort and Chukchi seas)
(Webster et al., 2014), which renders the thin sea-ice snow-       From April through June 2017, we conducted radiation and
pack particularly susceptible to earlier surface ablation and      surface albedo measurements near the MB site. The distribu-
shorter duration as a result of liquid precipitation. An assess-   tion of snow depth at this location is the same as that at the
ment based on 37 state-of-the-art climate models indicated         MB site. Radiation was measured using a CNR4 net radiome-
that in the future rain is projected to become the dominant        ter that records the upwelling and downwelling shortwave
form of precipitation over the Arctic region (Bintanja and         and longwave radiation. The surface albedo was derived from
Andry, 2017). Rain-on-snow events over Arctic sea ice are          the upward solar radiation divided by the incident solar radia-
likely to have profound impacts, particularly in late spring       tion. The surface temperature was measured with a SI-111 in-
when the snowpack has warmed. However, to date no such             frared radiometer. The sensors were fixed on a bracket 1.5 m
investigation has been completed over Arctic sea ice.              above the snow surface. Data were recorded every 5 min and
   In order to determine how liquid precipitation affects the      collected by LoggerNet 4.0 (CR1000). Snow depth was mea-
surface ablation of sea ice and to assess its quantitative con-    sured with a Campbell SR50 sonic ranger fixed to a mast ex-
tribution to the reduction in snow depth over sea ice, here,       tending through the ice. The accuracy is about ±1 cm.
we investigate the role of liquid precipitation in initiating
snowmelt and the sea ice ablation season based on field mea-       2.1.3    Air temperature and precipitation at Utqiaġvik
surements in the coastal Chukchi Sea. An energy balance                     WSO AP station
model was adopted to help develop a mechanistic interpre-
tation of the observations. The variability of rain-on-snow        The data analysed here comprise daily precipitation and
events over sea ice and the timing of first spring rain are        snowfall from January 1952 to June 2017 for the Utqiaġvik
                                                                   Weather Service Office airport weather station (WSO AP),

The Cryosphere, 13, 1233–1246, 2019                                                    www.the-cryosphere.net/13/1233/2019/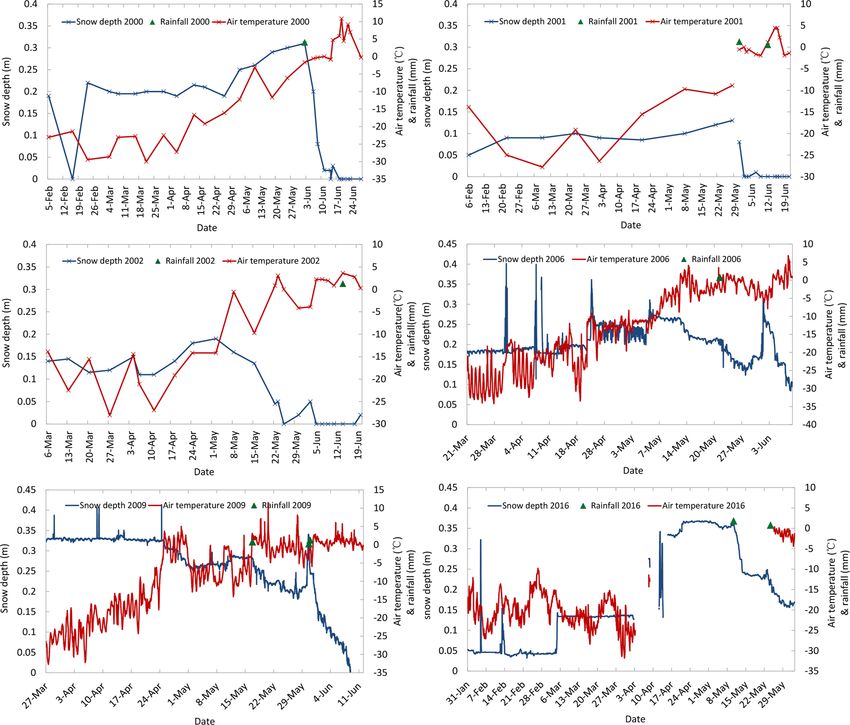
T. Dou et al.: Earlier and increasing liquid precipitation                                                                    1235

located near the coast of the Chukchi Sea at Utqiaġvik               For heat input by rain, two settings need to be considered.
(available from the Alaska Climate Research Center; http:          If rain falls on snowpack that is at the freezing point,
//climate.gi.alaska.edu/acis_data, last access: 2 September
2018). The snowfall data are given as snow water equiva-           R = ρw Cw r (Tr − Tm ) ,                                     (7)
lent (cm w.e.). The snowfall amount is subtracted from the
total precipitation to obtain the rainfall amount (also in units   where Cw is the heat capacity of water in J (kg K)−1 , r is
of cm w.e.).                                                       the rainfall rate (m s−1 ) and Tr is the rain temperature (K).
                                                                   Rain is cooled to the freezing point, giving up sensible heat
2.2     Methodology                                                to warm the snowpack.
                                                                      If rain falls on a snowpack below the freezing point,
2.2.1    Modelling of snow depth, snow density and snow
         water equivalent (SWE)                                    R = ρw Cw r (Tr − Tm ) + ρw Lm r,                            (8)
The surface energy balance for the snowpack overlying sea
ice can be defined as                                              where Lm is the latent heat of fusion in J kg−1 , and Tm is the
                                                                   freezing point in K. Rain first cools to the freezing point, giv-
Qnet = Q∗ + Qs + Ql + C + R,                                (1)    ing up sensible heat. Thereafter the rain will freeze, releasing
                                                                   latent heat, which can heat the snowpack effectively.
where Qnet is the net energy flux at the snowpack on sea ice,         Once the snowpack reaches the warming phase, the pos-
Q∗ is the net radiative flux, Qs is the turbulent sensible heat    itive energy budget is used to melt snow. The amount of
flux, Ql is the turbulent latent heat flux, C is the conductive    snowmelt 1SWE (snow water equivalent in m) was esti-
heat flux and R is the heat input by rain. Each component          mated as
of the surface energy budget is expressed in the unit W m−2 .
The net radiative flux is composed of the net shortwave and        1SWE = −Qnet / (ρw Lm ) ,                                    (9)
longwave components, which are derived from the observed
incoming and outgoing radiative fluxes with a CNR4 net ra-         where Qnet is the net energy flux derived from Eq. (1), and
diometer (see more details in the Data and methodology sec-        ρw denotes water density in kg m−3 .
tion). The sensible heat Qs and latent heat Ql were calculated       The snow density changes were modelled based on
by
                                                                   1ρs = ρs C1 SWE exp (−C2 ρs ) exp(−0.08(T0 −Ta ))1t, (10)
Qs = −ρa cp CH (Ts − Ta ) Vz                                (2)
Ql = −ρa rl CE (qs − qa ) Vz ,                              (3)    where C1 and C2 are empirical coefficients, which are
                                                                   7.0 m−1 h−1 and 21.0 cm3 g−1 according to the field mea-
where Vz is the mean wind speed (m s−1 ) in 1 h at a height z
                                                                   surements in Yen et al. (1981). T0 is the freezing point tem-
and ρa (unit: kg m−3 ) and cp (unit: J (kg K)−1 ) denote the air
                                                                   perature. Here, 1t is equal to 1 h.
density and the specific heat capacity of air. rl is the vapor-
                                                                      The snow depth Hs was modelled by
ization enthalpy. (Ts − Ta ) and (qs − qa ) are the differences
in temperature and specific humidity between the snow sur-                (SWE + 1SWE) ρw
face and atmosphere at the height z. The temperature and           Hs =                   + SWEnew ρw /ρsnew ,                 (11)
                                                                                 ρs
humidity are respectively expressed in the unit K and g m−3 .
   CH and CE are the bulk transfer coefficients estimated          where SWE is snow water equivalent in m, ρs is snow den-
from a simple non-iterative algorithm (Launiainen and              sity in kg m−3 , and SWEnew is new deposited snow in snow
Chengm, 1995) based on the Monin–Obukhov similarity the-           water equivalent (m). The density of new fallen snow ρsnew is
ory.                                                               102 kg m−3 on average derived from the field measurement
   The conductive heat flux C was estimated as                     in Chukchi Sea 2017.
                                                                      The energy required to reach the isothermal state was
C = −k (Ts − Ti ) /Hs                                       (4)
                                                                   calculated according to [ci ρw SWE (Tave − Tm )] by Ding-
k   = 0.138 − 1.01ρs + 3.233ρs2 {0.156 ≤ ρs ≤    0.6}       (5)    man (2015), where CI is the heat capacity of snow or ice
k   = 0.023 − 1.01ρs + 0.234ρs2 {ρs ≤ 0.156} ,              (6)    (2.1 kJ kg−1 ◦ C−1 ), Tave is the average temperature of the
                                                                   snowpack, Tm is the freezing point of snow, ρw is the density
where k is the thermal conductivity of snow in W m−1 K,            of water, and SWE is snow water equivalent in m. The tem-
and Ts is the snow surface temperature in K. The observed          perature profile of the snowpack used to track the timing of
ice surface temperature Ti was applied in this study. Hs is        the isothermal state was measured with a CRREL-designed
snow depth in m. k varies with snow density according to           thermistor string employing Beaded Stream thermistors. The
the regression in Eqs. (5) and (6), as suggested by Sturm          thermistors were spaced 2 cm apart and measure temperature
et al. (2002).                                                     with 0.1 ◦ C accuracy.

www.the-cryosphere.net/13/1233/2019/                                                     The Cryosphere, 13, 1233–1246, 2019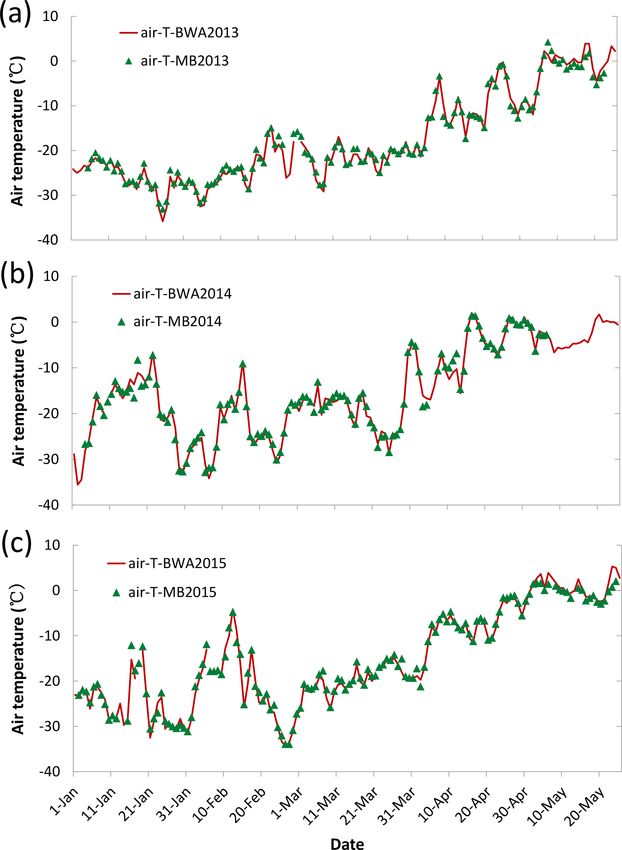
1236                                                                     T. Dou et al.: Earlier and increasing liquid precipitation

Figure 1. Rainfall and variations in air temperature and snow depth recorded near Utqiaġvik, Alaska. The data were observed at the MB site
on Chukchi Sea landfast ice between January and June in 2013, 2014 and 2015. Amount (mm w.e.) and timing of rainfall are indicated by
blue triangles.

2.2.2   Model experiments                                               experiment, we excluded the impacts of rain by lowering
                                                                        albedo and eliminating the latent heat and sensible heat terms
Two experiments were conducted to quantitatively estimate               contributed by rainfall.
the contribution of rain to snow ablation. In the control                  As observed in this study and previous studies, such as
run, we applied the meteorological observations to drive the            Perovich et al. (2002, 2017) and Perovich and Polashen-
model and simulate the snow depth, snow density and SWE.                ski (2012), rain can decrease the surface albedo by ∼ 0.1
These observations include wind, air temperature, relative              within a few hours. This impact on albedo is quite different
humidity, snow surface temperature, upward and downward                 from that of a gradual warming or melting process. The latter
longwave radiation, incoming solar radiation, surface albedo,           needs ∼ 10 days to reduce the albedo by the same amount
rainfall, snowfall, snow temperature and snow–ice interface             (Perovich et al., 2002, 2017). In the sensitivity experiment,
temperature. The measured snow depth and snow density                   we derived an evolutionary sequence of albedo without rain
were used to validate the model results. In the sensitivity             based on a simplifying assumption, in which albedos are lin-

The Cryosphere, 13, 1233–1246, 2019                                                          www.the-cryosphere.net/13/1233/2019/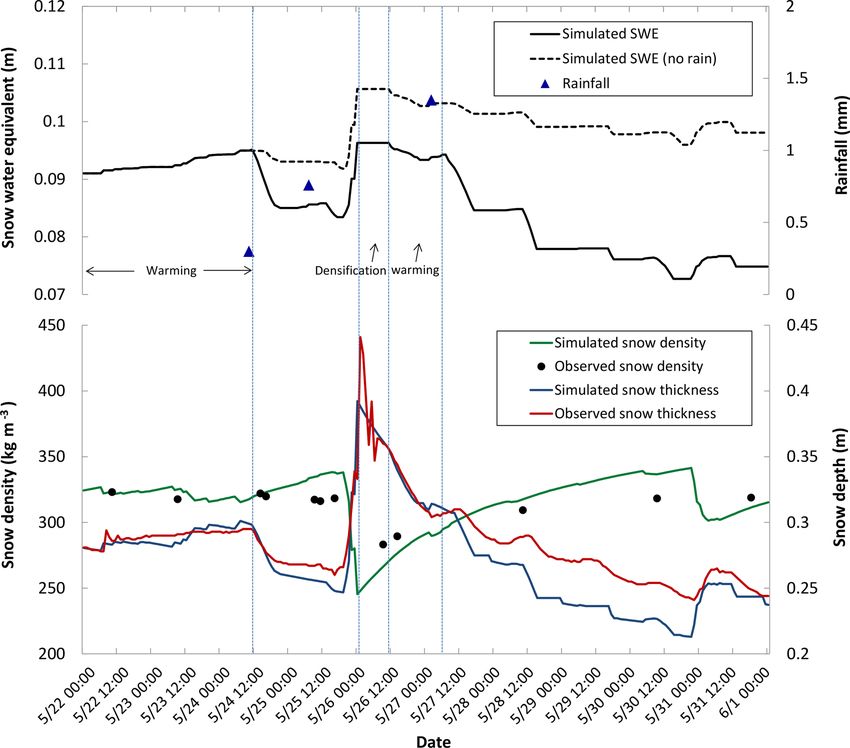
T. Dou et al.: Earlier and increasing liquid precipitation                                                                           1237

Figure 2. Observed air temperature, snow depth and liquid precipitation over coastal Chukchi Sea ice in 2000, 2001, 2002, 2006, 2009, 2016.

early extrapolated based on the observations of the previous            3   Observed evidence of rapid reduction in snow depth
3 days using the method of Perovich et al. (2017) for the                   associated with liquid precipitation
period 24 May–3 June (also see their Figs. 2 and 3). In con-
trast, the control experiment includes all impacts of rainfall          Field measurements at a mass balance site (MB site) on land-
on surface properties and fluxes and therefore draws on the             fast sea ice near Utqiaġvik, Alaska, in April–June from 2013
observed albedo time series from the same period. The ob-               to 2015 revealed rapid declines in snow depth once non-
served downwelling solar irradiance was applied to calculate            freezing rain fell on the snow. Figure 1 shows the variations
the absorbed solar radiation with and without rain.                     of snow depth and surface air temperature observed in 2013–
                                                                        2015. It appears that snow depth on sea ice started to decrease
2.2.3   Significance testing                                            when air temperature rose above the freezing point (0◦ ).
                                                                        Snow depth then decreased sharply and persistently during
We calculated the significance value of a linear trend for              subsequent days (6, 3 and 6 days for 2013, 2014 and 2015, re-
first rainfall date, rainfall in May, total precipitation and rain-     spectively). The change in surface air temperature itself can-
fall : total precipitation ratio in May using Student’s t test.         not explain such rapid reduction in snow depth since surface
The trend is significant when p ≤ 0.05 with 95 % confidence.            air temperature fluctuates above and below the freezing point
                                                                        at this time. Rather, the first non-freezing rain events of the
                                                                        year that were immediately followed by the rapid decrease
                                                                        in snow depth might be responsible for such a phenomenon.
                                                                        Our available observations from prior years at Utqiaġvik and
                                                                        in the ice pack of the Chukchi Sea corroborate these findings
                                                                        (Fig. 2) as do studies suggesting that the transition into the

www.the-cryosphere.net/13/1233/2019/                                                           The Cryosphere, 13, 1233–1246, 2019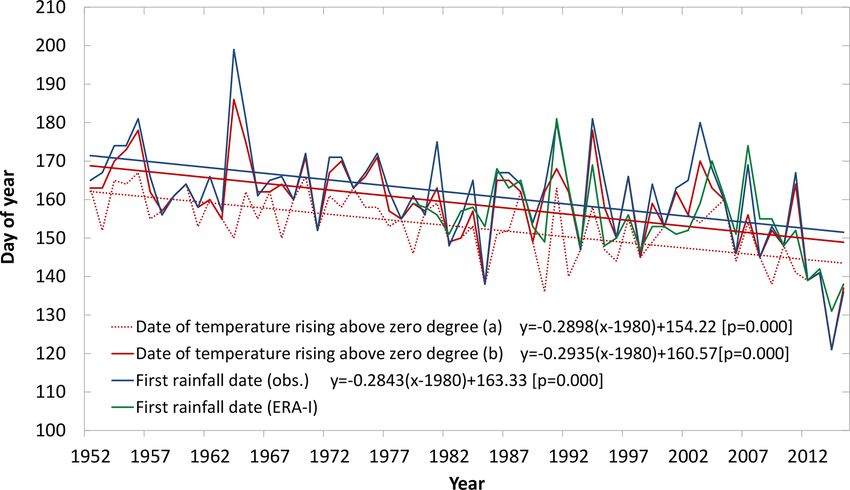
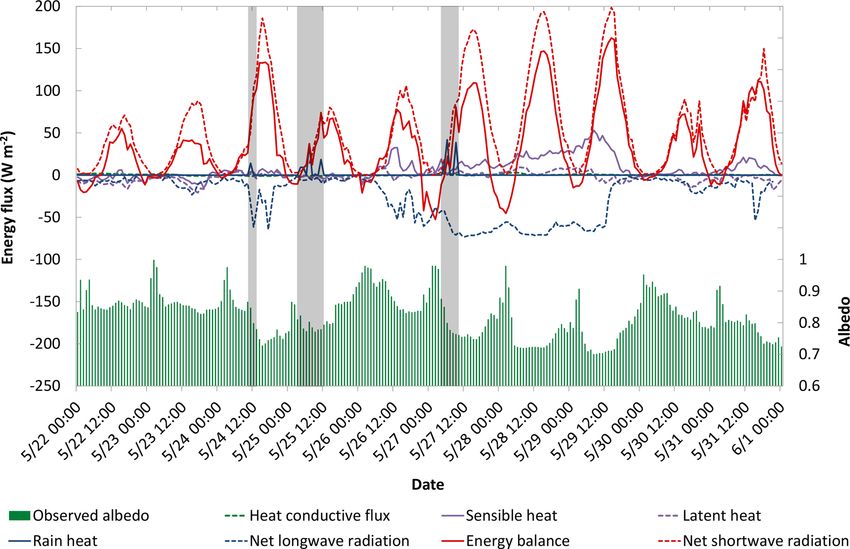
1238                                                                      T. Dou et al.: Earlier and increasing liquid precipitation

Figure 3. Energy balance of snow over sea ice during the early stage of melt season. Observed net solar radiation, albedo, net longwave
radiation and timing of rainfall from 22 May through 1 June 2017 (local time). Calculated sensible heat, latent heat, heat conductive flux and
energy budget during the same period are also shown. Rain heat includes the heat that rain directly brings into the snowpack and the latent
heat release when the rain freezes within the snowpack. Grey shading shows the timing of rainfall.

Figure 4. Observed snow morphology at different depths of the snowpack over ice in the Chukchi Sea north of Utqiaġvik from 23 May
through 27 May 2017. The reference ruler is 0.5 mm long.

The Cryosphere, 13, 1233–1246, 2019                                                            www.the-cryosphere.net/13/1233/2019/
T. Dou et al.: Earlier and increasing liquid precipitation                                                                      1239

Figure 5. Observed and modelled snow density, thickness and snow water equivalent (SWE) at different stages of snowmelt. A sensitivity
experiment without rain was conducted for the same time period, and the corresponding SWE is also shown. Rainfall, snow density and
depth were observed at the surface of Chukchi Sea landfast ice from 22 May through 1 June 2017. A detailed description of the ablation
process is provided in the “Observations and model simulations of key processes” section.

Arctic surface melt season is linked to pronounced synoptic          18 May), with temperatures at or above the freezing point,
events, rather than through gradual heating processes (Alt,          demonstrates that the warming events alone did not result
1987; Persson et al., 1997; Stone et al., 2002; Wang et al.,         in such a rapid decrease in albedo but that liquid precipita-
2005; Sharp and Wang, 2009; Persson and Ola, 2012).                  tion plays a key role. Consistently, two earlier studies also
                                                                     supported that a sharp drop in surface albedo by over 0.05
                                                                     within a single day was associated with a rain-on-snow event,
4   Observations and model simulations of key processes              different from the gradual decline in surface albedo associ-
                                                                     ated with seasonal surface warming and individual warm-
A primary mechanism for the acceleration of surface melt             ing events (Perovich et al., 2002, 2017). Such rapid decrease
and ablation is the rain-induced rapid lowering of surface           in surface albedo may result in a significant increase in the
albedo. In order to evaluate this impact, we conducted field         absorbed shortwave flux. In addition, the rain can directly
measurements of surface albedo in conjunction with charac-           bring heat into the snow layer and heat the snowpack interior
terization of the state of the snow and ice cover on Chukchi         through the release of latent heat during refreezing of rain-
Sea ice in April and June 2017. Observations showed that             water in the early stages of snow warming.
surface albedo decreased sharply on 24, 25 and 27 May by                In order to quantitatively estimate the contribution of liq-
0.12, 0.10 and 0.13, respectively, coinciding with the occur-        uid precipitation towards rapid decreases in snow depth, we
rence of rain-on-snow events (Fig. 3). The observed snow             consider three basic snowmelt phases: warming, ripening and
morphology (Fig. 4) and water content (Table 1) indicated            meltwater output phase (Dingman, 2015). For the warming
significant melt of the snowpack after rainfall for these 3          phase, the absorbed energy raises the average snowpack tem-
days, corresponding to a decrease in snow depth (Fig. 5).            perature to the freezing point and the snowpack becomes
Comparison with the earlier two warming events (15 and               isothermal. Only in an isothermal snowpack is the absorbed

www.the-cryosphere.net/13/1233/2019/                                                       The Cryosphere, 13, 1233–1246, 2019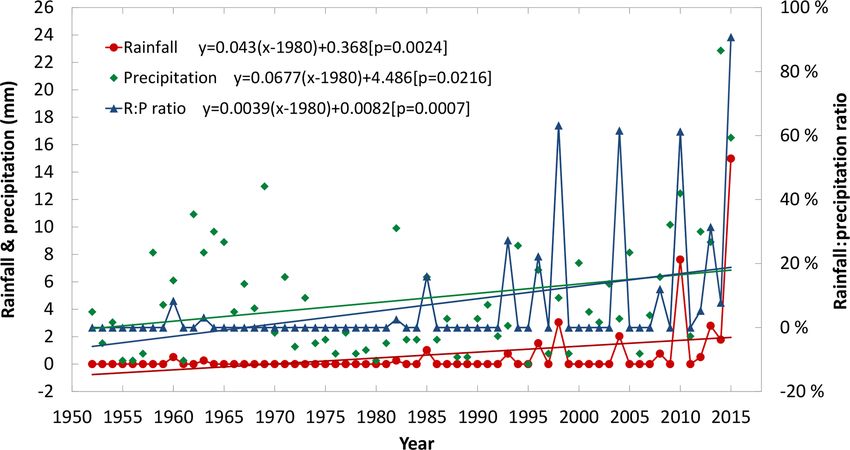
1240                                                                                T. Dou et al.: Earlier and increasing liquid precipitation

Table 1. Water content of snowpack at different depths observed over ice in the Chukchi Sea north of Utqiaġvik during 23 May through
27 May 2017. Units: cm3 water 100 cm−3 snow.

                                                                                Date (local time)
                                                   23 May            24 May                 25 May            26 May           27 May
                            Snow depth (cm)          14:45       14:50      16:55        15:30     17:10         15:30          15:00
                                                        1.7         5.8       5.3          4.8        6.0           2.3          12.3
                                                        1.8         5.8       5.5          5.0        6.0           2.4          12.3
                            2.5
                                                                    5.5       6.4          4.7        5.1           1.9          12.3
                                                                    5.0                    4.4                      2.4          10.4
                                                        3.2         3.5       2.7          5.8                      1.8          11.1
                                                        2.4         3.5       2.8          5.6                      1.4          10.5
                            5.0
                                                        3.6         3.4       3.4          5.8                      1.7           5.5
                                                                    3.7                    5.7                      2.0           6.7
                                                        2.1                   2.7          5.0        4.7           3.8          11.3
                                                        1.7                                5.4        5.1           4.0          10.9
                            7.5
                                                        2.1                                5.4                      4.4
                                                                                           5.7                      5.6
                                                                                           5.9                      4.4           8.7
                                                                                           2.3                      5.3           7.6
                            10.0
                                                                                                                    4.7
                                                                                                                    4.6

Table 2. Components of the surface energy budget, required for the snowpack to reach the isothermal state (warming phase).

  Date                Modelled     Modelled     Modelled      Observe net   Absorbed              Energy      Heat brought           Absorbed     Observed net
                          latent    sensible         heat      longwave          solar          required            into the              solar          solar
                            heat        heat   conductive       radiation    radiation           to reach          snow by            radiation      radiation
                      (KJ m−2 )    (KJ m−2 )         flux      (KJ m−2 )      without     the isothermal     rain (KJ m−2 )              due to     (KJ m−2 )
                                                (KJ m−2 )                         rain               state      (direct heat    reduced albedo
                                                                            (KJ m−2 )          (KJ m−2 )            input +             by rain
                                                                                                                latent heat)         (KJ m−2 )
  24 May 2017 10:00        0.3          2.0         −3.7          −34.6          98.3                                  11.5               22.6          120.8
  24 May 2017 11:00        5.3          7.0         −4.3         −121.8         100.3                                  39.1               85.7          186.0
  24 May 2017 12:00       −1.4         −1.3         −4.4         −222.3         206.5                                   0.0              167.2          373.7
  Total                     4.1          7.7       −12.4         −378.7         405.0             −75.4                50.5              275.5          680.5
  25 May 2017 04:00      −11.5         −9.6         −2.8           −22.0          7.5                                  33.0                6.2            13.7
  25 May 2017 05:00       −5.8         −3.3         −2.4           −15.9         14.9                                  33.0                9.5            24.3
  25 May 2017 06:00        0.1          1.1         −2.6            −1.0         29.9                                   0.0               16.3            46.2
  25 May 2017 07:00       −8.7        −11.3         −2.9           −21.9         25.4                                 131.8               21.4            46.9
  25 May 2017 08:00      −10.4        −14.0         −3.4           −22.4         50.3                                   0.0               43.8            94.1
  Total                  −36.3        −37.1        −14.0           −83.2        128.0            −109.7               197.7               97.1          225.1
  27 May 2017 05:00         8.6        22.2           5.2        −136.9          38.1                                  29.3               26.4           64.5
  27 May 2017 06:00         1.2         2.9           5.8        −163.9          33.7                                 150.5               33.5           67.2
  27 May 2017 07:00         6.7        15.4           5.8        −153.5          99.5                                   0.0               55.8          155.3
  27 May 2017 08:00         7.1        26.0           2.4        −151.7         156.3                                   0.0              118.4          274.7
  27 May 2017 09:00         7.5        24.1           1.4        −188.6         150.9                                 138.7              156.2          307.1
  Total                    31.1        90.6         20.5         −794.5         478.5            −449.5               318.5              390.4          868.9

energy transformed effectively into snowmelt, initiating the                      each component were estimated, to identify the dominant
snowpack ripening phase, which in turn leads into the melt-                       factors governing the warming phase of snowmelt during
water output phase.                                                               three key periods with rainfall occurrence. The first rain-
  Based on our latest and most comprehensive field mea-                           fall in 2017 was recorded as starting at 10:00 on 24 May
surements, the surface energy budget and contribution from                        (the average snow cover temperature was −0.7 ◦ C). The ob-

The Cryosphere, 13, 1233–1246, 2019                                                                           www.the-cryosphere.net/13/1233/2019/
T. Dou et al.: Earlier and increasing liquid precipitation 1241
From the night of 24 May to the morning of 25 May, the
snow temperature fell below the freezing point (−1.0 ◦ C),
and then rainfall occurred at 04:00 on 25 May. The snow
temperature observations demonstrated that the snow layer
reached an isothermal state after 5 h. During this period, the
solar radiation absorbed by the snow cover would have been
128 KJ m−2 if there were no rainfall, which is not enough
to make up for the total energy loss (171 KJ m−2 ) mainly
from the longwave loss (−83 KJ m−2 ) and from sensible
(−36 KJ m−2 ) and latent heat transfer (−37 KJ m−2 ) and
heat conduction (−14 KJ m−2 ). Due to the occurrence of
rainfall and the resulting albedo reduction, the snowpack ab-
sorbed an additional 97 KJ m−2 of solar radiation, and the
rain also brought 198 KJ m−2 into the snowpack, mainly
through latent heat release and direct heat input. Most of
the rain-induced energy transfer was used to warm the snow-
pack; once the snowpack reached the warming phase, the re-
maining energy was used to melt the snow further, pushing
the snowpack into ripening phase.
A heavy snowfall occurred during the evening of 25 May
through the morning of 26 May. A constant SWE and re-
duced snow thickness indicated that there was significant
snow densification during the daytime on 26 May, which
was confirmed by the increase in snow density (Fig. 5). From
the evening of 26 May to the morning of 27 May, the snow
temperature decreased to −2.9 ◦ C. Subsequently, rainfall oc-
curred at 05:00 on 27 May, and the entire snowpack reached
an isothermal state within 5 h after the rainfall, as observed
Figure 6. Comparison of air temperature observed at WSO AP in the snow temperature record. During this period, the heat
(Utqiaġvik Weather Service Office airport weather station) and the loss from longwave radiation was larger than other compo-
MB site during January–June 2013 (a), 2014 (b) and 2015 (c). nents of the heat budget (−795 KJ m−2 ). The absorbed solar
radiation (479 KJ m−2 ), latent heat (31 KJ m−2 ) and sensible
heat (91 KJ m−2 ) were far from enough to offset this part of
the energy budget in the absence of rainfall. The rainfall con-
served snow temperature showed that the upper layers of the tributed 390 KJ m−2 to the energy balance by reducing the
snowpack (16 cm) became isothermal after 2 h. The observed surface albedo and contributed 318 KJ m−2 by bringing heat
snow particle size and water content data indicate that the directly into the snowpack and releasing latent heat (the latter
upper 10 cm began to melt immediately (Fig. 4 and Table 1). accounted for the main contribution).
Interestingly, the modelled shortwave radiation absorbed by The model results shown above demonstrate that liquid
the snow layer without rainfall (405 KJ m−2 ) could offset the precipitation can lead to completion of the warming phase
heat loss (−391 KJ m−2 ) from longwave radiative loss and within several hours, subsequently initiating the melt season
heat conduction, but the residual – which includes latent and (Fig. 5 and Table 2). Once the warming phase is reached,
sensible heat – was too small to increase the temperature of the remaining energy is used to further melt the snow, pro-
the snow layer to the freezing point. During this period, rain ducing significant meltwater flow and contributing to snow-
changed the energy balance, initiating the warming phase of pack ripening, together with the subsequent absorption of so-
snowmelt in two ways: (1) increasing the absorption of solar lar radiation (some of which was also contributed by rain-
radiation (275.47 KJ m−2 ) by lowering surface albedo and on-snow). According to Table 2, the remaining energy was
(2) transferring heat into the snowpack. At the same time, 377 KJ m−2 on 24 May. For this period, 534 KJ m−2 was
such rain events may exceed the storage capacity of water needed to push the snowpack into the ripening phase. The
in the snowpack since the snow temperature was still low at remaining energy contributed substantially to attainment of
this time. As a result, water drains downward, forming ice the ripening phase, which lasted only briefly on 24 May due
layers in the lower part of the snowpack and releasing latent to rapid warming; on 25 May, the remaining energy was
heat (contributing in total 50.5 KJ m−2 ). Therefore, rainfall 143 KJ m−2 , and on 27 May, it was 86 KJ m−2 . Subsequently,
is believed to be the main factor in rapidly warming the snow the absorbed energy drove further snowmelt, with water con-
layer to an isothermal state in this case. tent of the snowpack increasing until meltwater output oc-
www.the-cryosphere.net/13/1233/2019/ The Cryosphere, 13, 1233–1246, 20191242 T. Dou et al.: Earlier and increasing liquid precipitation Figure 7. Timing of air temperature exceeding 0◦ for the first time and the timing of first rainfall in spring at the WSO AP site, 1952–2015. The dashed red line (a) corresponds to the first instance of air temperature above 0 ◦ C. The solid red line (b) indicates the first warming event continuing for at least 4 days. p denotes the significance value of the linear trend. Figure 8. The variation trend of rainfall, total precipitation and R : P ratio at Utqiaġvik for May, 1952–2015. p denotes the significance value of the linear trend. curred, with an associated rapid decrease in snow depth. If tions, in the absence of rain, the snowpack does not undergo rainfall occurs during the ripening phase, it increases wa- such rapid ablation (Fig. 5). ter content in the snow layer, pushing the snowpack into the In addition to the contribution of surface ablation in re- meltwater output phase. This is confirmed by the model sim- ducing snow depth, the physical properties of the snow it- ulations showing that SWE decreased significantly within a self will affect the decrease in snow depth to a certain extent few hours after each rainfall. In the absence of rainfall, warm- when ablation begins. For example, brine may collect at the ing is mostly sluggish, and the snow depth reduction is much surface of the sea ice cover as a result of expulsion through more gradual as snowmelt proceeds, as was the case in 2002 surface cracks (Tucker III et al., 1992) and will wick into (Fig. 2). A comparison of modelled SWE for the cases with the bottom layers of the snowpack through capillary action. and without rainfall demonstrates that in the case in which Consequently, the base of the snowpack can consist of such the longwave radiant flux is kept consistent with the observa- brine-wetted snow (Martin, 1979), with liquid water present The Cryosphere, 13, 1233–1246, 2019 www.the-cryosphere.net/13/1233/2019/
T. Dou et al.: Earlier and increasing liquid precipitation                                                                         1243

                                                                          AP since 1902 with large data gaps prior to 1952. Here we
                                                                          use air temperature and precipitation data from 1952 to 2017.
                                                                          A comparison of surface air temperature between WSO AP
                                                                          and the MB site shows close correspondence (Fig. 6). The
                                                                          amount of liquid precipitation was not recorded at the MB
                                                                          site, but we did record the timing of rainfall on sea ice or
                                                                          at the laboratory near the MB site from April through June
                                                                          in the field expedition of 2015 and 2017. This timing is in
                                                                          good agreement with the records from WSO AP. Hence, me-
                                                                          teorological conditions at WSO AP are representative of the
                                                                          MB site.
                                                                             As shown in Fig. 7, the first rain-on-snow events of the
                                                                          year have been shifted to earlier dates over the past 60 years
                                                                          (2.8 days decade−1 , P < 0.01). This trend towards earlier
                                                                          spring rainfall has been more pronounced since the early
Figure 9. The variation trends of rainfall, snowfall and precipitation    2000s (26.9 days decade−1 during 2000–2015, P < 0.01),
for each month at Utqiaġvik from January 1952 to December 2015.          which is consistent with the accelerated decline of Arctic sea
The trend is characterized by the slope of the linear regression equa-    ice since the early 2000s. Meanwhile, the timing of surface
tion of the time series (− indicates 0.05 significance level or better;   air temperature rising above the freezing point has also been
= indicates 0.02 significance level or better).                           occurring earlier for the past 60 years (3.0 days decade−1 ;
                                                                          P < 0.01; Fig. 7). There is a clear relationship between the
                                                                          timing of first rainfall and the timing of air temperature ris-
even at low temperatures due to the high salinity of the brine            ing above the freezing point (r = 0.66). After removing the
(Geldsetzer et al., 2009). Previous work in the Arctic, includ-           linear trend, the correlation is 0.57 (p < 0.01). On average,
ing at the location studied here, has established that for Arctic         the timing of air temperature rising above the freezing point
snowpack (in contrast with the Antarctic) typically only the              is earlier than the first rainfall event by 9.1 days, suggest-
lowermost centimetres of the snowpack exhibit higher salt                 ing that air temperature exceeding the freezing point is not
content (Domine et al., 2004; Douglas et al., 2012). There-               in and of itself a driver of rain-on-snow events. Further anal-
fore the presence of brine-wetted snow may accelerate the                 ysis indicates that in some years (32 %), after the warming
transition of the lowermost snow layers into the ripening                 events continued for 1–2 days, air temperature dropped again
phase during ablation but does not impact the onset of melt               without occurrence of recorded rainfall. Similarly, warming
in the surface layers of the snowpack.                                    events of 3 days’ duration without rainfall account for 21 %
   In addition, in our field work, we found depth hoar to be              of all cases. Hence, we recalculate the timing of warming
commonly present at the bottom of the snowpack. Depth hoar                events that persisted for at least 4 days. Results show that
is a typical stratigraphic element of the basal layers of the             these two measures of spring warming are highly positively
Utqiaġvik snowpack during the spring season, widely con-                 correlated (r = 0.96). After removing the linear trend, the
firmed in previous studies (e.g. Hall et al., 1986; Domine et             correlation is still strong (r = 0.95, p < 0.01), suggesting
al., 2012). Depth hoar is conducive to discharge of meltwater             that the year-to-year variability of the timing of first spring
and subsidence of the snow cover surface, thereby promot-                 rainfall is closely tied to the timing of persistent warming
ing rapid reduction in snow depth. In theory, the presence of             events (Fig. 7), which might be associated with large-scale
both depth hoar and brine-wetted snow supports the rapid re-              weather events.
duction of snow depth through the process outlined in this                   Prior to the mid-1990s there was almost no rainfall in May
study, though further observations are required to establish              (Fig. 8). Since then, the amount of rainfall has increased, es-
the relative importance of this process.                                  pecially in the past 10 years. Rainfall amount in May has
                                                                          been increasing significantly over the past 60 years (Fig. 9),
                                                                          with a linear trend of 0.43 mm decade−1 during 1952–2015
5   Variability of rain-on-snow events                                    (p < 0.01) and 1.4 mm decade−1 since the mid-1990s (p <
                                                                          0.01). By contrast, the total precipitation did not change sig-
Having demonstrated the profound impact of rainfall on                    nificantly before and after the mid-1990s but has increased
snow depth and ablation, we explore variability in the tim-               substantially over the past few years (Fig. 8). The trend to-
ing of first rain-on-snow events since the start of the avail-            wards higher ratios of rain : total precipitation (R : P ratio)
able record. Due to the lack of long-term continuous obser-               in May has been significant over the past 60 years (0.04
vations over sea ice, we employ observations from Utqiaġvik              per decade; p < 0.01; Fig. 8), especially after the mid-1990s
WSO AP station, which is close to the MB site. Precipita-                 (0.09 per decade; p < 0.01).
tion and surface air temperature have been measured at WSO

www.the-cryosphere.net/13/1233/2019/                                                           The Cryosphere, 13, 1233–1246, 2019
1244 T. Dou et al.: Earlier and increasing liquid precipitation
6 Discussion and conclusions Author contributions. TD, CX, JL and HE jointly conceived the
study and wrote the paper with additional input from WH, ZD, AM
and JJ. AM, HE and TD conceived field measurements and gen-
Snow on sea ice strongly impacts the surface energy bud- erated in situ data and associated products used in this study. TD
get, driving ocean heat loss, ice growth and surface ponding. performed the analyses. All of the authors discussed the results and
While the role of snow depth and snowfall variations is well contributed to interpretations.
understood, this study demonstrated that rain-on-snow events
are a critical factor in initiating the onset of surface melt over
Arctic sea ice, primarily through reduction in surface albedo Competing interests. The authors declare that they have no conflict
as well as latent heat release. By pushing the snowpack into of interest.
the isothermal, ripening and meltwater output phase, liq-
uid precipitation can sharply reduce snow depth and initiate
the onset of rapid surface ablation. The increases in down- Acknowledgements. This study is funded by the National Key Re-
welling longwave fluxes through cloud warming associated search and Development Program of China (2018YFC1406103,
with rainfall events contribute to warming of the snowpack 2018YFA0605901), the National Nature Science Foundation of
China (NSFC 41425003 and 41401079), the key project of
to the melting point but are not sufficient to drive the tem-
CAMS “Research on the key processes of cryospheric rapid
perature of the entire snow layer into an isothermal state on changes” (KJZD-EW-G03-04) and the Climate Program Office,
short timescales. In contrast, the occurrence of liquid precip- NOAA, U.S. Department of Commerce (NA15OAR4310163 and
itation can induce a quick transition of the snow temperature NA14OAR4310216). MB site data at Utqiaġvik were collected
from diurnally varying to an isothermal state. The observa- through support of the U.S. National Science Foundation, grant
tions at Utqiaġvik and in the offshore Chukchi Sea ice pack PLR- 0856867. We thank Chris Polashenski and Nicholas Wright
suggest that at least in some years rain-on-snow events act for providing the snow temperature profile data at the MB site in
as an effective, mostly irreversible trigger for the transition 2017, funded under NSF grant ARC-1603361, the “Snow, Wind and
into the surface ablation season. In cases in which melt onset Time” project.
occurred in the absence of rain, increases in downward long-
wave fluxes largely offset the longwave radiation heat loss of
snow and are thus key to melt initiation (Mortin et al., 2016). Review statement. This paper was edited by John Yackel and re-
However, as shown from our observations and model results, viewed by three anonymous referees.
snowmelt triggered by increases in net longwave radiation
is much slower than that driven by liquid precipitation. This
study deepens the understanding of the trigger mechanism of References
sea ice ablation, which is helpful in improving the modelling
Alt, B. T.: Developing synoptic analogs for extreme mass balance
and seasonal prediction of Arctic sea ice extent.
conditions on Queen Elizabeth Island ice caps, J. Clim. Appl.
This study assembles process studies and long-term ob- Meteor., 26, 1605–1623, 1987.
servations at an important coastal site in North America for Bintanja, R. and Andry, O.: Towards a rain-dominated Arctic, Nat.
the first time, showing that onset of spring rainfall over sea Clim. Change., 7, 263–267, 2017.
ice has shifted to earlier dates since the 1970s, in particu- Blazey, B. A., Holland, M. M., and Hunke, E. C.: Arctic Ocean
lar since the mid-1990s. Early melt season rainfall and its sea ice snow depth evaluation and bias sensitivity in CCSM, The
fraction of total annual precipitation also exhibit an increas- Cryosphere, 7, 1887–1900, https://doi.org/10.5194/tc-7-1887-
ing trend. Based on the observational evidence and model 2013, 2013.
results, we speculate that earlier and increasing liquid pre- Comiso, J. C. and Nishio, F.: Trends in the sea ice cover
cipitation leads to earlier and more rapid melt of snowpack using enhanced and compatible AMSR-E, SSM/I,
over sea ice, allowing for earlier formation of melt ponds. and SMMR data, J. Geophys. Res., 113, C02S07,
https://doi.org/10.1029/2007JC004257, 2008.
This strengthens the ice–albedo feedback, leading to greater
Dingman, S. L.: Physical hydrology, 3rd edition, Waveland Press,
ice mass loss in summer (Perovich et al., 1997; Stroeve et al., Inc. 223–226, 2015.
2014), with the resulting thinner ice in turn reducing the ice Domine, F., Sparapani, R., Ianniello, A., and Beine, H. J.: The ori-
pack in September (Notz, 2009). This inference needs further gin of sea salt in snow on Arctic sea ice and in coastal regions,
confirmation in future studies. Atmos. Chem. Phys., 4, 2259–2271, https://doi.org/10.5194/acp-
4-2259-2004, 2004.
Domine, F., Gallet, J. C., Bock, J., and Morin, S.: Structure,
Data availability. The micrometeorological observations (air tem- specific surface area and thermal conductivity of the snow-
perature, relative humidity) at the MB site data can be accessed at pack around Barrow, Alaska, J. Geophys. Res., 117, D00R14,
https://doi.org/10.18739/A2D08X (Eicken, 2016). Air temperature https://doi.org/10.1029/2011JD016647, 2012.
and precipitation at Utqiaġvik WSO AP station are available from Douglas, T. A., Domine, F., Barret, M., Anastasio, C., Beine, H. J.,
the Alaska Climate Research Center at http://climate.gi.alaska.edu/ Bottenheim, J., Grannas, A., Houdier, S., Netcheva, S., Row-
acis_data (last access: 2 September 2018). land, G., Staebler, R., and Steffen, A.: Frost flowers grow-
The Cryosphere, 13, 1233–1246, 2019 www.the-cryosphere.net/13/1233/2019/T. Dou et al.: Earlier and increasing liquid precipitation 1245 ing in the Arctic ocean-atmosphere-sea ice-snow interface: Mortin, J., Svensson, G., Graversen, R. G., Kapsch, M. L., Stroeve, 1. Chemical composition, J. Geophys. Res., 117, D00R09, J. C., and Boisvert, L. N.: Melt onset over Arctic sea ice con- https://doi.org/10.1029/2011JD016460, 2012. trolled by atmospheric moisture transport, Geophys. Res. Lett., Druckenmiller, M. L. and Haas, C.: Integrated Ice Observation Pro- 43, 6636–6642, 2016. grams, Book Chapter, Sea-Ice Handbook, edited by: Eicken, H., Nghiem, S. V., Rigor, I. G., Perovich, D. K., Clemente-Colón, University of Alaska Press, 2009. P., Weatherly, J. W., and Neumann, G.: Rapid reduction of Eicken, H.: Automated ice mass balance site (SIZONET), Arctic Arctic perennial sea ice, Geophys. Res. Lett., 34, L19504, Data Center, https://doi.org/10.18739/A2D08X, 2016. https://doi.org/10.1029/2007GL031138, 2007. Eicken, H., Grenfell, T. C., Perovich, D. K., Richter-Menge, J. Notz, D.: The future of ice sheets and sea ice: Between reversible re- A., and Frey, K.: Hydraulic controls of summer Arc- treat and unstoppable loss, P. Natl. Acad. Sci. USA, 106, 20590– tic pack ice albedo, J. Geophys. Res., 109, C08007, 20595, 2009. https://doi.org/10.1029/2003JC001989, 2004. Perovich, D. K. and Polashenski, C.: Albedo evolution of Eicken, H., Gradinger, R., Heinrichs, T., Johnson, M. A., Love- seasonal Arctic sea ice, Geophys. Res. Lett., 39, L08501, craft, A. L., and Kaufman, M.: Automated ice mass balance https://doi.org/10.1029/2012GL051432, 2012. site (SIZONET), UCAR/NCAR – CISL – ACADIS, Dataset, Perovich, D. K., Bruce, C. E., and Richter-Menge, J. A.: Observa- https://doi.org/10.5065/D6MW2F2H, 2012. tions of the annual cycle of sea ice 824 temperature, Geophys. Geldsetzer, T., Langlois, A., and Yackel, J. J.: Dielectric properties Res. Lett., 24, 555–558, 1997. of brine-wetted snow on first-year sea ice, Cold Reg. Sci. Tech- Perovich, D. K., Grenfell, T. C., Light, B., and Hobbs, P. V.: Sea- nol., 58, 47–56, 2009. sonal evolution of the albedo of multiyear Arctic sea ice, J. Geo- Giles, K. A., Laxon, S. W., and Ridout, A. L.: Circumpo- phys. Res., 107, 8044, https://doi.org/10.1029/2000JC000438, lar thinning of Arctic sea ice following the 2007 record 2002. ice extent minimum, Geophys. Res. Lett., 35, L22502, Perovich, D., Polashenski, C., Arntsen, A., and Stwertka, C.: https://doi.org/10.1029/2008GL035710, 2008. Anatomy of a late spring snowfall on sea ice, Geophys. Res. Hall, D. K., Chang, A. T. C., and Foster, J. L.: Detection of the Lett., 44, 2802–2809, https://doi.org/10.1002/2016GL071470, depth-hoar layer in the snow-pack of the Arctic coastal plain of 2017. Alaska, U.S.A, using satellite data, J. Glaciol., 32, 87–94, 1986. Persson, P. and Ola, G.: Onset and end of the summer melt season Kwok, R. and Untersteiner, N.: The thinning of Arctic sea ice, Phys. over sea ice: thermal structure and surface energy perspective Today, 64, 36–41, 2011. from SHEBA, Clim. Dynam., 39, 1349–1371, 2012. Kwok, R., Cunningham, G. F., Wensnahan, M., Rigor, I., Zwally, Persson, P., Ola, G., Ruffieux, D., and Fairall, C. W.: Recalculations H. J., and Yi, D.: Thinning and volume loss of the Arctic of pack ice and lead surface energy budgets during LEADEX 92, Ocean sea ice cover: 2003–2008, J. Geophys. Res., 114, C07005, J. Geophys. Res., 102, 25085–25089, 1997. https://doi.org/10.1029/2009JC005312, 2009. Petrich, C., Eicken, H., Polashenski, C. M., Sturm, M., Launiainen, J. and Chengm B. A.: simple non-iterative algorithm Harbeck, J. P., Perovich, D. K., and Finnegan, D. C.: for calculating turbulent bulk fluxes in diabatic conditions over Snow dunes: A controlling factor of melt pond distribu- water, snow/ice and ground surface, Rep. Ser. Geophys., 33, p. tion on Arctic sea ice, J. Geophys. Res., 117, C09029, 16, 1995. https://doi.org/10.1029/2012JC008192, 2012. Laxon, S. W., Giles, K. A., Ridout, A. L., Wingham, D. J., Screen, J. A. and Simmonds, I.: Declining summer snow- Willatt, R., Cullen, R., Kwok, R., Schweiger, A., Zhang, fall in the Arctic: Causes, impacts and feedbacks, Clim. Dynam., J., Haas, C., Hendricks, S., Krishfield, R., Kurtz, N., Far- 38, 2243–2256, 2012. rell, S., and Davidson, M.: CryoSat-2 estimates of Arctic sea Sharp, M. and Wang, L.: A five-year record of summer melt on ice thickness and volume, Geophys. Res. Lett., 40, 732–737, Eurasian Arctic ice caps, J. Climate, 22, 133–145, 2009. https://doi.org/10.1002/grl.50193, 2013. Stone, R. S., Dutton, E. G., Harris, J. M., and Longenecker, Martin, S.: A field study of brine drainage and oil entrapment in D.: Earlier spring snowmelt in northern Alaska as an in- first-year sea ice, J. Glaciol., 22, 473–502, 1979. dicator of climate change, J. Geophys. Res., 107, 4089, Maslanik, J., Drobot, S., Fowler, C., Emery, W., and Barry, R.: https://doi.org/10.1029/2000JD000286, 2002. On the Arctic climate paradox and the continuing role of atmo- Stroeve, J., Holland, M. M., Meier, W., Scambos, T., and Serreze, spheric circulation in affecting sea ice conditions, Geophys. Res. M.: Arctic sea ice decline: Faster than forecast, Geophys. Res. Lett., 34, L03711, https://doi.org/10.1029/2006GL028269, 2007. Lett., 34, L09501, https://doi.org/10.1029/2007GL029703, 2007. Maslanik, J., Stroeve, J., Fowler, C., and Emery, W.: Distribution Stroeve, J. C., Holland, M. M., Kay, J. E., Malanik, J., and Barrett, and trends in Arctic sea ice age through spring 2011, Geophys. A. P.: The Arctic’s rapidly shrinking sea ice cover: A research Res. Lett., 38, L13502, https://doi.org/10.1029/2011GL047735, synthesis, Clim. Change, 110, 1005–1027, 2012. 2011. Stroeve, J. C., Markus, T., Boisvert, L., Miller, J., and Barrett, A.: Maykut, G. A.: The surface heat and mass balance, in: The geo- Changes in Arctic melt season and implications for sea ice loss, physics of sea ice, edited by: Untersteiner, N., New York, Plenum Geophys. Res. Lett., 41, 1216–1225, 2014. Press, 395–463, 1986. Sturm, M., Perovich, D. K., and Holmgren, J.: Thermal Maykut, G. A. and Untersteiner, N.: Some results from a time de- conductivity and heat transfer through the snow on the pendent thermodynamic model of sea ice, J. Geophys. Res., 76, ice of the Beaufort Sea, J. Geophys. Res., 107, 8043, 1550–1575, 1971. https://doi.org/10.1029/2000JC000409, 2002. www.the-cryosphere.net/13/1233/2019/ The Cryosphere, 13, 1233–1246, 2019
1246                                                                   T. Dou et al.: Earlier and increasing liquid precipitation

Tucker III, W. B., Perovich, D. K., Gow, A. J., Weeks, W. F., and     Webster, M. A., Rigor, I., Nghiem, S. V., Kurtz, N. T., Farrell,
  Drinkwater, M. R.: Physical properties of sea ice relevant to re-     S. L., Perovich, D. K., and Sturm, M.: Interdecadal changes in
  mote sensing, in: Microwave Remote Sensing of Sea Ice, edited         snow depth on Arctic sea ice, J. Geophys. Res., 119, 5395–5406,
  by: Carsey, F., Geophysical Monograph, American Geophysical           https://doi.org/10.1002/2014JC009985, 2014.
  Union, 9–28, Chapter 2, 1992.                                       Yen, Y.: Review of thermal properties of snow, ice and sea ice, US
Wang, L., Sharp, M. J., Rivard, B., Marshall, S., and                   Army Cold Regions Research and Engineering Laboratory, Re-
  Burgess, D.: Melt season duration on Canadian Arctic                  port 81–10, Hanover, NH, USA, 1981.
  ice caps, 2000–2004, Geophys. Res. Lett., 32, L19502,
  https://doi.org/10.1029/2005GL023962, 2005.

The Cryosphere, 13, 1233–1246, 2019                                                        www.the-cryosphere.net/13/1233/2019/
You can also read