Local-scale variability of seasonal mean and extreme values of in situ snow depth and snowfall measurements
←
→
Page content transcription
If your browser does not render page correctly, please read the page content below
The Cryosphere, 15, 4625–4636, 2021
https://doi.org/10.5194/tc-15-4625-2021
© Author(s) 2021. This work is distributed under
the Creative Commons Attribution 4.0 License.

Local-scale variability of seasonal mean and extreme values
of in situ snow depth and snowfall measurements
Moritz Buchmann1,3 , Michael Begert2 , Stefan Brönnimann3,4 , and Christoph Marty1
1 WSL    Institute for Snow and Avalanche Research SLF, Davos, Switzerland
2 Federal  Office of Meteorology and Climatology (MeteoSwiss), Zurich, Switzerland
3 Oeschger Centre for Climate Change Research, University of Bern, Bern, Switzerland
4 Institute of Geography, University of Bern, Bern, Switzerland

Correspondence: Moritz Buchmann (moritz.buchmann@slf.ch)

Received: 20 April 2021 – Discussion started: 30 April 2021
Revised: 12 July 2021 – Accepted: 8 September 2021 – Published: 30 September 2021

Abstract. Daily measurements of snow depth and snow-                dates are rather small (3 d) and similar to the ones found for
fall can vary strongly over short distances. However, it is         snow onset dates (2 d). An analysis of potential sunshine du-
not clear if there is a seasonal dependence in these varia-         ration could not explain the higher variabilities in spring. To
tions and how they impact common snow climate indicators            analyse the impact of local-scale variations on the estima-
based on mean values, as well as estimated return levels of         tion of extreme events, 50-year return levels were quantified
extreme events based on maximum values. To analyse the              for maximum snow depth and maximum 3 d new snow sum,
impacts of local-scale variations we compiled a unique set          which are often used for avalanche prevention measures. The
of parallel snow measurements from the Swiss Alps con-              found return levels are within each other’s 95 % confidence
sisting of 30 station pairs with up to 77 years of parallel         intervals for all (but three) station pairs, revealing no strik-
data. Station pairs are usually located in the same villages        ing differences. The findings serve as an important basis for
(or within 3 km horizontal and 150 m vertical distances).           our understanding of variabilities of commonly used snow
Investigated snow climate indicators include average snow           indicators and extremal indices. Knowledge about such vari-
depth, maximum snow depth, sum of new snow, days with               abilities in combination with break-detection methods is the
snow on the ground, days with snowfall, and snow onset and          groundwork in view of any homogenization efforts regarding
disappearance dates, which are calculated for various sea-          snow time series.
sons (December to February (DJF), November to April (ND-
JFMA), and March to April (MA)). We computed relative
and absolute error metrics for all these indicators at each sta-
tion pair to demonstrate the potential variability. We found        1   Introduction
the largest relative inter-pair differences for all indicators in
spring (MA) and the smallest in DJF. Furthermore, there is          Snow, in all its forms, is of great social and environmental
hardly any difference between DJF and NDJFMA, which                 importance. Implications can be found in many fields as di-
show median variations of less than 5 % for all indicators.         verse as ecology, climatology, hydrology, tourism, and natu-
Local-scale variability ranges between less than 24 % (DJF)         ral hazards. All measurements of snow cover are dependent
and less than 43 % (MA) for all indicators and 75 % of all          on the local characteristics of the site: i.e. exposure to wind or
station pairs. The highest percentage (90 %) of station pairs       solar radiation. Furthermore, nearby buildings or trees may
with variability of less than 15 % is observed for days with        have an impact on the measured snow quantities. In an ideal
snow on the ground. The lowest percentage (30 %) of station         world this would not matter, as basic guidelines (e.g. World
pairs with variability of less than 15 % is observed for aver-      Meteorological Organization, 2018) recommend measuring
age snow depth. Median differences of snow disappearance            snow in a flat, not-wind-exposed measurement field, which
                                                                    is at least at the same distance from a building or tree as

Published by Copernicus Publications on behalf of the European Geosciences Union.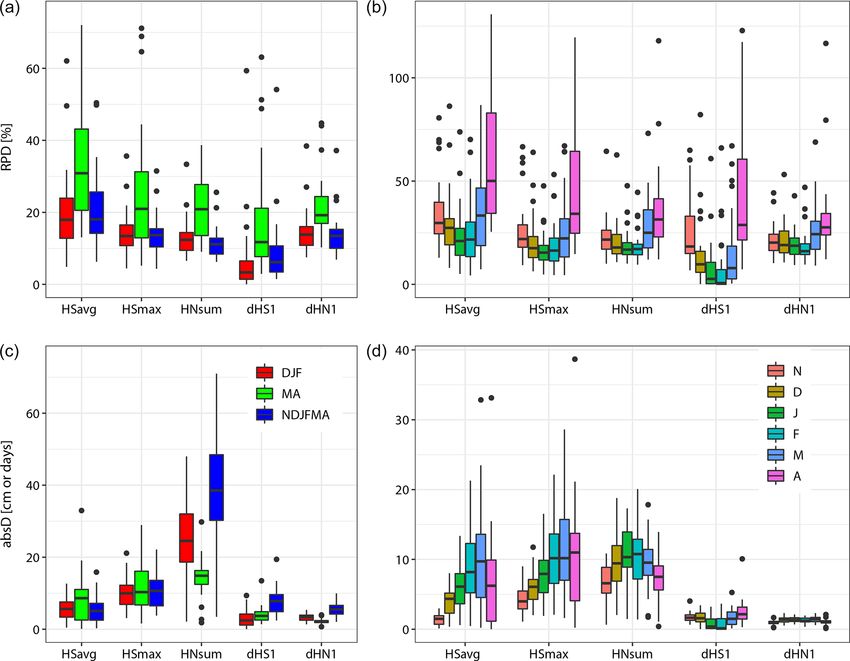
4626                                                               M. Buchmann et al.: Local-scale variability of seasonal mean

the height of the obstacle. In reality, manual measurement                 3. What is the impact of the local bias on return levels
locations sometimes do not fulfil these basic requirements                    based on a commonly calculated return period of ex-
for many reasons, such as the availability of suitable terrain                treme events? Such values and their uncertainties are of-
and observers or easy access to the site. Due to this fact, the               ten used to answer engineering questions for prevention
variability of the measured snow quantities on the 1 km scale                 measures (Sect. 4.5).
(i.e. next to an open field) may be smaller than the variability
                                                                         The paper is organized as follows: Sect. 2 introduces the
on the 10 m scale (e.g. south or north of a house). In the-
                                                                       data set, Sect. 3 covers the statistical methods used for the
ory, this bias introduced by sometimes-not-ideal measuring
                                                                       analyses, results are presented and discussed in Sect. 4, and
locations that may be season dependent as we hypothesize
                                                                       conclusions are drawn in Sect. 5.
that the wind impact is mostly relevant during the accumu-
lation season (availability of loose snow) and the solar im-
pact during the ablation season (more available melt energy).          2    Data
The knowledge about such a possible seasonally dependent
bias is important, as it helps to understand existing inhomo-          Our data consist of daily manually measured snow depth
geneities. Furthermore, this information is invaluable in view         (HS) and height of new snow (HN) maintained by two
of homogenization efforts of snow data series.                         separate institutions in Switzerland: Institute for Snow and
   Moreover, climatological applications and studies usually           Avalanche Research (SLF) and the Federal Office for Mete-
focus either on the meteorological winter DJF (Scherrer and            orology and Climatology (MeteoSwiss). HS measurements
Appenzeller, 2006) or on the 6 months NDJFMA (Marcol-                  are taken from a fixed graduated stake, and HN measure-
ini et al., 2017). However, winter in the Alps is not sim-             ments are taken from a board on top of the previous day’s
ply restricted to these 3 or 6 months. In contrast, for many           snow cover every morning at 06:00 UTC at least between
ecological and hydrological applications, the melting spring           November and April (for details refer to Haberkorn, 2019,
snow cover is the main interest (Brown and Robinson, 2011;             and Buchmann et al., 2021a). To obtain parallel series, sta-
Livensperger et al., 2016; Zampieri et al., 2015) and for some         tion pairs were constructed by combining stations into pairs
applications even the onset of the snow cover (Roland et               which are located within a distance of 3 km horizontally and
al., 2021). We therefore analyse the variations of important           150 m vertically of each other. The mean horizontal (verti-
and commonly used snow climate indicators for seasonal ef-             cal) distance in the data set is 1 km (50 m). Most, but not all,
fects. Additionally, snow onset and disappearance dates are            pairs consist of one SLF and one MeteoSwiss station. The
introduced, as they are important for snow phenology, which            so-defined set consists of 30 (24 for HN) station pairs be-
is especially crucial for ecological purposes (Vorkauf et al.,         tween 490 and 1770 m a.s.l. with complete data between Oc-
2021).                                                                 tober and May (September and June in extreme cases). The
   Using and extending the data set of parallel time series            set includes one station pair with 77 years of parallel data
introduced by Buchmann et al. (2021a) in the available num-            (1944–2020) and 10 station pairs with more than 50 years of
ber of stations, months, and years enables the investigation           parallel data, and it incorporates a total of 1338 station years,
of the impact of the above-mentioned bias introduced by                covering the time period from 1944 to 2020. However, not all
sometimes-not-ideal measuring locations, hereafter referred            station pairs cover the same length. Table A1 shows the var-
to as “local bias” or variability. Investigating snow onset and        ious available time periods for each station pair. Six station
disappearance dates, as well as extreme value analyses, we             pairs are excluded from all calculations involving HN due to
strive to answer the following questions.                              irregular measurement procedures in the past, manifested by
                                                                       clusters of cases where HN equals HS minus HS from the
 1. Is the behaviour of the local bias a function of time se-          previous day, thus neglecting the settling of the snow pack.
    ries length (Sect. 4.1); i.e. are relative percentage devia-          For our analyses, we focused on derived snow climate in-
    tions dependent on the length of parallel series?                  dicators as seasonal values. The main variables are defined in
                                                                       Table 1: average snow depth (HSavg); maximum snow depth
 2. Is there any seasonal dependence of the local bias? To
                                                                       (HSmax); sum of new snow (HNsum); maximum 3 d new
    what extent do the various seasons contribute to varia-
                                                                       snow sum (HN3max); days with snow on the ground, defined
    tions observed in indicators derived from parallel snow
                                                                       by HS of at least 1 cm (dHS1); and days with snowfall of at
    series (Sect. 4.2)? To further explore the effects at the
                                                                       least 1 cm (dHN1). Figure A1 gives a quantitative impres-
    beginning and end of the snow season, snow onset and
                                                                       sion of the data set by depicting elevation and mean values
    disappearance dates are used to put the seasonal vari-
                                                                       for HSavg and dHS1.
    ations into context and to test the hypothesis that the
                                                                          Availability and quality of the corresponding metadata
    beginning and especially the end of a snow season are
                                                                       records (coordinates, observer) are an issue. Although we
    most sensitive to the local bias for snow climate indica-
                                                                       managed to compile complete metadata records, there is no
    tors (Sect. 4.3 and 4.4).
                                                                       guarantee that these are always precise and correct. Theo-
                                                                       retically, the exact locations of the snow measurements are

The Cryosphere, 15, 4625–4636, 2021                                                         https://doi.org/10.5194/tc-15-4625-2021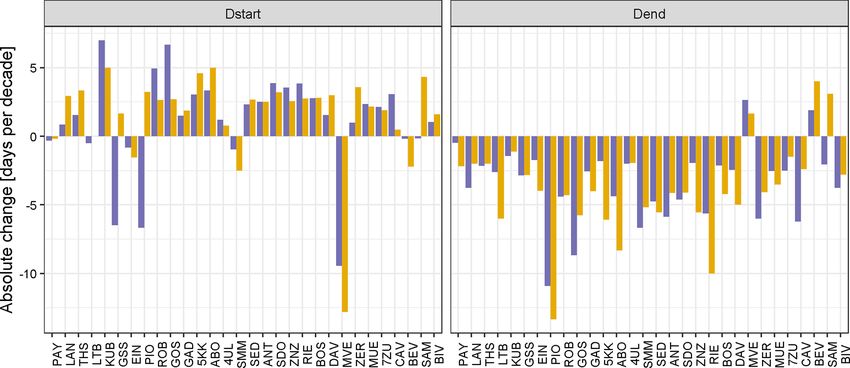
M. Buchmann et al.: Local-scale variability of seasonal mean                                                                      4627

Table 1. Definitions and abbreviations of the investigated snow cli-    To be able to capture all onset and disappearance dates,
mate indicators.                                                        we defined the current hydrological year as the period from
                                                                        1 September of the previous year to 31 August of the current
    Snow climate indicator                         Abbreviation         year, as it is often used in snow hydrological modelling (e.g.
    Average snow depth                             HSavg                Liston and Elder, 2006; Seibert and Vis, 2012).
                                                                           There are various definitions for snow onset (Dstart) and
    Maximum snow depth                             HSmax
                                                                        disappearance dates (Dend) depending on the application in
    New snow sum                                   HNsum                hand, e.g. Foster (1989), Kirdyanov et al. (2003), Peng et
                                                                        al. (2013), Stone et al. (2002), and Klein et al. (2016). How-
    Maximum 3 d new snow sum                       HN3max
                                                                        ever, as none of them suits our purpose and for sake of sim-
    Days with snow on the ground, HS > 0 cm        dHS1                 plicity, we defined them as the first day (Dstart) and day af-
    Days with new snow, HN > = 1 cm                dHN1                 ter the last day (Dend) of the longest period with continuous
                                                                        snow cover. For the purposes in this study, we additionally
    Snow onset date, first day of longest period   Dstart               allowed gaps of up to 3 consecutive days with no snow cover
    with HS > 0 cm                                                      during the season. The chosen gap length allows the inclu-
    Snow disappearance date, day after longest     Dend                 sion of full seasons in case they were fragmented in the mid-
    period with HS > 0 cm                                               dle of the winter by a maximum of 3 d without snow. Such
                                                                        an approach corresponds much more to the experience of the
                                                                        biotic world than just using the duration of the longest con-
known; however, until about two decades ago, only approxi-              tinuous snow cover.
mate coordinates were recorded. The main reason is the gen-                In order to assess the impact of the local-scale differences
eral lack of awareness for the importance as to where the               on the long-term temporal changes of snow onset and dis-
snow measurements are actually conducted. Further, in the               appearance dates Theil–Sen linear slopes (Sen, 1968; Theil,
case of some MeteoSwiss sites, the coordinates refer to the             1950) are calculated for each station pair. For each station
main meteorological measurements and the snow measure-                  we calculated absolute changes (AC) defined as the differ-
ments may have been conducted on a slightly different spot.             ence between the fitted value at the end and the fitted value
Also, sometimes decades have passed between station visits,             at the beginning of the time series.
thus resulting in missing information.                                     To further investigate the potential impact of the begin-
   Potential sunshine duration is obtained with the help of             ning and end of the snow season on local bias, median differ-
Swisstopo’s digital elevation model DHM25, which has an                 ences of daily snow depth measurements for each station pair
accuracy in Alpine terrain of 5–8 m.                                    are calculated, separately for the first (accumulation) and last
                                                                        (ablation) 60 d periods of the hydrological year.
                                                                           To investigate a potential influence of the local bias on the
3   Methods                                                             differences in snow disappearance dates, we compared them
                                                                        to the difference in potential MA sunshine duration hours
To be able to compare and quantify the differences of the               (Sdur) for a selection of station pairs with good quality meta-
various snow climate indicators, we use relative percentage             data. Sdur are obtained as daily values with the help of a
differences (RPDs), calculated according to Eq. (1) for each            digital elevation model and geographical information system
indicator (i) and station pair (X–Y ), with the number of years         (GIS) software. This calculation depends on the accuracy of
denoted by n and k indicating the actual year. These RPDs               the coordinates of the measurement sites.
are expressed as seasonal mean values for DJF, NDJFMA,                     To analyse the impact of the local bias on potential ex-
and MA or monthly mean values. A potential influence of                 treme events based on the annual maximum 3 d new snow
observational length on RPD is investigated by plotting the             sum HN3max (e.g. Bocchiola et al., 2008) and annual max-
number of available parallel years against mean RPD for                 imum snow depth HSmax (e.g. Marty and Blanchet, 2012),
each indicator and station pair in the data set.                        return levels for fixed (50-year) return periods are calculated
                                                                        for each station and indicator using the R package extRemes
          1 Xn     Xki − Yki                                            and standard settings (GEV, estimation method MLE, and
RPD :=       k=1 mean(X i , Y i )
                                                                  (1)
          n             k k                                             95 % confidence intervals). For three station pairs (CAV,
                                                                        KUB, ZER), Gumbel instead of GEV is used due to bad
Absolute differences (absD) are calculated accordingly (see             model fit. The analysis is based on data for NDJFMA.
Eq. 2).
          1 Xn
absD :=      k=1
                 Xki − Yki                                        (2)
          n

https://doi.org/10.5194/tc-15-4625-2021                                                      The Cryosphere, 15, 4625–4636, 2021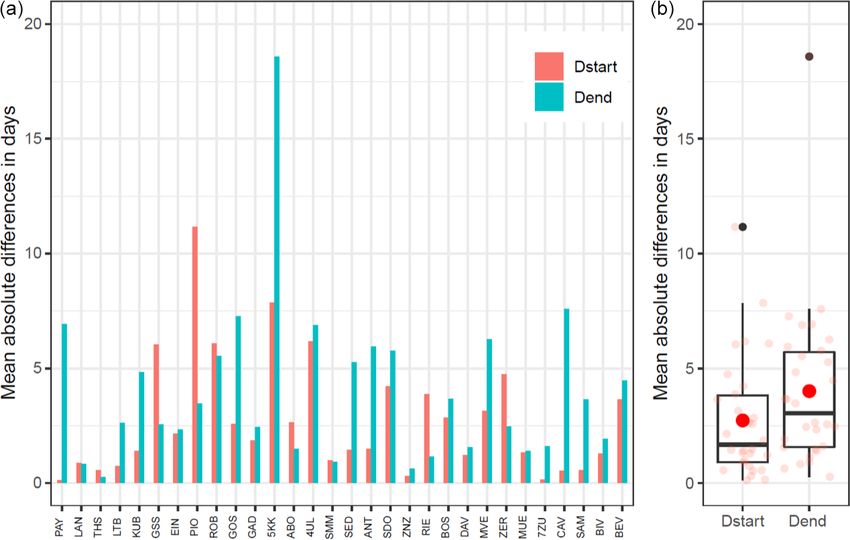
4628 M. Buchmann et al.: Local-scale variability of seasonal mean
4 Results and discussions for HSavg and maximum snow depth (HSmax) seem to be
largest in March and smallest in November, whereas for the
4.1 Time series length and relative percentage sum of new snow (HNsum), the largest absD values are found
differences in January and February and the smallest values in November
and April. The daily snow depth values are generally largest
To investigate a possible relationship of relative percentage in March and lowest in November, thus explaining the pattern
differences (RPDs) with time series length, we plotted the of absD for HSavg and HSmax. The same applies to HNsum;
mean RPD (season NDJFMA) against the length of the un- the largest monthly snowfall sums are observed in January
derlying parallel time series for each indicator (Fig. 1). Here and February, whereas November and April are months with
we found no clear pattern. RPDs are between 10 % and 50 % usually the smallest snowfall sums. dHS1 shows the largest
for all station pairs and indicators. The values are in line with absD at the beginning and end of the snow season (first and
findings from Buchmann et al. (2021a) for a 25-year common last 2 months) likely due to larger differences in thermal con-
period. However, the variations within each indicator show ditions (ground and local air temperature) in these transition
some visual differences, with average snow depth (HSavg) months. dHN1, in contrast, shows fewer monthly differences
having the largest (20 %) and days with snow on the ground than the rest, because the number of snowfall events is only
(dHS1) the smallest (8 %) variations. Outliers are caused by marginally dependent on local measurement conditions.
the same station pairs for all indicators. For a majority of sta- These monthly patterns transform to indicator-dependent
tion pairs, all HN variables show RPDs smaller than 20 %. seasonal absD patterns (Fig. 2 panel c). The different seasons
There is no difference between the shorter and the longer reveal much smaller variations compared to RPD. For ND-
time series. This suggests that the lengths of the time series JFMA, absD varies between 5 and 10 cm or 5 and 8 d for all
have no effect on the RPD values. This further implies that indicators with the exception of HNsum. Due to the cumulat-
time series of different lengths can be compared and com- ing nature of the snowfall sum, the indicator HNsum always
piled into one data set for the purpose of this study. More- shows the largest absD values, which increases with the num-
over, this highlights the possible large differences among the ber of included months (NDJFMA). The same is true for the
various station pairs involved. other snowfall count indicator, dHN1, but on a much lower
The absence of any clear relationship between observa- level. Additional information of absD allows us to put the
tional length and RPD (Fig. 1) justifies the combined use of RPD into context. The lower absD values for dHS1 during
station pairs with varying lengths. However, it could be pos- DJF are no surprise, as the ground tends to be snow-covered
sible that the overall variations are too large to disentangle for almost all station pairs during this period; hence the dif-
the signal of possible breaks from the noise. ference only applies to cases where the snow cover is quite
low (a couple of centimetres). NDJFMA shows the highest
4.2 Seasonal influence absD value for dHS1 because this period contains the begin-
ning and end of the season.
To explore the effects of various seasons on the snow cli- These findings imply that the higher RPD values in the
mate indicators, we calculated RPD and absolute differences MA period for all indicators are mainly caused by smaller
(absD) for three commonly used seasons: winter (DJF), absolute values in this period. The only exceptions are HSavg
spring (MA), and the 6 months November to April (ND- and HSmax, which also show high absD values in the MA
JFMA), as well as for each individual month. Figure 2 sum- period. This indicates that the local bias is indeed larger for
marizes the results. Here we found that RPD for DJF and snow depth during MA.
NDJFMA are similar (difference never exceeds 5 %). How- To further test the seasonal influence from a more general
ever, the main differences are visible in the MA period, point of view, we just looked at the snow depth evolution,
which shows the largest RPD values for all indicators (Fig. 2 comprising of accumulation and ablation for each station pair
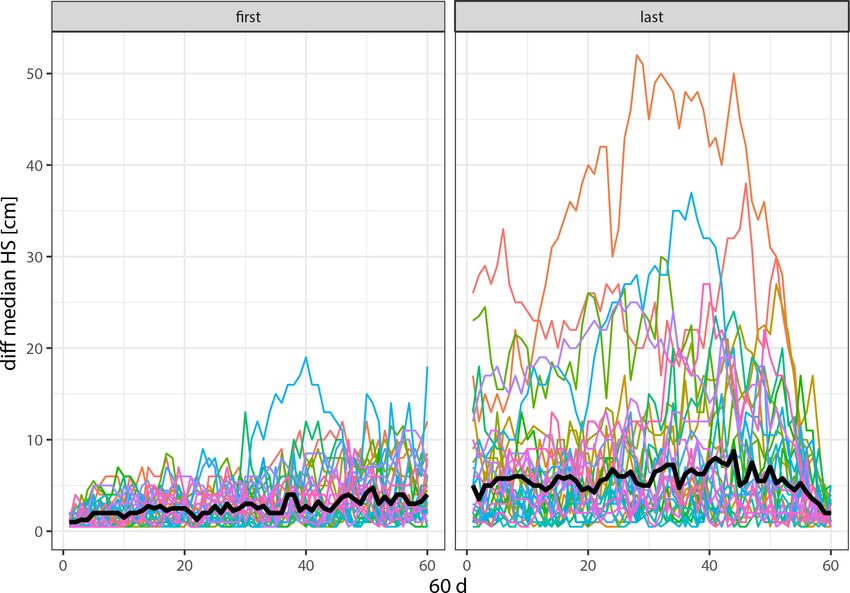
panel a). irrespective of the actual season. The two station pairs below
Furthermore, dHS1 has the lowest median RPD for all sea- 700 m a.s.l. were excluded from this analysis due to median
sons, whereas HSavg is the one with the largest median RPD winter seasons shorter than 60 d. We calculated the climatol-
for all three seasons. Overall median RPD values for ND- ogy of the daily snow depth differences for each station pair.
JFMA are between 7 % and 18 % and correspond to findings We then constructed the difference series as the combination
in Buchmann et al. (2021a). Figure 2 (panel b) further re- of the first (and last) 60 d for each station pair. The median
veals that the largest relative variations occur early (Novem- of all these difference series is the thick black line in Fig. 3.
ber) and late (MA) in the season and the patterns look similar These two periods stand for accumulation (first 60 d) and ab-
for all indicators. lation (last 60 d). The 60 d period is an empirical value. Here
However, the picture looks somewhat different when we we found that the differences and variabilities observed in the
look at absD (Fig. 2 panels c and d). Here we see that the first period seem to be smaller than in the last period (Fig. 3).
largest median differences are not found in the same sea- This suggests that the ablation period shows more variation
sons for all indicators. Figure 2 (panel d) reveals that absD
The Cryosphere, 15, 4625–4636, 2021 https://doi.org/10.5194/tc-15-4625-2021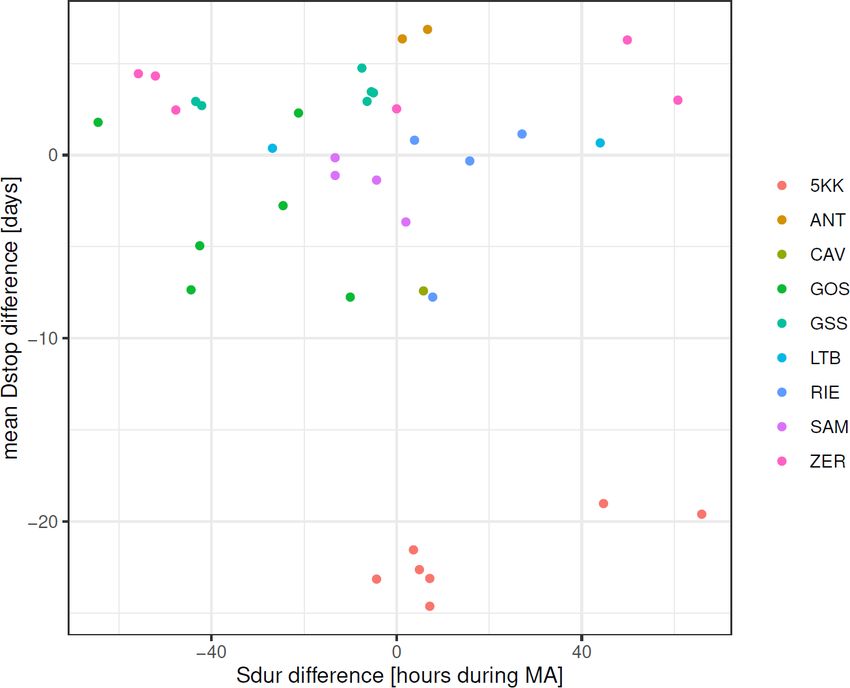
M. Buchmann et al.: Local-scale variability of seasonal mean                                                                        4629

Figure 1. Relative percentage differences (RPDs) as a function of number of parallel years for six snow climate indicators. Black dots and
error bars indicate mean and standard deviations. The variables are defined in Table 1. Snow depth (HS) and snowfall (HN) indicators are
based on 30 and 24 station pairs, respectively.

than the accumulation period, which corroborates the pattern              Additionally, we use absolute temporal changes of snow
found in the absD analysis.                                            onset and disappearance dates, expressed as days per decade,
                                                                       as yet another indicator to test the variability within the sta-
4.3   Snow onset and disappearance dates                               tion pairs. For this purpose, the temporal change in days for
                                                                       Dstart and Dend is calculated for each station pair (Fig. 5).
To further investigate the larger impact of the local bias to-         The pairs are aligned from low (left) to high (right) elevation.
wards the end of the snow season compared to the beginning,            Here we see that for a majority of station pairs, the direction
differences between station pairs in mean snow onset (Dstart)          of changes for Dstart and Dend is the same, and Dstart tends
and snow disappearance dates (Dend) are analysed. Figure 4             to be associated with positive (later) and Dend with negative
(left) highlights the computed absolute differences for Dstart         (earlier) values.
and Dend. We found that for 20 out of 30 station pairs, differ-           Although inter-pair differences occur more pronounced
ences of Dend are larger than differences of Dstart. In con-           and more frequently during the decline phase (spring) com-
trast to the general impression that Dstart should be the same         pared to the accumulation period (Fig. 3), the actual end of
for parallel stations, our data show the differences of several        the snow season (snow disappearance date) does not show
days are not uncommon, which could be caused by the dif-               these larger variations (Fig. 4). Dend appears to be a rather
ferent thermal conditions of the ground of the measurement             stable indicator, varying for 50 % of the station pairs on aver-
field. Figure 4 (right) depicts the mean inter-pair differences        age between 2 and 6 d. In contrast to what is observed in the
for Dstart and Dend. The median values over all station pairs          much more complex topography on the catchment scale, this
are 2 d for snow onset and 3 d for snow disappearance dates.           is a good result as the relative changes derived from trend
This corroborates the previous findings of Fig. 3 that spring          analysis of station (point) data from flat measurement fields
(ablation) shows larger variations than autumn (accumula-              can also be transferred to the catchment scale, even though
tion), with PIO, ZER, GSS, and RIE being the exceptions.               the absolute values may be different (Grünewald and Lehn-
We found that for 75 % of the station pairs, Dstart varies be-         ing, 2015).
tween 0 and 4 d, whereas Dend shows slightly larger differ-               Our values of temporal changes in Dstart and Dend (Fig. 5)
ences (0 to 6 d). A possible explanation for the large differ-         correspond to values obtained by Klein et al. (2016). Al-
ences associated with station 5KK is discussed in Sect. 4.6.           though the definition of Dstart and Dend are different and

https://doi.org/10.5194/tc-15-4625-2021                                                       The Cryosphere, 15, 4625–4636, 2021
4630 M. Buchmann et al.: Local-scale variability of seasonal mean Figure 2. Shown are relative percentage deviations (RPD) and absolute differences (absD) for five snow climate indicators. Depicted are (a, b) three seasons from December to February (DJF, red), March–April (MA, green), and November to April (NDJFMA, blue) and (c, d) all months individually. Snow depth (HS) and snowfall (HN) indicators are based on 30 and 24 station pairs, respectively. The variables are defined in Table 1. Figure 3. Median daily absolute differences in snow depth for each station pair for the first and last 60 d of each snow season. The bold line highlights the median of all station pairs. The Cryosphere, 15, 4625–4636, 2021 https://doi.org/10.5194/tc-15-4625-2021
M. Buchmann et al.: Local-scale variability of seasonal mean                                                                                 4631

Figure 4. (a) Mean absolute differences in onset (Dstart) and disappearance (Dend) dates for all station pairs. The station pairs are ordered
from left to right according to their elevation. (b) Variations of mean absolute differences of Dstart and Dend for all station pairs and available
years. The light red dots mark the actual values, and the bold red dot indicates the mean.

Figure 5. Absolute changes of snow onset (Dstart) and disappearance (Dend) dates calculated for all available parallel periods and expressed
as days per decade. Station pairs are ordered according to elevation from left to right. Yellow and purple bars indicate individual stations
within a pair.

also the time periods are not exactly the same, the absolute                difference in a station pair (64 h during MA) amounts to ap-
changes in Dstart and Dend are mostly similar for the few                   proximately 1 h per day. Mean and standard deviations of
stations analysed by both studies. This suggests that the ab-               all unpaired combinations of this subset are −5 and 124 h.
solute changes of Dstart and Dend are in general quite robust.              Here we found no relationship between potential sunshine
                                                                            duration and differences in Dend. As outlined in Sect. 2, our
4.4   Influence of potential sunshine duration on snow                      metadata is not perfect, and although we limited this analysis
      disappearance dates                                                   to a selection of measurement sites with reliable coordinates,
                                                                            the influence of local-scale obstacles cannot be detected with
When looking for a possible explanation for the inter-pair                  such an approach. As the accuracy is true for the 50 m scale,
differences in Dend with available local-scale variables, we                but not for 10 m, the conundrum in front or behind a house
compared them to differences in potential sunshine dura-                    still remains. An example is given in Sect. 4.6.
tions. Figure 6 displays the relationship of differences in
Dend and differences in potential sunshine duration during
March and April for a selection of station pairs. The largest

https://doi.org/10.5194/tc-15-4625-2021                                                             The Cryosphere, 15, 4625–4636, 2021
4632 M. Buchmann et al.: Local-scale variability of seasonal mean
next to a power station. However, when looking closer, it is
revealed that the one at the train station is located on a first-
floor roof deck cutting. The second one sits just 5 m to the
east of a high turbine house (with corresponding shading) at
the power station. Both sites are affected by their surround-
ings, and corresponding exposure to wind, solar radiation,
and temperature is definitely different. Such differences are
difficult or impossible to detect if the coordinates or metadata
are not accurate.
Even though potential sunshine durations can vary on a
local scale, especially in mountainous areas, the influence on
specific stations is virtually impossible to determine. The in-
fluence of a tree or house in close proximity to a station (not
only regarding sunshine duration) remains an important but
unaccountable factor, especially because the exact location of
the snow measurement stake in the past is often not known.
It is therefore not possible to attribute any local factors in
Figure 6. Relationship between differences in snow disappearance the first place. For example, a measurement field in front of
dates (Dend) and differences in potential sunshine durations (Sdur) a south-facing wall is influenced completely differently than
for the months March and April (MA), calculated for a selection a station located behind said wall on the north-facing side.
of station pairs with manually checked coordinates during different These limitations inhibit the simple use of terrain indicators
time periods. to explain the variations. Furthermore, the influence of the
observer on the snow onset or disappearance date cannot go
unnoticed. Officially, the ground ought to be declared snow-
4.5 Extreme value analyses free if at least 50 % of the measurement field is snow-free.
However, as simple as the instruction may sound, the inter-
To test whether estimated extreme events based on annual pretation can vary and may easily account for a difference of
maximum values of snow depth and snowfall differ signif- a couple of days. Unfortunately, that remains impossible to
icantly within station pairs, return levels for two indicators, prove.
HSmax and HN3max, are calculated for a 50-year return pe- Ideally, station metadata would include the exact coordi-
riod using the NDJFMA season (Fig. 7). Inter-pair differ- nates of the snow stake and panoramic pictures of its sur-
ences of the 50-year return levels are small (7 %–8 % for both roundings. Also, regular visits to sites and observers would
indicators). We found that the return levels of the individual be beneficial. As our focus is solely on parallel measure-
stations are usually within the 95 % confidence intervals, in- ments, the scalability to higher elevations is limited by the
dicated by error bars in Fig. 7. This suggests that in spite fact that there are no stations above 1800 m a.s.l. Therefore,
of obvious differences, in terms of return levels for 50-year any scalability attempts would involve a lot of speculation.
return periods, the station pair values are similar or at least
within each other’s 95 % confidence intervals.
The relative differences of return levels for HSmax and 5 Conclusions
HN3max are less than 30 % for all station pairs and less than
15 % for 75 % of the station pairs. For all but three station We presented the first assessment of seasonal local-scale
pairs these values are within each other’s 95 % confidence variability of common extremal indices and snow climate in-
intervals, which may be useful for applications where there dicators based on a unique data set of long-term parallel snow
is normally only a single time series available. On the other measurements.
hand, the analysis clearly proves that just taking the return Our term variability or local bias is only valid for the par-
value of one station, without considering the estimation un- allel analysis (two point measurements). But even so, the re-
certainty, drastically limits the validity of the results. sults give an indication of possible variations for various in-
dices.
4.6 Metadata, possible explanations, and limitations Regarding common snow climate indicators, the results re-
vealed relatively small median differences for the majority
To illustrate and explain the issues associated with metadata, of the station pairs and indicators. However, spring months
we focus on the station pair Klosters (5KR, 5KK). Concern- (MA) have the highest relative differences (16 %–30 %) and
ing metadata, at a first glance, no striking difference is visi- show more inter-pair variation (8 %–43 %) for all indicators
ble between the two stations. Elevation and surroundings are than DJF (2 %–24 %) or NDJFMA (3 %–25 %). Relative dif-
similar. One station is situated at a train station and the other ferences for these two seasons varied between 3 % (days with
The Cryosphere, 15, 4625–4636, 2021 https://doi.org/10.5194/tc-15-4625-2021M. Buchmann et al.: Local-scale variability of seasonal mean 4633 Figure 7. Return levels for seasonal maximum snow depth (HSmax) (top left) and maximum 3 d new snow sum (HN3max) (bottom left) for 50-year return periods. MeteoSwiss (SLF) stations are coloured red (blue). The error bars indicate the 95 % confidence intervals. Station pairs are ordered from left to right from low to high elevation. Relative percentage differences (RPDs) of return levels for HSmax and HN3max are depicted on the right. snow on the ground) and 20 % (average snow depth) for all The analysis of estimated 50-year return periods based on indicators, whereas average snow depth also demonstrated annual extreme values demonstrates that the return levels for the largest spread of all indicators. Average snow depth also HSmax and HN3max, for the large majority of station pairs, revealed in absolute terms the highest local bias (ca. 10 cm) are within each other’s 95 % confidence intervals, corrobo- in spring. Additionally, inter-pair median differences of the rating that the knowledge of considering the uncertainty in snow disappearance date (per definition a proxy for spring) return level estimation is indispensable. displayed again more variation and higher absolute values Generally, local bias is often small and negligible for many than the snow onset date. However, the differences between applications, at least for the large majority of the stations. the local bias of the snow disappearance date (2 d) and the The problem is that stations exhibiting local bias are not snow onset date (3 d) are small; nevertheless, there is consid- easily detectable in the record without the availability of par- erable variation for some station pairs. allel measurements. As the station pairs are constructed with stations that are Therefore, a larger number of neighbouring stations are on average located within 1 km, the variations are most likely needed to find such problematic stations and to be able to de- down to local-scale influences. This suggests that seasonal velop stable homogenization procedures. Assuming the same differences are likely caused by local bias, which in iso- problem also exists in other parts of the world implies that the lated cases can have large effects and that local bias is prob- current number of available long-term snow measurement ably amplified in MA (and November), likely because of sites should at least be maintained. the larger impact of radiation (and thus temperature). How- ever, insufficient metadata prohibits further analyses on the influence of local-scale factors. But being able to quan- tify season-dependent biases is important in itself, as it in- creases our knowledge about existing inhomogeneities, es- pecially in view of homogenization efforts of snow data se- ries. The larger differences found in spring may be an indi- cation to preferably search for inhomogeneities (breaks) in these months or to determine correction factors separately for the ablation season. https://doi.org/10.5194/tc-15-4625-2021 The Cryosphere, 15, 4625–4636, 2021
4634                                                                M. Buchmann et al.: Local-scale variability of seasonal mean

Appendix A

Table A1. Station pairs, available parallel periods, mean elevation, and number of parallel years. HN indicates whether a station pair was
used for HN analyses. mDstart and mDend are mean onset and disappearance dates, mHSavg indicates the mean average snow depth, and
mdHS1 indicates the mean number of days with snow on the ground. Station indicators starting with a number refer to SLF stations, and
station indicators without a number refer to MeteoSwiss stations.

                      Station pair   Start   Stop   Elevation    Length    HN   mDstart   mDend    mHSavg    mdHS1
                                                    [m a.s.l.]      [yr]                             [cm]       [d]
                     PAY      PAV    1970    2018        490         48         15 Jan    26 Jan       0.5       21
                     LAN      5LQ    1969    2020        520         51    no   3 Jan     6 Feb        3.9       50
                     THS      5TH    1969    2020        700         51    no   25 Dec    19 Feb       5.9       69
                     LTB      1LB    1969    2020        806         51         20 Dec    5 Mar        9.8       94
                     KUB      5KU    1991    2020        815         29    no   7 Dec     15 Mar      15.2      109
                     GSS      EIN    1973    2020        895         47         18 Dec    9 Mar       14.2      106
                     EIN      SSE    1943    2020        912         77         13 Dec    12 Mar      16.7      112
                     PIO      6AM    1979    2003        980         24         18 Dec    20 Mar      19.7      107
                     ROB      7PV    1961    2020       1015         59    no   27 Dec    24 Feb       7.5       74
                     GOS      2GO    1969    2020       1115         51         3 Dec     6 Apr         38      139
                     GAD      1GA    1969    2019       1190         50         23 Nov    16 Apr      53.1      151
                     5KK      5KR    1968    2020       1200         52    no   22 Nov    15 Apr      48.7      147
                     ABO      1AD    1966    2013       1325         47         3 Dec     29 Mar      25.8      134
                     4UL      4MS    1950    2020       1380         70         17 Nov    21 Apr      62.1      155
                     SMM      7ST    1979    2012       1415         33         25 Nov    31 Mar        23      134
                     SED      5SE    1970    2020       1420         50         20 Nov    12 Apr      39.9      149
                     ANT      2AN    1967    2016       1440         49         14 Nov    1 May       69.8      164
                     SDO      5SP    1973    2020       1457         47         24 Nov    10 Apr      35.4      144
                     ZNZ      7ZN    1972    2020       1475         48         1 Dec     28 Mar      19.2      124
                     RIE      4WI    1975    2007       1490         32         26 Nov    10 Apr      41.1      140
                     BOS      6BG    1962    2014       1525         52         19 Nov    26 Apr      64.4      158
                     DAV      5DF    1966    2006       1560         40         14 Nov    27 Apr      52.2      163
                     MVE      4MO    1952    1978       1590         26         6 Dec     10 Apr      45.3      135
                     ZER      4ZE    1966    2004       1627         38         17 Nov    13 Apr      38.6      151
                     MUE      1MR    1972    2019       1650         47         20 Nov    29 Apr        57      161
                     7ZU      7SC    1951    2010       1660         59         16 Nov    14 Apr      37.9      151
                     CAV      7CA    1969    2020       1700         51    no   24 Nov    25 Apr      57.8      154
                     BEV      7SD    1951    1982       1715         31         12 Nov    19 Apr      45.3      158
                     SAM      7SD    1980    2020       1715         40         19 Nov    17 Apr      32.6      152
                     BIV      5BI    1969    2014       1770         45         11 Nov    30 Apr      53.3      166

Figure A1. Shown in green are mean values of average snow depth (HSavg), and shown in red are mean values of days with snow on the
ground (dHS1) for each station pair and NDJFMA. Station pairs are ordered according to their elevation.

The Cryosphere, 15, 4625–4636, 2021                                                          https://doi.org/10.5194/tc-15-4625-2021
M. Buchmann et al.: Local-scale variability of seasonal mean 4635
Data availability. The basis for all our analyses, the indicator data Arct. Alp. Res., 21, 60–70, https://doi.org/10.2307/1551517,
set, is available from EnviDat: https://doi.org/10.16904/envidat.218 1989.
(Buchmann et al., 2021b). Grünewald, T. and Lehning, M.: Are flat-field snow depth
measurements representative? A comparison of selected in-
dex sites with areal snow depth measurements at the
Author contributions. CM, MiB, and MoB designed the outline small catchment scale, Hydrol. Process., 29, 1717–1728,
with input from SB. MoB performed the analyses and wrote the https://doi.org/10.1002/hyp.10295, 2015.
draft. The revised manuscript was written by MoB with inputs from Haberkorn, A.: European Snow Booklet – an Inven-
all authors. CM supervised the work. tory of Snow Measurements in Europe, EnviDat,
https://doi.org/10.16904/envidat.59, 2019.
Kirdyanov, A., Hughes, M., Vaganov, E., Schweingruber, F., and
Competing interests. The contact author has declared that neither Silkin, P.: The importance of early summer temperature and date
they nor their co-authors have any competing interests. of snow melt for tree growth in the Siberian Subarctic, Trees, 17,
61–69, https://doi.org/10.1007/s00468-002-0209-z, 2003.
Klein, G., Vitasse, Y., Rixen, C., Marty, C., and Rebetez, M.:
Shorter snow cover duration since 1970 in the Swiss Alps
Disclaimer. Publisher’s note: Copernicus Publications remains
due to earlier snowmelt more than to later snow onset,
neutral with regard to jurisdictional claims in published maps and
Clim. Change, 139, 637–649, https://doi.org/10.1007/s10584-
institutional affiliations.
016-1806-y, 2016.
Liston, G. E. and Elder, K.: A Meteorological Distribution Sys-
tem for High-Resolution Terrestrial Modeling (MicroMet), J.
Acknowledgements. We thank Johannes Aschauer (SLF) for his Hydrometeorol., 7, 217–234, https://doi.org/10.1175/JHM486.1,
valuable work in sorting out the metadata mess and contribution 2006.
to the data set. We thank Francesco Issota (MeteoSwiss) for provid- Livensperger, C., Steltzer, H., Darrouzet-Nardi, A., Sullivan, P. F.,
ing the sunshine duration (Sdur) data set and Wolfgang Schöner Wallenstein, M., and Weintraub, M. N.: Earlier snowmelt and
and Gernot Resch for valuable discussions. Our thanks go to warming lead to earlier but not necessarily more plant growth,
Craig Smith and Kay Helfricht and one anonymous referee, whose AoB Plants, 8, plw021, https://doi.org/10.1093/aobpla/plw021,
valuable comments helped to improve the manuscript. 2016.
Marcolini, G., Bellin, A., Disse, M., and Chiogna, G.: Variability in
snow depth time series in the Adige catchment, J. Hydrol. Reg.
Financial support. This research has been supported by Stud., 13, 240–254, https://doi.org/10.1016/j.ejrh.2017.08.007,
the Schweizerischer Nationalfonds zur Förderung der Wis- 2017.
senschaftlichen Forschung (grant no. 175920). Marty, C. and Blanchet, J.: Long-term changes in annual
maximum snow depth and snowfall in Switzerland based
on extreme value statistics, Clim. Change, 111, 705–721,
Review statement. This paper was edited by Ketil Isaksen and re- https://doi.org/10.1007/s10584-011-0159-9, 2012.
viewed by Craig Smith, Kay Helfricht, and one anonymous referee. Peng, S., Piao, S., Ciais, P., Friedlingstein, P., Zhou, L., and Wang,
T.: Change in snow phenology and its potential feedback to tem-
perature in the Northern Hemisphere over the last three decades,
Environ. Res. Lett., 8, 014008, https://doi.org/10.1088/1748-
References 9326/8/1/014008, 2013.
Roland, J., Filazzola, A., and Matter, S. F.: Spatial variation in
Bocchiola, D., Bianchi Janetti, E., Gorni, E., Marty, C., and Sovilla, early-winter snow cover determines local dynamics in a net-
B.: Regional evaluation of three day snow depth for avalanche work of alpine butterfly populations, Ecography, 44, 334–343,
hazard mapping in Switzerland, Nat. Hazards Earth Syst. Sci., 8, https://doi.org/10.1111/ecog.05407, 2021.
685–705, https://doi.org/10.5194/nhess-8-685-2008, 2008. Scherrer, S. C. and Appenzeller, C.: Swiss Alpine snow pack vari-
Brown, R. D. and Robinson, D. A.: Northern Hemisphere spring ability: major patterns and links to local climate and large-scale
snow cover variability and change over 1922–2010 including flow, Clim. Res., 32, 187–199, https://doi.org/10.3354/cr032187,
an assessment of uncertainty, The Cryosphere, 5, 219–229, 2006.
https://doi.org/10.5194/tc-5-219-2011, 2011. Seibert, J. and Vis, M. J. P.: Teaching hydrological modeling with a
Buchmann, M., Begert, M., Brönnimann, S., and Marty, C.: Evalu- user-friendly catchment-runoff-model software package, Hydrol.
ating the robustness of snow climate indicators using a unique set Earth Syst. Sci., 16, 3315–3325, https://doi.org/10.5194/hess-16-
of parallel snow measurement series, Int. J. Climatol., 41 E2553– 3315-2012, 2012.
E2563, https://doi.org/10.1002/joc.6863, 2021a. Sen, P. K.: Estimates of the regression coefficient based on
Buchmann, M., Aschauer, J., Begert, M., and Marty, C.: Snow Kendall’s tau, J. Am. Stat. Assoc., 63, 1379–1389, 1968.
climate indicators derived from parallel manual snow measure- Stone, R. S., Dutton, E. G., Harris, J. M., and Longenecker, D.:
ments, EnviDat [data set], https://doi.org/10.16904/envidat.218, Earlier spring snowmelt in northern Alaska as an indicator of
2021b. climate change, J. Geophys. Res.-Atmos., 107, ACL 10-1–ACL
Foster, J. L.: The Significance of the Date of Snow Disappearance 10-13, https://doi.org/10.1029/2000JD000286, 2002.
on the Arctic Tundra as a Possible Indicator of Climate Change,
https://doi.org/10.5194/tc-15-4625-2021 The Cryosphere, 15, 4625–4636, 20214636 M. Buchmann et al.: Local-scale variability of seasonal mean
Theil, H.: A rank-invariant method of linear and polynomial re- World Meteorological Organization: World Meteorological Orga-
gression analysis, Proceedings of the Koninklijke Nederlandse nization, and Organisation Météorologique Mondiale: Guide to
Akademie van Wetenschappen Series A, 53, 386–392, 1950. meteorological instruments and methods of observation, WMO,
Vorkauf, M., Marty, C., Kahmen, A., and Hiltbrunner, E.: Geneva, 2018.
Past and future snowmelt trends in the Swiss Alps: the Zampieri, M., Scoccimarro, E., Gualdi, S., and Navarra, A.:
role of temperature and snowpack, Clim. Change, 165, 44, Observed shift towards earlier spring discharge in the
https://doi.org/10.1007/s10584-021-03027-x, 2021. main Alpine rivers, Sci. Total Environ., 503–504, 222–232,
https://doi.org/10.1016/j.scitotenv.2014.06.036, 2015.
The Cryosphere, 15, 4625–4636, 2021 https://doi.org/10.5194/tc-15-4625-2021You can also read