Multivariable mortality risk prediction using machine learning for COVID 19 patients at admission - (AICOVID)
←
→
Page content transcription
If your browser does not render page correctly, please read the page content below
www.nature.com/scientificreports
OPEN Multivariable mortality risk
prediction using machine learning
for COVID‑19 patients at admission
(AICOVID)
Sujoy Kar1*, Rajesh Chawla2, Sai Praveen Haranath1, Suresh Ramasubban3,
Nagarajan Ramakrishnan4, Raju Vaishya5, Anupam Sibal5 & Sangita Reddy1
In Coronavirus disease 2019 (COVID-19), early identification of patients with a high risk of mortality
can significantly improve triage, bed allocation, timely management, and possibly, outcome.
The study objective is to develop and validate individualized mortality risk scores based on the
anonymized clinical and laboratory data at admission and determine the probability of Deaths at 7
and 28 days. Data of 1393 admitted patients (Expired—8.54%) was collected from six Apollo Hospital
centers (from April to July 2020) using a standardized template and electronic medical records.
63 Clinical and Laboratory parameters were studied based on the patient’s initial clinical state at
admission and laboratory parameters within the first 24 h. The Machine Learning (ML) modelling was
performed using eXtreme Gradient Boosting (XGB) Algorithm. ‘Time to event’ using Cox Proportional
Hazard Model was used and combined with XGB Algorithm. The prospective validation cohort was
selected of 977 patients (Expired—8.3%) from six centers from July to October 2020. The Clinical
API for the Algorithm is http://20.44.39.47/covid19v2/page1.php being used prospectively. Out of
the 63 clinical and laboratory parameters, Age [adjusted hazard ratio (HR) 2.31; 95% CI 1.52–3.53],
Male Gender (HR 1.72, 95% CI 1.06–2.85), Respiratory Distress (HR 1.79, 95% CI 1.32–2.53), Diabetes
Mellitus (HR 1.21, 95% CI 0.83–1.77), Chronic Kidney Disease (HR 3.04, 95% CI 1.72–5.38), Coronary
Artery Disease (HR 1.56, 95% CI − 0.91 to 2.69), respiratory rate > 24/min (HR 1.54, 95% CI 1.03–2.3),
oxygen saturation below 90% (HR 2.84, 95% CI 1.87–4.3), Lymphocyte% in DLC (HR 1.99, 95% CI
1.23–2.32), INR (HR 1.71, 95% CI 1.31–2.13), LDH (HR 4.02, 95% CI 2.66–6.07) and Ferritin (HR 2.48,
95% CI 1.32–4.74) were found to be significant. The performance parameters of the current model is at
AUC ROC Score of 0.8685 and Accuracy Score of 96.89. The validation cohort had the AUC of 0.782 and
Accuracy of 0.93. The model for Mortality Risk Prediction provides insight into the COVID Clinical and
Laboratory Parameters at admission. It is one of the early studies, reflecting on ‘time to event’ at the
admission, accurately predicting patient outcomes.
The current COVID-19 pandemic caused by SARS-CoV-2 is associated with high mortality and morbidity1.
In India, over 10 million individuals have been affected by the virus (till mid January), with over 150 thousand
people losing their lives, at a mortality rate of 1.44%2. However, the 30 days mortality rates at tertiary care
hospitals in the US are far higher at 9.06% to 15.65%3. Various studies have been conducted to determine the
mortality risk factors in COVID 1 94–6. Understanding the clinical and laboratory predictors at admission can
lead to appropriate determinants of mortality and improve triaging, bed and resource allocation, and improved
patient management throughout health systems.
The datasets of COVID-19 patients can be integrated and analysed by Machine Learning (ML) algorithms
to improve diagnostic speed and accuracy better and potentially identify the most susceptible people based on
personalized clinical and laboratory characteristics7. These methods activate early insights of patient’s outcome
with the predictors at the time of admission. Existing studies have used Machine Learning Algorithms (MLA)
to determine COVID-19 m ortality8–10.
1
Apollo Hospitals, Jubilee Hills, Hyderabad 500033, India. 2Indraprastha Apollo Hospitals, Sarita Vihar, New
Delhi, India. 3Apollo Multispecialty Hospitals, Kolkata 700054, India. 4Apollo Hospitals, Greams Road, Chennai,
India. 5Indraprastha Apollo Hospitals, Sarita Vihar, New Delhi, India. *email: drsujoy_k@apollohospitals.com
Scientific Reports | (2021) 11:12801 | https://doi.org/10.1038/s41598-021-92146-7 1
Vol.:(0123456789)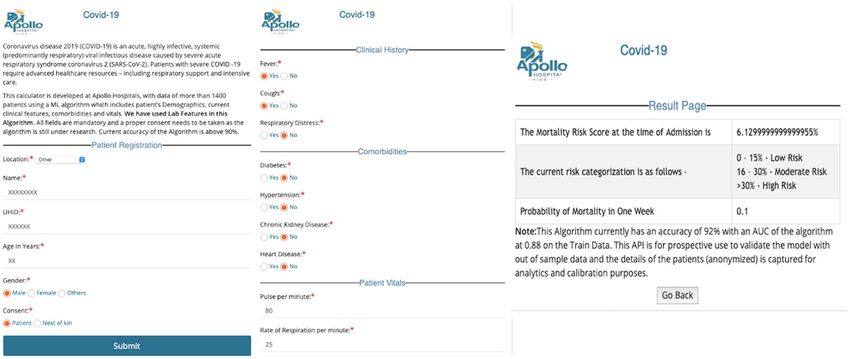
www.nature.com/scientificreports/
Clinical & Lab Parameters
at Admission & within 24
hours were collected in
standard format
1435 Retrospective
1393 Discharge Records 16 parameters were used for API generated from 973 Prospective
Patient Records with Ongoing
with 119 Expired Patients Machine Learning Models – Logistic the Gradient Validation Cohort from 6
COVID were selected
(8.54%) and 1274 Regression, CART, Random Forrest Boosting Algorithm. hospitals in Apollo Group Use
from 6 hospitals in Apollo
Survivors were selected. and Gradient Boosting Model Risk Staging – Aug to Oct 2020
Group – Apr to Jul 2020
IEC Approval for
Odds Ratio, Relative Risk, Prospective
42 Records were dropped
p values, z score were Validation
due to missing values. determined based on the
No Imputation Used clinical & lab thresholds.
Propensity Matching done
between Expired &
Survivor Populations
Figure 1. Schematic flow of the development and validation of the AICOVID algorithm to predict the risk of
mortality at admission.
Due to the absence of similar studies in the Indian population, this research work was undertaken to develop
and validate MLA based on the anonymized clinical and laboratory data to predict the outcome (Expired or
Recovered) from retrospective evaluation of patients admitted with COVID (Fig. 1). Additionally, the algorithm
determines the probability (risk) of Events (defined as Death or Expiry of Subjects), predicting mortality at 7 and
28 days. Secondarily this would provide clinical insights on various clinical and laboratory parameters. These
are clinically and statistically relevant and help develop a Clinical API (application and programming interface)
tool used by clinicians taking care of admitted patients even in low-cost settings.
The main contribution of the paper is to identify the risk factors for mortality at admission of COVID-19
patients and to build a multivariable Machine Learning model which would help in triaging, allocating resources,
putting patients into an appropriate clinical protocol, and patient and family education at admission.
The remainder of this paper includes Methodology, Study design and modelling in “Methodology” section;
“Results” in “Results” section, Interpretation and Limitations in “Limitation” section, followed by Conclusion
in “Conclusion” section.
Methodology
This study is designed as a multicenter, retrospective—prospective, observational, non-interventional study.
Source of data. The retrospective data (for the development cohort) is collected from the anonymized
clinical and laboratory records at admission from the discharge summaries of the patients and a standardized
template (Annexure 1) from six Apollo Hospitals in India for the period of April to June 2020. These Hospitals
are from Bangalore Chennai, Delhi, Hyderabad, Kolkata, and Navi Mumbai. On the prospective validation arm,
the data elements at admission were provided by the site investigator in the electronic template (API—Fig. 4).
Additional data were collected from discharge summaries, and the standardized template described. For dis-
charged summaries, we used appropriately coded ICD-10 diagnosis data. The validation cohort was collected
from the same six hospitals in the period between August to October 2020.
Participants. The participants were admitted to the hospital with symptoms and history s uggestive11,12 of
Coronavirus Disease (COVID) with subsequent laboratory confirmation through Reverse Transcription Poly-
merase Chain Reaction (RT-PCR tests). The data were collected during admission at Emergency Room and
following admission (within 24 h). The eligibility criteria for inclusion of the patients included—(a) patients
presenting with COVID-19 related symptoms (with or without a history of contact/travel to geographical hot
spots in the community), (b) subjects who comply with category B2/C in the Apollo Hospitals COVID protocol
(See Annexure 2). The exclusion criteria were (a) patients admitted for other disease conditions and were sub-
sequently found to have COVID during the hospital stay. The study did not include any specific intervention
or treatment provided to the patient during admission or within its 24 h. The Institutional Ethics Committees
of the six Apollo Hospitals (specified above) have approved the research and confirmed that all research was
performed in accordance with relevant guidelines/regulations, and that informed consent was obtained from all
participants and/or their legal guardians. Research involving human research participants has been performed
in accordance with the Declaration of Helsinki.
Outcome. The study’s primary outcome was to develop comparable models with improved accuracy param-
eters, which would yield a risk predictor for mortality (in the next 7 and 28 days) at admission. Each predictor
(clinical and laboratory variables) are studied for their odds and hazard ratios.
Predictors. The Clinical Variables included patient’s basic information, including Age and Gender, Exposure
and Travel history, and the number of days of symptoms before admission. It also included different symptoms
Scientific Reports | (2021) 11:12801 | https://doi.org/10.1038/s41598-021-92146-7 2
Vol:.(1234567890)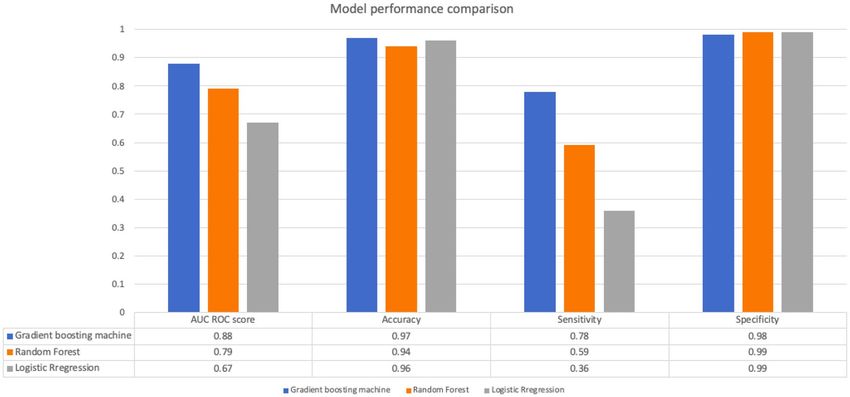
www.nature.com/scientificreports/

Development                                                                                             Validation
Clinical                      Recovered                Expired                  Odds ratio              Recovered                 Expired                   Odds ratio
and lab
parameters      Threshold     Mean     CI              Mean      CI             Odds ratio   p value    Mean     CI               Mean      CI              Odds ratio   p value
Age             60            47.19    46.28–48.09     61.13     57.98–64.28     4.59        < 0.0001   53.4         52.39–54.4   67.41     64.52–70.3       5.12        < 0.0001
Gender
                N/A           0.68        0.65–0.7     0.78        0.7–0.85      1.67         0.0328    0.72          0.69–0.75   0.85       0.77–0.93       1.19         0.2937
(male)
Fever           N/A           0.62        0.59–0.65    0.76       0.68–0.84      1.94         0.0043    0.58          0.55–0.62   0.02       0.01–0.06       0.17        < 0.0001
Cough           N/A           0.37        0.34–0.39    0.43       0.34–0.52      1.33         0.1641    0.5           0.47–0.53   0.47       0.36–0.58       0.74         0.0389
Respiratory
                N/A           0.21        0.18–0.23    0.57       0.48–0.66      5.01        < 0.0001   0.13           0.1–0.15   0.51           0.4–0.62    3.08        < 0.0001
distress
Weakness        N/A           0.09        0.08–0.11    0.17        0.1–0.24      1.96         0.0148    0.15          0.12–0.17   0.21       0.12–0.3        0.65         0.038
Diabetes        N/A           0.29        0.26–0.31    0.57       0.48–0.66      3.33        < 0.0001   0.39          0.36–0.42   0.52       0.41–0.63       2.15        < 0.0001
 Hypertension N/A             0.3         0.27–0.32    0.5         0.4–0.59      2.37        < 0.0001   0.42          0.39–0.45   0.58       0.47–0.69       2.09        < 0.0001
 Chronic kid-
                N/A           0.05        0.04–0.07    0.16       0.09–0.23      3.24        < 0.0001   0.05          0.04–0.06   0.19           0.1–0.27    4.1         < 0.0001
 ney disease
 Chronic liver
               N/A            0.01          0–0.01     0.02       0.01–0.04      3.44         0.1261    0.01            0–0.01    0.01       0.01–0.04       3.85         0.0378
 disease
 Heart disease N/A            0.06        0.05–0.07    0.24       0.16–0.32      5.04        < 0.0001   0.09          0.07–0.11   0.02       0.01–0.06       2.11         0.0017
 Respiration
                24            21.63    21.44–21.83     27.33     26.12–28.55     6.77        < 0.0001   21.56        21.29–21.82 28.49      26.74–30.25      4.56        < 0.0001
 rate
 Oxygen
                0.88          0.97        0.96–0.98    0.88       0.86–0.9      22.32        < 0.0001   0.95          0.95–0.96   0.85       0.82–0.88       7.58        < 0.0001
 saturation
                                                                                                                                            10,747–
 WBC count      8000          6684     6510–6858       9907      8039–11,775     3.64        < 0.0001   7076         6596–7556 12,919                        3.29        < 0.0001
                                                                                                                                            15,091
 Lympho-
                10            25.37    24.74–26        10.06      8.48–11.64    11.93        < 0.0001   30.63        29.86–31.4   19.64     17.31–21.98      3.92        < 0.0001
 cyte%
 INR (PT)       1.3           1.13        1.12–1.15    1.32       1.24–1.39      4.58        < 0.0001   1.41          1.36–1.45   1.98       1.71–2.25       3.49        < 0.0001
 Creatinine     1.3           1.19        1.11–1.28    1.79       1.43–2.15      3.26        < 0.0001   9.69          9.08–10.3   3.28       2.77–3.8       14.08        < 0.0001
 Albumin        3.5           4.05        4.02–4.08    3.61       3.48–3.74      3.95        < 0.0001   4.08          4.05–4.11   3.62       3.43–3.81       3.1         < 0.0001
 AST
 (aspartate                                                                                                                                 113.39–
                60            47.66    45.54–49.79     64.54     48.34–80.74     1.58         0.0452    50.18        46.17–54.18 167.16                      3.49        < 0.0001
 aminotrans-                                                                                                                                220.93
 ferase)
 Lactate dehy-                                                                                                                              545.26–
               450            315.07      307–322      565.79    509.5–622.0     8.6         < 0.0001   334.61   324.21–345       602.49                     8.46        < 0.0001
 drogenase                                                                                                                                  659.73
 Ferritin       800           518.98      446–591      1566.7    942.9–2190.4    3.76        < 0.0002   536.44        489–583     1772.16   1397.–2147       4.15        < 0.0001
 C-reactive                                                                                                                                 110.33–
                48            35.72       28.9–42.54   145.92     87.5–204.34    5.35        < 0.0001   36.94        33.55–40.33 135.9                       3.44        < 0.0001
 protein                                                                                                                                    161.48
 Red cell
 distribution   14.5          14.27    14.18–14.37     14.55     14.22–14.87     1.21         0.368     14.5         14.37–14.63 16.44      15.84–17.05      3.06        < 0.0001
 width

                                       Table 1.  23 key clinical and lab variables for the prediction of mortality at admission with COVID-19.

                                       like fever, cough, respiratory distress (shortness of breath), etc. The history of associated chronic diseases like
                                       diabetes, hypertension, heart and kidney disease, cancer, etc., was captured. Vitals at admissions like tempera-
                                       ture, oxygen saturation, rate of respiration (ROR), and pulse rate were noted. Laboratory parameters were cat-
                                       egorized into (a) Complete Hemogram including Red Cell Distribution Width, (b) Basic biochemistry including
                                       Kidney and Liver Profile Tests, (c) Coagulation Profile including Prothrombin Time, International Randomized
                                       Ratio (INR), Activated Prothomboplastin Time (APTT) and D-dimer, (d) Inflammatory markers like C-Reac-
                                       tive Protein (CRP), Lactic Acid Dehydrogenase (LDH), Ferritin, Interleukin-6 and Procalcitonin, were evalu-
                                       ated. Out of more than 65 predictors, we selected only 23 predictors based on their odds ratio, p value (Table 1),
                                       and clinical relevance. D-dimer and Interleukins were not selected in the study due to the smaller sample size
                                       (< 30%). For Validation data, there were no differences from the development data in setting, eligibility criteria,
                                       outcome and predictors.

                                       Sample size. The study included a total population of 2370 patients, including 1393 in the Development
                                       Cohort and 977 in the Validation cohort. The sample size was determined using an estimated 10 million COVID
                                       Cases in India (October 2020) at 95% confidence level and confidence interval 2.

                                       Missing data. The initial development cohort was 1435. Forty-two patient’s data were dropped owing to
                                       missing fields. No imputations were used in the development or validation cohort. As described earlier, certain
                                       laboratory predictors were not selected due to the smaller sample size and missing values.

Scientific Reports |        (2021) 11:12801 |                     https://doi.org/10.1038/s41598-021-92146-7                                                                        3

                                                                                                                                                                           Vol.:(0123456789)
www.nature.com/scientificreports/
Statistical analysis and modelling approach. The clinical and laboratory parameters were selected
based on the odds ratios of the initial cohort. The parameters were subsequently run through the Propensity
Matching for the binary classification of Event (Death—1) and Non-Events (Survival—0). The population is ran-
domly divided into training (70%) and test (30%) in the development model. The 23 parameters were then put
through the three models for maximizing the K-fold cross-validation AUC (Area Under Curve) using Python
(3.7) to determine the performance of logistic regression, random forest models, and eXtreme gradient boosting
(XGB) algorithm.
However, we considered the XGB (eXtreme Gradient Boosting) model, as the function of this model is an
approximation of the data distribution considering the errors:
y i = F1 (xi ) + error1i
where yi is the predicted value and xi are the input values. F1 (xi ) is a function, and the relationship between x
and y is not fully described.
1. We initialize the model
by solving the following equation for the 23 input parameters:
F0 (x) = argmin ni=1 L(yi , γ ); then we get
n
yi
F0 (x) = i=1
n
where n is the total number of observation, i.e., 1393. F1 (xi ) function is a weak learner, and the relationship
between X and y is not fully described.
2. For no of iterations—m = 1 to M
Gradient with respect to predicted value,
∂L yi , Fm−1 (xi )
rim = − ,
∂Fm−1 (xi )
where i is the index for observations, m represents the number of iterations with m ∈ [1, M]. M is the maxi-
mum number of iterations. L stands for loss functions.
3. Fit the weak learner hm (x) to the residuals by:
Computing the γm to solve the optimization problem:
n
γm = arg min L[yi , Fm−1 (xi ) + .Fm (xi )]
i=1
By solving this equation we can get:
n
i=1 hm (xi ) · [yi − Fm−1 (xi )]
γm = n 2
i=1 hm (xi )
4. Update the Fm (x) = Fm−1 (x) + γm · hm (x)
squared error is used as the loss function, and the gradient of the loss function can be calculated as follows:
∂L yi , Fm−1 (xi )
rim = − ,
∂Fm−1 (xi )
∂{ 21 × [Fm−1 (xi ) − yi ]2 }
= −
∂Fm−1 (xi)
1
× Fm−1 (xi )2 + yi2 − 2 × Fm−1 (xi ) · yi
∂
=− 2
∂FM−1 (xi )
= yi − Fm−1 (xi ) for i = 1, 2, . . . n.
Python language is used to code the program. Python ML packages were used, namely Sklearn, numpy and pan-
das library is used for this work. The code snippet for XGB model = XGB Classifier (n estimators = 1997, learning
rate = 0.2, max depth = 5, random state = 42). These details are obtained through multiple trial and error methods
with many hyperparameters derived from the variables. Similarly for Random Forest Model n_estimators were
selected as 100, with max depth at 5.
After training model and successful testing, the model is pickled and saved. This pickled model is hosted and
served as the back end for requests from the front end user. The user’s values will act as input for the model, and
the predicted response would be output.
Risk stratification. On the input of the individual data to the algorithm, the machine returns the value in
percentage of the risk of mortality in the next 7 and 28 days. The risk thresholds between 0 and 15% are associ-
ated with low mortality rates (< 1%), while the moderate risk category 15–30% had 1–5% Mortality and high-risk
category (> 30%) at > 5% Mortality. Further, the Cox Proportional Hazard model’s addition returned the prob-
ability of mortality in 7 and 28 days and has been used to display in the output.
Scientific Reports | (2021) 11:12801 | https://doi.org/10.1038/s41598-021-92146-7 4
Vol:.(1234567890)www.nature.com/scientificreports/
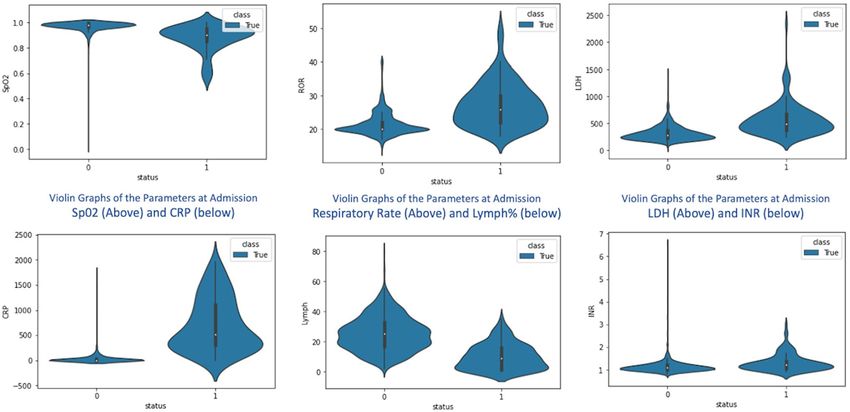
Figure 2. Combination of Box Plots and Kernel Density Plots reflect on different clinical and lab variables
at admission and their representation for Survival (0) vs. Expired Patients (1). The white dot represents the
median, the thick grey bar in the centre represents the interquartile range, the thin grey line represents the rest
of the distribution, except for points that are outliers. [Development Cohort].
Predictors analysis. Hazard Ratios are calculated for each predictor, based on their accepted clinical and
laboratory thresholds, as applicable. (see Table 1 for Thresholds) Kaplan Meir curves and Violin plots were used
to analyze the effect of individual variables on overall mortality.
Performance evaluation. All models are evaluated based on their ability to discriminate between out-
comes for the development cohort and the XGB Model for the validation cohort with the corresponding con-
fidence intervals (CI). The AUC, accuracy, sensitivity—specificity, precision, predictive value, and likelihood
ratios are computed for validation cohort with a standard threshold. Thresholds are derived through the mean
cut off values of different parameters including their clinical and laboratory ranges.
Patient and public involvement. The study has been conducted with retrospective data from April to
July 2020, and hence development of the research question and outcome measures were not directly communi-
cated to the patients in the development cohort. However, in the validation cohort, they were informed about
the study design and outcome.
Results
Clinical and laboratory variables at admission (participants). The average observed mortality rates
are 8.54% (N = 1393) in the development cohort and 8.3% in the validation cohort (N = 977) for six different
hospitals in April to July 2020 and August to October 2020, respectively. The average Length of Stay in the study
population is 10.04 (9.75–10.3) days for survived patients and 12.32 (11.2–13.5) days for expired patients. In Age
comparison, expired patients were older (mean age 61.1 vs. 47.2 in the development cohort and 67.4 vs. 53.4
in the validation cohort). The gender of expired patients was 78% & 85% male in the development and valida-
tion cohort. Further details of the symptoms, comorbidities, vitals at admission, and laboratory parameters are
provided in Table 1. Significantly, the odds ratios for Respiratory Distress [5.01], Diabetes [3.33], Heart Disease
[5.04] are high in the development cohort as symptoms and comorbidities. Odds ROR > 24/min, Oxygen satura-
tion < 90% are at 6.77 and 22.32 respectively. In lab parameters, Lymphocytes below 10% [11.93], Lactate Dehy-
drogenase > 250 units [8.6] and C-reactive protein > 48 units [5.35] show high significance. Figure 2—shows the
different parameters with violin graphs.
Performance indicators (model development and validation). The performance of the XGB model
is summarized in Fig. 3 below. The AUC for the developed algorithm is 0.88, Accuracy score at 0.97, and preci-
sion at 0.91. The validation cohort’s performance is AUC at 0.78, Accuracy score at 0.93, and precision at 0.77.
The positive likelihood ratio is at 15.06, and the negative predictive value is 96.41%. The critical clinical and
laboratory variables in the ML model depict the important predictors of the overall outcome and interplay
between each of them.
Scientific Reports | (2021) 11:12801 | https://doi.org/10.1038/s41598-021-92146-7 5
Vol.:(0123456789)www.nature.com/scientificreports/
Figure 3. Performance of eXtreme Gradient Boosting (XGB) Algorithm for the Development and Validation
Cohort.
Figure 4. Comparing the performance of eXtreme Gradient Boosting (XGB) Algorithm with Logistic
Regression and Random Forest for the development cohort.
Propensity matching scores. The results of the propensity matching scores for the Survivor and Mortal-
ity Groups in the development dataset using Hosmer and Lemeshow Goodness of Fit (GOF) test are—X-squared
(1.2341), df (8), p value (0.9963), AIC value (241.148), Log-likelihood (− 94.574), adjusted R square (0.7509801),
Pseudo-R-squared values at—McFadden (0.750980), Nagelkerke (Cragg and Uhler) (0.799456). We achieved
following values for the validation set—X-squared (3.2107), df (8), p value (0.9204), AIC value (288.9656), Log-
likelihood (− 118.4828), adjusted R square (0.6598251), Pseudo-R squared values at McFadden (0.659825),
Nagelkerke (Cragg and Uhler) (0.740693).
Comparison. When the eXtreme Gradient Boosting (XGB) algorithm is compared with the other models,
the comparative results are given in Fig. 4. There is an overall improvement in AUC ROC Scores and Sensitivity
in the Gradient Boosting Model compared to the other two models studied.
Model specification—hazard ratio and survivability plots. We analysed the Hazard Ratios to deter-
mine each predictor’s effect and contribution in the model and their interplay with other factors. This is done
Scientific Reports | (2021) 11:12801 | https://doi.org/10.1038/s41598-021-92146-7 6
Vol:.(1234567890)www.nature.com/scientificreports/
Hazard ratio Confidence interval z p value
Age > 60 years 2.31 1.52–3.53 3.9 < 0.005
Gender (male) 1.72 1.06–2.85 − 2.2 0.03
Fever 0.28 0.16–0.46 − 4.85 < 0.005
Cough 1.02 0.7–1.47 0.09 0.82
Respiratory distress 1.01 0.62–1.53 0.02 0.84
Weakness 1.69 0.91–2.94 − 1.91 0.05
Diabetes 1.21 0.83–1.77 1 0.14
Hypertension 1.04 0.7–1.55 − 0.16 0.83
Chronic kidney disease 3.04 1.72–5.38 3.88 < 0.005
Chronic liver disease 3.95 1.16–13.42 2.2 0.02
Heart disease 1.56 0.91–2.69 1.61 0.11
ROR 1.54 1.03–2.3 2.03 0.04
Oxygen saturation (SpO2) 2.84 1.87–4.3 2.11 < 0.005
WBC count 1 1 4.9 0.91
Lymphocytes % 1.99 1.23–3.2 − 1.95 < 0.005
INR (prothrombin time) 0.96 0.82–1.13 2.83 0.64
Creatinine 0.82 0.78–0.87 − 0.47 < 0.005
Albumin 1.36 1.03–1.78 − 7.46 0.03
AST (liver enzyme) 1.11 0.89–1.33 1.86 0.01
Lactate dehydrogenase 4.02 2.66–6.07 2.54 < 0.005
Ferritin 2.48 1.32–4.74 6.61 < 0.005
C-reactive protein 1.65 1.11–2.46 − 2.95 0.01
Red cell distribution width 1.03 0.95–1.12 2.45 0.53
Table 2. Adjusted hazard ratios (multivariate) of the 23 Predictors, calculated based on 28 days Mortality in
validation Cohorts.
keeping in mind that the odd’s ratios in Table 1 are for single variables where the Hazard Ratios provide the
multivariable perspective. The hazard ratios of the 23 variables are provided in Table 2
Further to the Hazard Ratios analysis of individual clinical and laboratory predictors, we looked at the
predictors’ feature in survivability analysis using Kaplan Meier (KM) Plots. KM Plots were prepared for both
development and validation cohorts and studied for Comorbidities like Diabetes, Hypertension, and existing
Heart Diseases (Coronary Artery Diseases). Heart disease has a seemingly better outcome in the validation
cohort, probably due to early intervention and education among patients. In the validation cohort, we can see a
considerable change in—Respiratory Distress, Respiratory Rates > 24/min, and Oxygen Saturation below < 90%,
which reflects that despite best efforts, patients with significant respiratory failure at admission continue to have
a poorer prognosis in 28 days. In Laboratory parameters, LDH, INR, Ferritin, and Red cell Distribution Width
show almost similar trends, while low Lymphocyte% contributes higher mortality predominantly in Develop-
ment Cohort (Fig. 5).
Discussion
Interpretation. The AICOVID Risk Prediction Model uses the data from different Indian Hospitals and
populations and predicts the outcome (Mortality or Survival) of the patient at the time of admission with 23
Predictors (Clinical and Laboratory) data. This Model, with its existing accuracy, is a comprehensive AI-enabled
tool to assist the physician in (a) making triage decision, (b) provide guidance for resource allocation for High
and Moderate Risk patients, (c) put them in appropriate Clinical Algorithm (Protocol) Annexure 2 and finally
(d) provides a systemic approach of patient and family education related to disease severity during admission.
This tool uses basic clinical and laboratory predictors that can be easily accessed in low-cost Indian populations
and can be implemented as a secured application programming interface (API).
The model considers Patient’s Age above 60 years as an important predictor and High Risk of Mortality,
significantly shown here with higher hazard ratio in the validation cohort (2.31; CI 1.52–3.53)13. Interestingly,
CDC (Dec 2020) finds similar range of mortality comparison between patients below and above 65 years in US
population14. Further, male gender has hazard ratios (1.72, 95% CI 1.06–2.85) signifying higher risk of mortality
in male population, which is congruent to other international studies15 where odds of death has been (1.39; 95%
CI 1.31–1.47) comparable. Respiratory Symptoms like distress, higher rate of respiration (> 24/min) or silent
hypoxemia detected through lower oxygen level (< 90%) have shown higher risk of mortality (see Table 2) and
find their due weightage in the eXtreme Gradient Boosting (XGB) algorithm. The reason to include seemingly
similar attributes as they represent different aspects of symptoms and vital physiological parameters at admission.
This has also been studied extensively in US patients16. The study does not include the High and Moderate Risk
Scientific Reports | (2021) 11:12801 | https://doi.org/10.1038/s41598-021-92146-7 7
Vol.:(0123456789)www.nature.com/scientificreports/
1.00 1.00 1.00
0.90 0.90 0.90
0.80 0.80 0.80
0.70 0.70 0.70
0.60 0.60 0.60
0.50 0.50 0.50
0.40 0.40 0.40
0 7 14 21 28 35 0 7 14 21 28 35 0 7 14 21 28 35
Diabetes Hypertension Heart Disease Respiratory Distress RoR SpO2 Lymph LDH INR Ferritin RDW
1.00 1.00 1.00
0.90 0.90 0.90
0.80 0.80 0.80
0.70 0.70 0.70
0.60 0.60 0.60
0.50 0.50 0.50
0.40 0.40 0.40
0 7 14 21 28 35 0 7 14 21 28 35 0 7 14 21 28 35
Diabetes Hypertension Heart Disease Respiratory Distress RoR SpO2 Lymph LDH INR Ferritin RDW
Figure 5. The Graphs compare the KM Plots with the Model (N = 1393) [ABOVE] vs. the Validation (N = 977)
[BELOW] Cohorts. The Comorbidities, Respiratory condition at admission, and the significant lab parameters
are studied over five weeks for survival from the time of admission. The cut off values for Respiratory
Rate—> 24/min; SpO2—< 90%, Lymphocytes—< 10%, LDH > 250 U/L, INR > 1.3, Ferritin > 450 microgm/L and
RDW > 14.5% are studied here.
patients’ subsequent mechanical ventilation and their overall outcome. However, the Kaplan Meir plots (Fig. 5)
show outcomes for patients with severe respiratory symptoms at both development and validation cohorts.
The pooled prevalence of Diabetes and Hypertension are 26% and 31.22%, respectively, in the development
cohort. The odds of mortality in these comorbid conditions are provided in Table 1, comparable with the meta-
analysis conducted by Kumar et al.17. Hazard ratios associated with Chronic Kidney Disease (3.04, CI 1.72–5.38)
(Prevalence 6.2%) shows the higher associated risk with comparable results from ERA-EDTA Council and the
ERACODA Working G roup18. The prevalence of Chronic Liver Disease (3.95, CI 1.16–13.42) was comparatively
lower than other comorbidities, and hence hazard ratio is higher than other studies19. Hazard associated Pre-
existing Coronary Artery Disease (1.56, CI 0.91–2.69) (Prevalence 7.3%) showed a lesser hazard ratio probably
due to timely intervention and management, compared to studies by Cheng Y et al. and China CDC20,21.
In lab features conducted during admission, lymphopenia (Lymphocyte < 12%) had a hazard ratio (1.99, CI
1.23–3.2), which is consistent with the systemic review and meta-analysis22. Other significant factors included
pro-inflammatory markers like LDH (cut off—> 250 U/L), Ferritin (cut off—> 450 µg/L), and CRP (cut
off—> 48 mg/L) (See Hazard Ratio—Table 2). This is consistent with various international studies with slightly
modified cut-off v alues23–25. Though the study did not attribute different features like Neutrophil—Lymphocyte
Ratio or CRP / Albumin Ratio, it did look into the Hazard Ratios s eparately25.
As discussed above, the model takes all the above features, reasonably congruent with the published inter-
national studies, and provides the prediction using an eXtreme Gradient Boosting (XGB) method. The eXtreme
Gradient Boosting (XGB) method is a popular technique that recursively fits multiple predictors and a weak
learning system with the residual to increase the model’s accuracy using various iterations26. The model inherently
identifies the complex data structure—including their interaction and nonlinearity in the context of multiple
predictors. For further use, the model would be calibrated with the data provided in the API in Fig. 6 (seen here
with dummy data for quality assurance purpose) and continuously improve over a period of time. The Risk Model
is available for clinicians at http://20.44.39.47/covid19v2/page1.php.
Implication. All measures have been taken to reduce bias, including socio-economic aspects, as Apollo Hos-
pitals admitted patients from all society sections with moderate to severe diseases. Potential clinical use of the
Clinical API developed from the AICOVID Algorithm is currently being used in Apollo Hospitals. It can be
used in the Indian Subcontinent hospitals with the current accuracy and precision. In the prospective validation
study, patient written consents were obtained through an appropriately designed consent form (Annexure 4),
paving the way for further research of using written consent in Clinical AI-enabled tools and their appropriate
patient information.
The developed model—AICOVID and its corresponding Application—is being utilized for triaging, allo-
cating resources, putting patients into an appropriate clinical protocol, and patient and family education at
admission. This has reduced time to appropriate bed allocation and Isolation ER holding times. Further, it has
Scientific Reports | (2021) 11:12801 | https://doi.org/10.1038/s41598-021-92146-7 8
Vol:.(1234567890)www.nature.com/scientificreports/
Figure 6. The API Generated from the Algorithm which provides the Risk Score for dummy data on their
Clinical and Lab Parameters at admission (done for quality assurance purpose).
helped in reducing cost in ordering necessary tests at admission, thereby using patient’s and hospitals’ resources
at optimum.
Similar models have been created at MIT Sloan School10 and Tencent AI L ab27 using 7 and 10 clinical fea-
tures and similar accuracy and precision. However, these tools are more specific and accurate to the population
whose data is being used to build the models. The steps of the research is conducted in accordance with TRIPOD
Checklist28.
Limitation
The model is prepared with Clinical and Laboratory features that are available at the time of admission in
Emergency Room or other clinical settings. One of the study’s limitations is that it does not include imaging
tests done at the time of admission, as many of the critical patients couldn’t undergo imaging tests within first
6 h of admission. Due to logistical issues, certain clinical parameters like Body Mass Index (BMI) and follow-up
information on patient’s ventilation details were not obtained. Furthermore, due to the unavailability of adequate
data—certain laboratory markers like D-dimer and Interleukins were excluded. The research team is currently
undertaking the analysis of the follow-up care of these patients (survivors).
Geographical and Ethnic acceptance—The Apollo Hospitals included in the study are from Bangalore Chen-
nai, Delhi, Hyderabad, Kolkata, and Navi Mumbai. This provides comprehensive coverage of the Indian popula-
tion, looking at possible zones. However, further studies are required for validation and calibration purposes in
Western and Eastern (including North Eastern) zones. Beyond India, further research is needed to calibrate the
model when used in other population like the US, Europe, Middle East, and South East Asia.
Conclusion
This study and model on mortality risk prediction provides insight into the COVID Clinical and Laboratory
Parameters at admission with an accuracy of 97% at Development and 93% at Validation Cohort respectively. The
model is built to ensure that it can be used in low cost settings to improve triage and resource allocation. This is
one of the initial studies reflecting on ‘time to event’ at admission, accurately predicting patient outcomes, done
on the Indian population. Future studies should include a global approach with inclusion of Imaging parameters.
Data availability
Data cannot be shared with any 3rd party.
Received: 9 February 2021; Accepted: 31 May 2021
References
1. World Health Organization. Origin of SARS-CoV-2. 26 March 2020. WHO/2019-nCoV/FAQ/Virus_origin/2020.1. Accessed 10
Aug 2020.
2. Ministry of Health and Family Welfare, COVID-19 India. https://www.mohfw.gov.in. Accessed 10 Aug 2020.
3. Asch, D. A. et al. Variation in US hospital mortality rates for patients admitted with COVID-19 during the first 6 months of the
pandemic. JAMA Intern. Med. https://doi.org/10.1001/jamainternmed.2020.8193 (2020).
4. van Halem, K. et al. Risk factors for mortality in hospitalized patients with COVID-19 at the start of the pandemic in Belgium: a
retrospective cohort study. BMC Infect. Dis. 20, 897. https://doi.org/10.1186/s12879-020-05605-3 (2020).
5. Rosenthal, N., Cao, Z., Gundrum, J., Sianis, J. & Safo, S. Risk factors associated with in-hospital mortality in a US National sample
of patients with COVID-19. JAMA Netw. Open. 3(12), e2029058. https://doi.org/10.1001/jamanetworkopen.2020.29058 (2020).
Scientific Reports | (2021) 11:12801 | https://doi.org/10.1038/s41598-021-92146-7 9
Vol.:(0123456789)www.nature.com/scientificreports/
6. Bellan, M. et al. Fatality rate and predictors of mortality in an Italian cohort of hospitalized COVID-19 patients. Sci. Rep. 10, 20731.
https://doi.org/10.1038/s41598-020-77698-4 (2020).
7. Alimadadi, A. et al. Artificial intelligence and machine learning to fight COVID-19. Physiol. Genom. 52, 200–202. https://doi.org/
10.1152/physiolgenomics.00029.2020 (2020).
8. Pourhomayoun, M., & Shakibi, M. Predicting mortality risk in patients with COVID-19 using artificial intelligence to help medical
decision-making. medRxiv. https://doi.org/10.1101/2020.03.30.20047308 (2020).
9. Liang, W. et al. Development and validation of a clinical risk score to predict the occurrence of critical illness in hospitalized
patients with COVID-19. JAMA Intern. Med. https://doi.org/10.1001/jamainternmed.2020.2033 (2020).
10. Bertsimas, D. et al. COVID-19 mortality risk assessment: an international multi-center study. PLoS ONE 15(12), e0243262. https://
doi.org/10.1371/journal.pone.0243262 (2020).
11. Symptoms of Coronavirus. Updated Dec 22, 2020. https://www.cdc.gov/coronavirus/2019-ncov/symptoms-testing/symptoms.
html.
12. Clinical Management Protocol. COVID-19. Government of India Ministry of Health and Family Welfare Directorate General of
Health Services (EMR Division) Version 6. https://www.mohfw.gov.in/pdf/UpdatedDetailedClinicalManagementProtocolforC
OVID19adultsdated24052021.pdf.
13. Yanez, N. D. et al. COVID-19 mortality risk for older men and women. BMC Public Health 20, 1742. https://doi.org/10.1186/
s12889-020-09826-8 (2020).
14. Centre for Disease Control. Older Adults, At greater risk of requiring hospitalization or dying if diagnosed with COVID-19.
Updated 13 Dec 2020. https://www.cdc.gov/coronavirus/2019-ncov/need-extra-precautions/older-adults.html.
15. Peckham, H. et al. Male sex identified by global COVID-19 meta-analysis as a risk factor for death and ITU admission. Nat. Com-
mun. 11, 6317. https://doi.org/10.1038/s41467-020-19741-6 (2020).
16. Bahl, A. et al. Early predictors of in-hospital mortality in patients with COVID-19 in a large American cohort. Intern. Emerg. Med.
15(8), 1485–1499. https://doi.org/10.1007/s11739-020-02509-7 (2020).
17. Kumar, A. et al. Is diabetes mellitus associated with mortality and severity of COVID-19? A meta-analysis. Diabetes Metab. Syndr.
Clin. Res. Rev. 14, 535–545 (2020).
18. ERA-EDTA Council; ERACODA Working Group. Chronic kidney disease is a key risk factor for severe COVID-19: a call to action
by the ERA-EDTA. Nephrol. Dial. Transplant. 36(1), 87–94. https://doi.org/10.1093/ndt/gfaa314 (2021).
19. Frager, S. Z. et al. Hepatic predictors of mortality in severe acute respiratory syndrome coronavirus 2: role of initial aspartate ami-
notransferase/alanine aminotransferase and preexisting cirrhosis. Hepatol. Commun. https://doi.org/10.1002/hep4.1648 (2021).
20. Nishiga, M. et al. COVID-19 and cardiovascular disease: from basic mechanisms to clinical perspectives. Nat. Rev. Cardiol. 17,
543–558. https://doi.org/10.1038/s41569-020-0413-9 (2020).
21. Matsushita, K. et al. The relationship of COVID-19 severity with cardiovascular disease and its traditional risk factors: a systematic
review and meta-analysis. Glob. Heart 15(1), 64. https://doi.org/10.5334/gh.814 (2020).
22. Lu, Q. et al. Association of peripheral lymphocyte and the subset levels with the progression and mortality of COVID-19: a sys-
tematic review and meta-analysis. Front. Med. (Lausanne). 7, 558545. https://doi.org/10.3389/fmed.2020.558545 (2020).
23. Han, Y. et al. Lactate dehydrogenase, an independent risk factor of severe COVID-19 patients: a retrospective and observational
study. Aging (Albany NY). 12(12), 11245–11258. https://doi.org/10.18632/aging.103372 (2020).
24. Ji, D. et al. Clinical characteristics predicting progression of COVID-19. Lancet. https://doi.org/10.2139/ssrn.3539674 (2020).
25. Xu, J. et al. Associations of procalcitonin, C-reaction protein and neutrophil-to-lymphocyte ratio with mortality in hospitalized
COVID-19 patients in China. Sci. Rep. 10, 15058. https://doi.org/10.1038/s41598-020-72164-7 (2020).
26. Zhang, Z. et al. Predictive analytics with gradient boosting in clinical medicine. Ann. Transl. Med. 7(7), 152. https://doi.org/10.
21037/atm.2019.03.29 (2019).
27. Liang, W. et al. Early triage of critically ill COVID-19 patients using deep learning. Nat. Commun. 11, 3543. https://doi.org/10.
1038/s41467-020-17280-8 (2020).
28. Collins, G. S., Reitsma, J. B., Altman, D. G. & Moons, K. G. Transparent reporting of a multivariable prediction model for individual
prognosis or diagnosis (TRIPOD): the TRIPOD statement. BMJ 350, g7594 (2015).
Acknowledgements
This work was in collaboration between all the six Apollo Hospitals. We would like to thank all the Clinicians,
Leadership and Staffs who have contributed in this work. We would specifically like to mention Dr. Anil Tandon
from Group Medical Director Office, Mr. Arvind Sivaramakrishnan, Mr. Ranga Nathan, Mr. Bharath Potla, Mr.
Junaidh from the Apollo IT team, Mr. Raj Shukla and Mr. Ajith Tomy from Apollo 247 for all their help. We
also thank Ms. Jayanthi and the team from Apollo Research and Innovation for their assistance in preparing the
protocol for the study and helping out during the IEC Approval process.
Author contributions
S.K.—Conceptualisation, data curation, formal analysis, investigation, methodology, project administration,
resources, software, supervision, validation, visualisation, writing—original draft, and writing—review & edit-
ing. R.C.—Formal analysis, investigation, methodology, resources, validation, and writing—review & editing.
S.P.H.—Formal analysis, investigation, methodology, resources, validation, and writing—review & editing.
Accessed verified the underlying data. S.R.S.—Formal analysis, investigation, methodology, resources, valida-
tion, and writing—review & editing. Accessed verified the underlying data. N.R.—Formal analysis, investigation,
methodology, resources, validation, and writing—review & editing. R.V.—Formal analysis, investigation, meth-
odology, resources, validation, and writing—review & editing. A.S.—Conceptualisation, project administration,
resources, software, supervision, validation, and writing—review & editing. S.R.—Conceptualisation, project
administration, resources, software, supervision, validation, and writing—review & editing.
Funding
There was no available or separate funding for this research.
Competing interests
The authors declare no competing interests.
Scientific Reports | (2021) 11:12801 | https://doi.org/10.1038/s41598-021-92146-7 10
Vol:.(1234567890)www.nature.com/scientificreports/
Additional information
Supplementary Information The online version contains supplementary material available at https://doi.org/
10.1038/s41598-021-92146-7.
Correspondence and requests for materials should be addressed to S.K.
Reprints and permissions information is available at www.nature.com/reprints.
Publisher’s note Springer Nature remains neutral with regard to jurisdictional claims in published maps and
institutional affiliations.
Open Access This article is licensed under a Creative Commons Attribution 4.0 International
License, which permits use, sharing, adaptation, distribution and reproduction in any medium or
format, as long as you give appropriate credit to the original author(s) and the source, provide a link to the
Creative Commons licence, and indicate if changes were made. The images or other third party material in this
article are included in the article’s Creative Commons licence, unless indicated otherwise in a credit line to the
material. If material is not included in the article’s Creative Commons licence and your intended use is not
permitted by statutory regulation or exceeds the permitted use, you will need to obtain permission directly from
the copyright holder. To view a copy of this licence, visit http://creativecommons.org/licenses/by/4.0/.
© The Author(s) 2021
Scientific Reports | (2021) 11:12801 | https://doi.org/10.1038/s41598-021-92146-7 11
Vol.:(0123456789)You can also read