Critical Gambling Studies (2021)
←
→
Page content transcription
If your browser does not render page correctly, please read the page content below
Critical Gambling Studies (2021)
 Vol. 2, No. 1
 Early Career Research

 The Relationship Between Unexpected Outcomes and Lottery Gambling
 Rates in a Large Canadian Metropolitan Area

 Hin-Ngai Fu a, Eva Monson b, A. Ross Otto a*

a
 Department of Psychology, McGill University
b
 Department of Community Health Sciences, Université de Sherbrooke

Abstract: The purchase of lottery tickets is widespread in Canada, yet little research has directly examined when and why
individuals engage in lottery gambling. By leveraging a large urban dataset of lottery sales in Toronto, Canada, and using a simple
computational framework popular in psychology, we examined whether city residents gamble more when local outcomes are
better than expected; for example, wins by local sports teams or amounts of sunshine based on recent weather history. We found
that unexpectedly sunny days predict increased rates of fixed-prize lottery gambling. The number of local sports team wins also
predicted increased purchase rates of fixed-prize lottery, but unexpected positive outcomes in sports did not. Our results extend
previous findings examining the linkage between sunshine and gambling in metropolitan areas beyond the US, but do not fully
replicate the previously observed relationships between unexpected sports outcomes and gambling in US cities. These results
suggest that the observed malleability of lottery gambling in response to incidental events in the gambler’s environment may vary
considerably across geographies.

Keywords: prediction error, gambling, lottery, big data, mood

 Introduction For example, ‘Pick-4’ costs $1 per ticket and the odds for
 Purchasing lottery tickets is the most popular form the top prize of $5,000 are 1 in 10,000. Despite the
of legal gambling in Canada, with 65% of Canadians better odds of winning, fixed-prize lotteries incur a net
reporting that they purchase lottery tickets at least loss for gamblers (in terms of expected value), and when
weekly (Planinac et al., 2011). Further, a large proportion individuals decide to wager money on a highly unlikely
of gamblers participate in lottery gambling at least outcome, they are thought to be engaging in a type of
occasionally (i.e., more than 45% purchased tickets once risk-seeking behaviour (Rogers, 1998).
a month or more) (Short et al., 2015). Considered a In this study, we aim to understand what influences
leisure activity by many, lottery gambling is thus people’s day-to-day participation in fixed-prize
pervasive—for example, in the fiscal year 2018–2019, gambling in a large metropolitan area in Canada. Within
the lottery generated $3.7 billion of proceeds in Ontario the sphere of gambling research, there is a growing
alone (Ontario Lottery and Gaming Corporation, 2019). interest in examining the relationship between
 The lotteries offered by the Ontario Lottery and gambling practices and the external environment of
Gaming Corporation (OLG), can be classified into two lottery gamblers (Bedford, 2021; Casey, 2008; Nicoll,
categories: those with fixed prizes (e.g., ‘Daily Keno’, 2019). Here we seek to expand this line of inquiry and
‘Pick-2’, ‘Pick-4’) and those with progressive prizes (e.g., elucidate the relationship between environmental
‘Lottario’, ‘Lotto 6/49’, ‘Lotto Max’). The odds of winning factors and willingness to participate in gambling.
the jackpot for the progressive-prize lotteries range In the psychology literature, it has been
from 1 in 4,000,000 to 1 in 33,000,000; for example, demonstrated that unpredictable events in daily life
‘Lotto 6/49’ costs $3 per draw and the odds for the top drive variations in mood states (Clark & Watson, 1988;
prize (beginning at $3,000,000) are 1 in 13,983,816. The Kuppens et al., 2010), and these affective state changes
odds for the top prize in fixed-prize lotteries vary in turn are believed to influence an individual’s attitude
considerably depending on the format of the lottery. towards risk-taking (Ashby et al., 1999; Isen & Patrick,

*
 Corresponding author. Address: Department of Psychology, McGill University, 2001 McGill College Ave, 7th floor, Montreal QC H3A 1G1
Email address: ross.otto@mcgill.ca
H.-N. Fu et al. / Critical Gambling Studies, 2 (2021) 55–67

1983). At the same time, a body of work reveals how the outside of the United States (Kaizeler & Faustino, 2008).
effect of positive or negative outcomes upon an Interestingly, Toronto, as the largest urban area in
individual’s mood state is nuanced: an outcome exerts Canada with a population of 2.7 million (Statistics
a stronger effect when it is unexpected rather than Canada, 2017), is similar in size to the US cities studied
expected, and this manifests in both affective previously (New York City and Chicago). Toronto also
experience (Mellers et al., 1997; Shepperd & McNulty, has similar marked day-to-day fluctuations in rates of
2002) and momentary happiness (Rutledge et al., 2014). lottery purchase that mirror the pattern previously
It thus appears that the difference between expected observed in US cities. Toronto also similarly hosts
and true outcomes—so-called ‘prediction errors’— several professional sporting teams (i.e., 3 major
drive many important behavioural phenomena inside professional teams) as well as sunshine levels that
and outside the lab. exhibit comparable levels of intrinsic variability. Finally,
 Recently, we employed a ‘big data’ approach to as the structures of fixed-prize lottery games are, by and
understand how lottery gambling in New York City’s 8.5 large, similar across the United States and Canada, this
million residents varies over time as a function of study may help identify factors affecting gambling that
unexpected outcomes in the external environment are sensitive to cultural or regional differences. One
unrelated to lottery gambling (Otto et al., 2016). As such difference is the pervasiveness of professional
professional sports events and weather are a source of sports: New York City has 13 major league teams, across
continually occurring events known to exert striking the National Football League (NFL), Major League
effects on mood states (Cunningham, 1979; Edmans et Baseball (MLB), National Basketball Association (NBA),
al., 2007), we reasoned prediction errors from these National Hockey League (NHL), Major League Soccer
sources would alter risk attitudes via mood shifts that (MLS), National Women’s Soccer League (NWSL), and
would be evident in per-capita lottery ticket purchasing Women’s National Basketball Association (WNBA);
rates. Using a simple computational model to calculate whereas Toronto only has four teams across the NHL,
prediction errors stemming from local professional NBA, MLB, and MLS. Taking this as an indicator of how
sports teams and local sunshine that spanned an entire much influence sports outcomes exert on residents’
year, we were able to quantify the extent to which 1) the psychological states, we might expect that the
city’s professional sports teams had performed better or influence of sports on local residents’ lottery gambling
worse than expectations based on recent performance, behaviour might be attenuated in Toronto.
and 2) the extent to which the day’s sunshine was Accordingly, here we aimed to leverage the well-
greater or less than expectations informed by recent characterized relationship between mood states and
sunshine levels. We found that positive, unexpected risk attitudes established in the previous US-based
local outcomes stemming from sports and weather— studies to examine which mood-influencing events in
but importantly, not absolute outcomes in either the external environment predict when residents of a
domain—predicted increases in day-to-day lottery large Canadian metropolitan area (the Toronto
gambling behaviour (Otto et al., 2016). Metropolitan Area) are more likely to participate in
 Further, a recent follow-up study demonstrated that lottery gambling. Our hypothesis is that both sports and
the predictive relationships between sports- and sunshine-based prediction errors will have a significant
sunshine-based prediction errors and lottery gambling and positive relationship with lottery gambling.
rates are observable in other metropolitan regions in Critically, we were able to assess how rates of fixed-prize
the United States—in this case, the Chicago lottery gambling in Toronto respond to these kinds of
metropolitan statistical area (Otto & Eichstaedt, 2018). prediction errors over the course of two years (2014 and
This work complements a growing body of work 2015), at the same time controlling for the influence of
suggesting that these deviations from short-term cyclical variables such as seasonal and day-of-week
expectations exert a larger impact on positive mood effects. This rich dataset allows us to examine these day-
states than outcomes themselves (Eldar et al., 2016; to-day changes in gambling behaviour across nearly
Rutledge et al., 2014; Villano et al., 2020; Vinckier et al., 100 diverse neighborhoods. Again, to ensure that
2018) and these mood states in turn have well- fluctuations in lottery consumption are not driven by
documented effects on risk attitudes (Bassi et al., 2013; changes in jackpot value—as in the case of jackpot-
Isen & Patrick, 1983; Schulreich et al., 2014). At the same based gambles where prize values change over time—
time, these large-scale real-world datasets further we only considered fixed-prize lottery tickets
demonstrate the malleability of individuals’ gambling administered by the Ontario Lottery and Gaming
propensities, opening the door to further examine Commission (e.g., ‘Daily Keno’, ‘Megadice Lotto’, ‘Pick-
possible linkages between events (unexpected or 2’). In turn, the expected values of the gambles
otherwise) in the gambler’s environment and their considered do not vary as a function of time or the
attitudes toward lottery gambling. number of winning participants. Thus, we believe that
 On the basis of this line of work, an open question the day-to-day variations in lottery ticket purchases
remains concerning the extent to which the predictive would reflect factors extrinsic to the lotteries
relationship between unexpected positive outcomes themselves, possibly reflecting changes in the
and lottery gambling rates generalizes to populations

 56
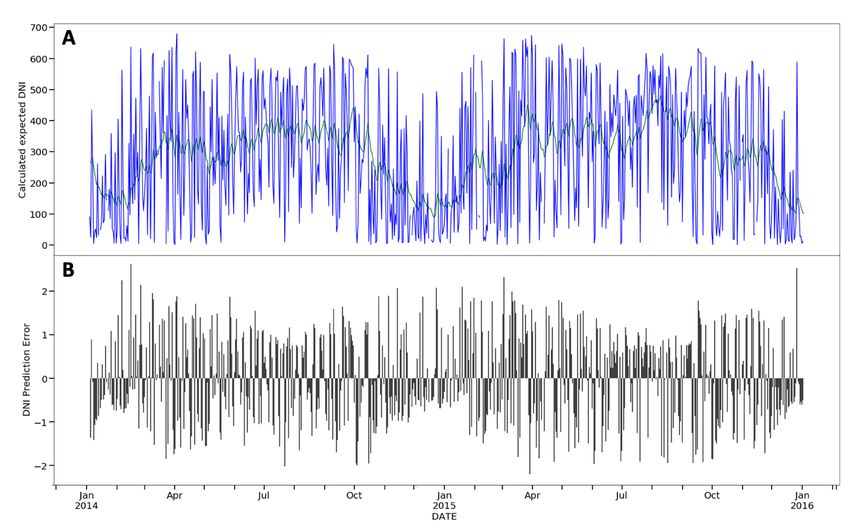
H.-N. Fu et al. / Critical Gambling Studies, 2 (2021) 55–67

gamblers’ underlying risk attitudes (Conlisk, 1993; aggregated daily sales data in the City of Toronto for all
Rogers, 1998). fixed-prize lottery tickets available (i.e., ‘Daily Keno’,
 ‘Living the Life Lottery’, ‘Megadice Lotto’, ‘NHL Lotto’,
 Method ‘Pick-2’, ‘Pick-4’, ‘Poker Lotto’, and ‘Wheel of Fortune’).
Toronto Lottery Data This includes all the FSAs beginning with ‘M’; 100 FSAs
 Via an Access to Information Act request, we in total (see Fig. 1A).
acquired fixed-prize lottery purchase data by forward We sought to analyze the effect of prediction errors
sortation area (FSA) for the years 2014 and 2015 in at a per-capita level in the city and on the individual FSA
Toronto from the Ontario Lottery and Gaming level. One possible confounding factor is FSAs that are
Corporation (OLG). FSAs are defined as geographic mostly comprised of commercial or industrial real
regions where all postal codes share the same three estate. To ensure that our analysis only covered
starting characters, roughly correspond to city residential zones, we only included FSAs with 1000 or
neighborhoods, and are associated with well-defined more adult residents, according to the 2011 National
geographical boundaries in the Greater Toronto Area Household Survey (Statistics Canada, 2013), which left
(Varga et al., 2013). Further, the 2011 census provides 95 FSAs for analysis.
rich FSA-level demographic information. We requested

Fig. 1. Timecourse of daily-lottery purchases in Toronto fluctuate heavily every day in the years 2014 and 2015. (A)
The composite per-capita purchases of daily-lottery tickets, in 4 different forward sortation areas (FSAs) and averaged
over all FSAs, shows strong weekly cyclical effects. (B) After controlling for a number of cyclical and non-cyclical
nuisance variables (Methods), we still observe variations in purchase rates correlated at the FSA level in the city-wide
average.

Demographic Data & Eichstaedt, 2018; Otto et al., 2016). Intuitively, larger
 We computed the number of adult residents per FSA DNI values are indicative of sunnier days (i.e., absence of
from population data acquired from the 2011 National cloud cover). For each day in 2014 and 2015, we
Household Survey (Statistics Canada, 2013). calculated the mean DNI between sunrise and sunset to
 use as our daily estimate of solar irradiance. A daily
Sunshine Data exponentially weighted average was calculated with
 We used satellite-derived estimates of Direct Normal the equation (Fig. 2A; Otto & Eichstaedt, 2018; Otto et
Irradiance (DNI), a measure of solar irradiance in units of al., 2016):
W/m2 on a surface normal to the sun, obtained from
Clean Power Research (www.SolarAnywhere.com), DNI(t+1) = DNI(t) + α[DNI(t) − DNI(t)]
following our previous analyses of sunshine data (Otto

 57

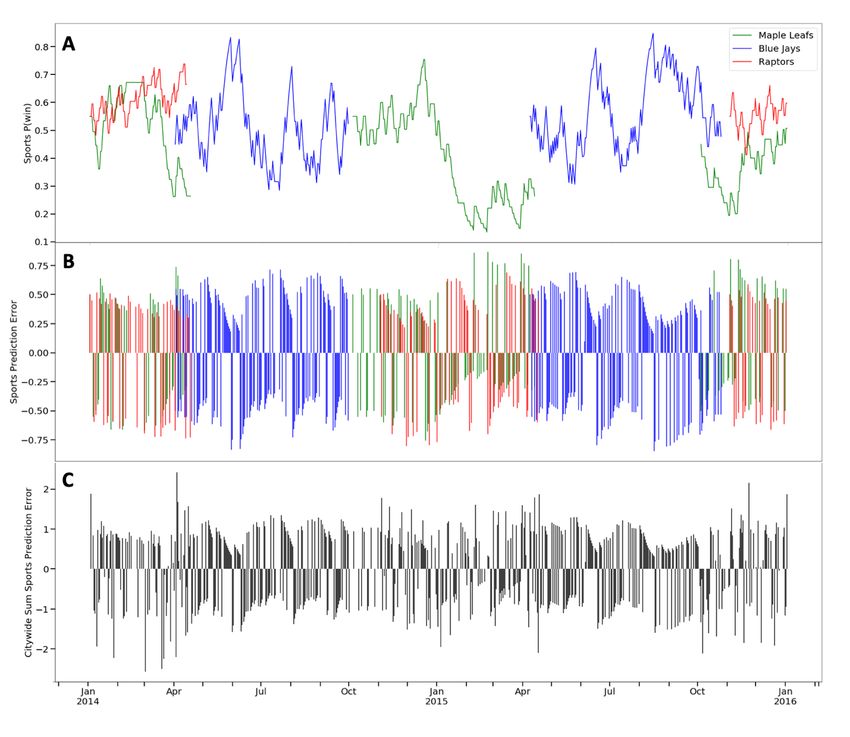
H.-N. Fu et al. / Critical Gambling Studies, 2 (2021) 55–67

 In accordance with previous work employing the forward from the previous day, which parallels the trial-
same prediction error computation, the recency based learning algorithms used in experimental
parameter, α, was set to a value of 0.1 (Otto & Eichstaedt, literature (Rutledge et al., 2014). In this model, the
2018; Otto et al., 2016). The prediction error for a given prediction error for a team on a given day is simply the
day was calculated as the difference between expected difference between that day’s expected outcome Pwin(t)
and observed DNI, computed as DNI(t) minus DNI(t) (previous day’s moving average) and the outcome, O(t)
(Fig. 2B). (Fig. 3B):

 Sports Outcomes PE(t) = O(t) – Pwin(t)
 The sports outcomes (wins, losses, and ties) of
regular and post-season games played by the Toronto Each day, the prediction errors from teams that
teams in the National Basketball Association (NBA), played on that day were summed to compute a ‘city-
National Hockey League (NHL), and Major League wide’ sports prediction error, which represents how
Baseball (MLB)—identified as the three most popular much better or worse the city’s teams performed
teams in Canada by fan base size (Elevent, 2020)—were compared with recent expectations (Fig. 3C; Otto &
obtained from the ESPN website (www.espn.com) for Eichstaedt, 2018; Otto et al., 2016).
the years 2014 and 2015. To calculate prediction error
from sports team results, we calculated an Nuisance Variables
exponentially weighted average (Otto & Eichstaedt, As in the Otto et al. (2016) and Otto and Eichstaedt
2018; Otto et al., 2016) in order to estimate the (2018) studies, we specified several ‘dummy’ variables
probability of winning for each team Pwin, adjusting this to control for year, day-of-week effects, month-of-year
estimate after each game based on the deviation effects, statutory holidays, common paycheque cycles,
between outcome and previous prediction (Fig. 3A): severe weather events, and in accordance with prior
 ( + 1) = ( + [ ( ) − ( )] work (Evans & Moore, 2011) for statutory holidays (New
 In this equation, t is the day of the year, O(t) is the Year’s Day, Family Day, Good Friday, Victoria Day,
outcome (win = 1, loss = 0, tie = 0.5) on that day, and α Canada Day, Labour Day, Thanksgiving, Christmas Day,
is a recency parameter (i.e., learning rate) that makes and Boxing Day). Common paycheque receipt days—
recent outcomes more influential than those in earlier 1st and 15th of each month—were separately dummy-
days. Similar to the analysis of sunshine, α, was set to a coded (if these fell on the weekends, the immediately
value of 0.1 (Otto & Eichstaedt, 2018; Otto et al., 2016). preceding weekday was used).
On days where a team did not play, Pwin was carried

Fig. 2. Direct Normal Irradiance (DNI) varies throughout the year. (A) The cyclical nature of irradiance in Toronto varies
from season to season. As expected, it is high during the summer months and low during the winter months.
However, day-to-day variation still exists which contributes to prediction errors. (B) Prediction error from solar
irradiance is computed as the divergence between the calculated expected DNI and the observed DNI.
 58
H.-N. Fu et al. / Critical Gambling Studies, 2 (2021) 55–67

Fig. 3. Calculation of sports-based prediction errors. (A) The exponentially weighted estimates of winning
probabilities, P(win), for each of the three teams. The estimate is updated after every game based on their predicted
probability of winning. (B) The prediction error associated with winning calculated as the difference between the
outcome and the modelled P(win). (C) City-wide sports-based prediction error calculated by summing each team’s
prediction error for each day, which mirrors a composite deviation from expectation among teams.

Data Analysis Approach Results
 For each FSA, we summed the sales of lottery tickets Overall Lottery Data Characteristics
and divided the composite by the adult population For each FSA, we aggregated the dollar sales of each
associated with the FSA to control for population ticket and divided this composite by the FSA’s
differences across FSAs (Oster, 2004; Otto & Eichstaedt, population, computing a composite-per-capita score of
2018; Otto et al., 2016), which was then log-transformed lottery gambling (Fig. 1A). Influences of the nuisance
to yield our dependent measure of log purchases per variables (day-of-week, month-of-year, etc.) were
adult. For the analysis, there were 69,337 observations removed using the mixed-effects regression, resulting
over the two-year period. Linear regressions were then in residual timecourses of lottery gambling for each
conducted as mixed-effects models, performed using postal code (Fig. 1B). The observation that these
the lme4 package (Pinheiro & Bates, 2000) in the R residual timecourses of gambling correlate across
programming language. The linear regression neighbourhoods suggests that common causes,
specification included all the dummy-coded nuisance unexplained by cyclicality or seasonality, might
regressors described above, with all predictor variables influence these apparent fluctuations in city-wide
(both nuisance variables and variables of interest) taken gambling behaviour (mean r = 0.39 across all FSAs in
as random effects over FSAs. 2014 and 2015).
 Across the four regression models described below
 (Tables 1–4), we consistently observed cyclical effects
 such as day-of-week and month-of-year (i.e.,

 59
H.-N. Fu et al. / Critical Gambling Studies, 2 (2021) 55–67

seasonality) effects typically observed in lottery sunshine-based prediction error on fixed-prize lottery
purchase behaviour (Otto et al., 2016). Interestingly, we ticket sales (β Irradiance PE = 0.0025, p
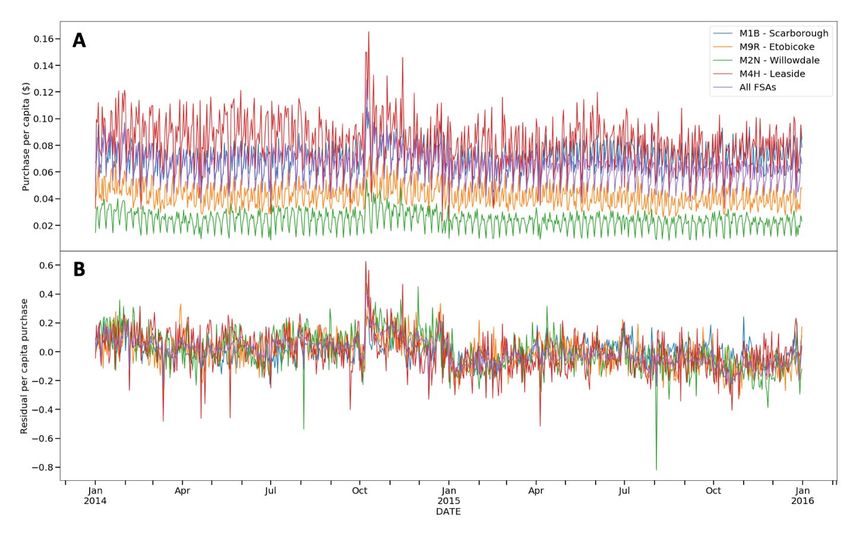
H.-N. Fu et al. / Critical Gambling Studies, 2 (2021) 55–67

Fig. 5. Fixed-prize lottery purchases as a function of predicted and total sports wins. (A) Prediction errors from Toronto
sporting events are positively associated with an increase in fixed-prize lottery purchases the day after the game. (B)
City-wide sport wins are also positively associated with increases in fixed-prize lottery purchases the following day.

 Discussion wins predicted increased gambling rates. One potential
 In a large Canadian metropolitan area, we found explanation for these divergent results is the differences
evidence suggesting that the relationship between in sports culture. In New York City—the setting of the
unexpected outcomes in the environment—that is, Otto et al. (2016) study—there are currently 13 major
weather and sports—and fixed-prize lottery gambling sports teams across seven leagues compared to four
might be dependent on outcome type. We observed teams in four leagues in Toronto. The New York
that unexpected sunshine prediction error has a metropolitan area is also home to six different venues
significant positive relationship with lottery purchase for their major teams (including Barclays Center, Citi
rates, replicating previous results (Otto & Eichstaedt, Field, Madison Square Garden, and MetLife Stadium),
2018; Otto et al., 2016). On a day that had the largest whereas Toronto only has three (Scotiabank Arena,
observed sunshine prediction error, we observed a Rogers Centre, BMO Field). A greater number of teams
0.0483% increase in fixed-prize lottery purchase rates. and stadiums is a sign of an increased presence of sports
However, we also uncovered an unexpected overall culture in everyday life, suggesting that professional
negative effect of absolute sunshine levels on lottery sports may exert more influence in New York City
purchase rates—sunnier days appeared to be compared to Toronto. Additionally, Toronto’s
associated with lower levels of lottery gambling. professional hockey team—the Maple Leafs, which
 With respect to local sports outcomes, we did not constituted a large amount of the sports outcomes in
find that unexpected sports wins (i.e., prediction errors) question—performed generally poorly during the time
emerged as a significant predictor of lottery gambling period in question (see Fig. 3A), so it is possible that
behaviour, but absolute sports outcomes—that is the Toronto residents had a blunted affective response to
proportion of teams winning on the previous day—did unexpected outcomes, possibly due in part to limited
predict lottery purchase rates. On days following the interest or attention in games stemming from poor
maximum observed number of sports wins (i.e., two performance (Paul & Weinbach, 2013). Finally, we
days), we observed a 0.007% increase in fixed-lottery should note the possibility that the increases in lottery
sales. An explanation for this phenomenon might be gambling observed after local sports wins in Toronto
due to sports fans’ desire to ‘continue playing’ or could be driven by short-term increases in disposable
‘continue winning,’ which might lead to an increased income resulting from sports gambling payouts.
desire to participate in gambling activities. Relatedly, this sensitivity to sports outcomes might be
Interestingly, these sports findings dovetail well with amplified by individuals either attending ‘home’
previous work revealing how sports outcomes sporting events or gathering with others to watch
themselves—irrespective of expectations—drive stock sporting events socially, who would be inclined to
market returns, presumably due to investor mood shifts purchase tickets away from their homes to continue
(Edmans et al., 2007). their experience of play (Reith, 2002).
 This pattern of results does not fully replicate our Similarly, the colder climate of Toronto (compared
previous study in New York City (Otto et al., 2016), which to New York City) may explain the observation here that
found that only unexpected—but not absolute—sports Toronto residents purchased fewer lottery tickets on
 61
H.-N. Fu et al. / Critical Gambling Studies, 2 (2021) 55–67

sunnier days, as on these days they may seek alternate point-of-sales. Indeed, previous work suggests more
outdoor activities (possibly further away from lottery subjective motivations for lottery play such as the desire
retailers). In contrast, in New York City, we only to win, curiosity, and intrinsic enjoyment of lottery play
observed that prediction errors stemming from (Miyazaki et al., 1999)—this potential link to the day-to-
sunshine—rather than sunshine levels themselves— day changes in lottery gambling rates observed here
reliably predicted lottery gambling behaviour (Otto et warrants further exploration.
al., 2016). Lottery gambling is, for the most part, seen as a
 Although our analysis demonstrated how prediction relatively harmless leisure activity that, despite
errors (or outcomes) in the environment can affect widespread participation, results in low rates of
fixed-prize lottery purchases, due to the nature of the associated gambling-related problems (e.g., Costes et
dataset, a possible limitation arises from the inability to al., 2018). However, these results remain valuable in
discern purchases from residents of the FSA from accurately understanding the external influences on
purchases by non-residents (e.g., commuters). We gambling behaviour; specifically, the environmental
attempted to address this problem by excluding FSAs factors that shape individuals’ day-to-day decisions to
with low populations (less than 1000 residents): this gamble.
mainly targeted commercial FSAs in the downtown area
of Toronto, which have inflated lottery purchase rates Authors’ Note
presumably due to commuter activity. In a recent Raw data pertaining to this study can be accessed
examination of this same dataset, we found that fixed- via the Open Science Framework at
prize lotteries are purchased more by individuals in https://osf.io/eh8xb.
lower-socioeconomic status (SES) than in higher-SES
neighborhoods (Fu et al., 2021), suggesting that the References
observed purchase rates of individual FSAs likely Ashby, F. G., Isen, A. M., & Turken, A. U. (1999). A neuropsychological
reflects the behaviour of their residents. At the same theory of positive affect and its influence on cognition.
 Psychological Review, 106(3), 529–550.
time, SES has previously been linked to problem https://doi.org/10.1037/0033-295X.106.3.529
gambling (Orford et al., 2010; Welte et al., 2004). While Bassi, A., Colacito, R., & Fulghieri, P. (2013). ’O sole mio: An
the effect sizes of the sunshine- and sports-based experimental analysis of weather and risk attitudes in financial
prediction errors observed in the present study are decisions. The Review of Financial Studies, 26(7), 1824–1852.
 https://doi.org/10.1093/rfs/hht004
rather subtle compared to these SES effects, the Bedford, K. (2021). Gambling and political economy, revisited. New
generality of the prediction error effects (particularly Political Economy, 26(2), 250–260.
with respect to sunshine) across geographies is https://doi.org/10.1080/13563467.2020.1841138
noteworthy. Moving forward, it would be beneficial to Casey, E. (2008). Working class women, gambling and the dream of
 happiness. Feminist Review, 89(1), 122–137.
investigate the number of retailers within each FSA and https://doi.org/10.1057/fr.2008.2
its relation to lottery purchases, as previous studies Clark, L. A., & Watson, D. (1988). Mood and the mundane: Relations
have found that the density of electronic gambling between daily life events and self-reported mood. Journal of
machines was negatively correlated with SES (Raisamo Personality and Social Psychology, 54(2), 296–308.
 https://doi.org/10.1037/0022-3514.54.2.296
et al., 2019). Relatedly, online lottery ticket purchasing Conlisk, J. (1993). The utility of gambling. Journal of Risk and
was introduced by OLG at the beginning of 2015 Uncertainty, 6(3), 255–275. https://doi.org/10.1007/BF01072614
(midway through the period we analyzed), but our Costes, J.-M., Kairouz, S., Monson, E., & Eroukmanoff, V. (2018). Where
dataset only covers in-person lottery ticket purchases. lies the harm in lottery gambling? A portrait of gambling
 practices and associated problems. Journal of Gambling Studies,
Future work could investigate the effects of introducing 34(4), 1293–1311. https://doi.org/10.1007/s10899-018-9761-3
online lotto play and the differences between spending Cunningham, M. R. (1979). Weather, mood, and helping behavior:
behaviours in online versus offline gambling. Quasi experiments with the sunshine samaritan. Journal of
 These findings sharpen our understanding of Personality and Social Psychology, 37(11), 1947–1956.
 https://doi.org/10.1037/0022-3514.37.11.1947
Canadians’ gambling behaviours in a large, diverse Edmans, A., García, D., & Norli, Ø. (2007). Sports sentiment and stock
metropolitan region. Previous research has returns. The Journal of Finance, 62(4), 1967–1998.
demonstrated that individuals engage in lottery https://doi.org/10.1111/j.1540-6261.2007.01262.x
gambling for reasons beyond pure financial gain: it can Eldar, E., Rutledge, R. B., Dolan, R. J., & Niv, Y. (2016). Mood as
 representation of momentum. Trends in Cognitive Sciences,
become embedded in everyday life, taking on a broad 20(1), 15–24. https://doi.org/10.1016/j.tics.2015.07.010
range of meanings that vary across cultures and Elevent. (2020). Most popular sports teams among fans in Canada as
contexts (e.g., Bedford, 2021; Casey, 2008; Nicoll, 2019). of December 2019 [Graph]. Statista. Retrieved December 01,
The present research contributes to a growing body of 2020, from https://www.statista.com/statistics/1137249/sports-
 teams-canada-popularity/
work aimed at deepening our understanding of the way Evans, W. N., & Moore, T. J. (2011). The short-term mortality
consumption practices inform both culture and the consequences of income receipt. Journal of Public Economics,
subjective and material realities of gamblers (Casey, 95(11–12), 1410–1424.
2008). For example, our results suggest that the https://doi.org/10.1016/j.jpubeco.2011.05.010
 Fu, H.-N., Monson, E., & Otto, A. R. (2021). Relationships between
relationship between environmental factors, such as socio-economic status and lottery gambling across lottery types:
sunshine, and lottery gambling might be more complex Neighborhood-level evidence from a large city. Addiction,
than weather merely affecting accessibility to lottery 116(5), 1256–1261. https://doi.org/10.1111/add.15252

 62
H.-N. Fu et al. / Critical Gambling Studies, 2 (2021) 55–67

Isen, A. M., & Patrick, R. (1983). The effect of positive feelings on risk Short, M. M., Penney, A. M., Mazmanian, D., & Jamieson, J. (2015).
 taking: When the chips are down. Organizational Behavior and Lottery ticket and instant win ticket gambling: Exploring the
 Human Performance, 31(2), 194–202. distinctions. Journal of Gambling Issues, 30(May), 6–21.
 https://doi.org/10.1016/0030-5073(83)90120-4 https://doi.org/10.4309/jgi.2015.30.4
Kaizeler, M. J., & Faustino, H. C. (2008). Demand for lottery products: Statistics Canada. (2013). 2011 National Household Survey, Forward
 A cross-country analysis (No. 2008/33; Working Papers Sortation Area (FSA) Level (Version V4) [custom tabulation].
 Department of Economics). ISEG—Lisbon School of Economics Scholars Portal Dataverse. https://hdl.handle.net/10864/10517
 and Management, Department of Economics, Universidade de Statistics Canada. (2017). Toronto, C [Census subdivision], Ontario
 Lisboa. Retrieved from and Canada [Country] (table). Census Profile.
 https://ideas.repec.org/p/ise/isegwp/wp332008.html https://www12.statcan.gc.ca/census-recensement/2016/dp-
Kuppens, P., Oravecz, Z., & Tuerlinckx, F. (2010). Feelings change: pd/prof/index.cfm?Lang=E
 Accounting for individual differences in the temporal dynamics Varga, C., Pearl, D. L., McEwen, S. A., Sargeant, J. M., Pollari, F., &
 of affect. Journal of Personality and Social Psychology, 99(6), Guerin, M. T. (2013). Evaluating area-level spatial clustering of
 1042–1060. https://doi.org/10.1037/a0020962 Salmonella Enteritidis infections and their socioeconomic
Mellers, B. A., Schwartz, A., Ho, K., & Ritov, I. (1997). Decision affect determinants in the greater Toronto area, Ontario, Canada
 theory: Emotional reactions to the outcomes of risky options. (2007–2009): A retrospective population-based ecological study.
 Psychological Science, 8(6), 423–429. BMC Public Health, 13(1), 1078. https://doi.org/10.1186/1471-
 https://doi.org/10.1111/j.1467-9280.1997.tb00455.x 2458-13-1078
Miyazaki, A. D., Langenderfer, J., & Sprott, D. E. (1999). Government- Villano, W. J., Otto, A. R., Ezie, C. E. C., Gillis, R., & Heller, A. S. (2020).
 sponsored lotteries: Exploring purchase and nonpurchase Temporal dynamics of real-world emotion are more strongly
 motivations. Psychology & Marketing, 16(1), 1–20. linked to prediction error than outcome. Journal of Experimental
 https://doi.org/10.1002/(SICI)1520-6793(199901)16:13.0.CO;2-W https://doi.org/10.1037/xge0000740
Nicoll, F. J. (2019). Gambling in everyday life: Spaces, moments and Vinckier, F., Rigoux, L., Oudiette, D., & Pessiglione, M. (2018). Neuro-
 products of enjoyment. Routledge. computational account of how mood fluctuations arise and
Ontario Lottery and Gaming Corporation. (2019). 2018-19 Annual affect decision making. Nature Communications, 9, 1708.
 Report. Retrieved from https://about.olg.ca/wp- https://doi.org/10.1038/s41467-018-03774-z
 content/uploads/2019/10/OLG-Annual-Report-2018-19_EN.pdf Welte, J. W., Wieczorek, W. F., Barnes, G. M., Tidwell, M.-C., & Hoffman,
Orford, J., Wardle, H., Griffiths, M., Sproston, K., & Erens, B. (2010). The J. H. (2004). The relationship of ecological and geographic factors
 role of social factors in gambling: Evidence from the 2007 British to gambling behavior and pathology. Journal of Gambling
 Gambling Prevalence Survey. Community, Work & Family, 13(3), Studies, 20(4), 405–423. https://doi.org/10.1007/s10899-004-
 257–271. https://doi.org/10.1080/13668803.2010.488101 4582-y
Oster, E. (2004). Are all lotteries regressive? Evidence from the
 Powerball. National Tax Journal, 57(2), 179–187.
Otto, A. R., & Eichstaedt, J. C. (2018). Real-world unexpected
 outcomes predict city-level mood states and risk-taking Funding Statement
 behavior. PLOS ONE, 13(11), e0206923. This research was supported by a SSHRC Insight Grant
 https://doi.org/10.1371/journal.pone.0206923 awarded to Otto and an award from Fonds de
Otto, A. R., Fleming, S. M., & Glimcher, P. W. (2016). Unexpected but
 incidental positive outcomes predict real-world gambling.
 Recherche du Québec—Société et Culture to Monson.
 Psychological Science, 27(3), 299–311.
 https://doi.org/10.1177/0956797615618366
Paul, R., & Weinbach, A. (2013). Uncertainty of outcome and Author Details
 television ratings for the NHL and MLS. Journal of Prediction
 Markets, 7(1), 53–65. https://doi.org/10.5750/jpm.v7i1.587 Hin-Ngai Fu is a research assistant in the
Pinheiro, J. C., & Bates, D. M. (2000). Linear mixed-effects models: Department of Psychology at McGill University
 Basic concepts and examples. In Mixed-Effects Models in S and S- (Canada). His research interests include using big data /
 Plus, 3–56. Springer. https://doi.org/10.1007/0-387-22747-4_1 machine learning methods to understand
Planinac, L. C., Cohen, J. E., Reynolds, J., Robinson, D. J., Lavack, A., &
 Korn, D. (2011). Lottery promotions at the point-of-sale in psychological phenomena. He aims to develop a keen
 Ontario, Canada. Journal of Gambling Studies, 27(2), 345–354. understanding of machine learning and apply it to his
 https://doi.org/10.1007/s10899-010-9208-y future work.
Raisamo, S., Toikka, A., Selin, J., & Heiskanen, M. (2019). The density of Eva Monson is a professor at Université de
 electronic gambling machines and area-level socioeconomic
 status in Finland: A country with a legal monopoly on gambling Sherbrooke (Canada) and a researcher at the Centre de
 and a decentralised system of EGMs. BMC Public Health, 19(1), recherche Charles-Le Moyne—Saguenay–Lac-Saint-
 1198. https://doi.org/10.1186/s12889-019-7535-1 Jean sur les innovations en santé (CR-CSIS). Her current
Reith, G. (2002). The age of chance: Gambling in Western culture. research is devoted to investigating how social and
 Routledge.
Rogers, P. (1998). The cognitive psychology of lottery gambling: A environmental deprivation, from the level of the
 theoretical review. Journal of Gambling Studies, 14(2), 111–134. individual to the neighbourhood in which they reside,
 https://doi.org/10.1023/A:1023042708217 influence gambling practices.
Rutledge, R. B., Skandali, N., Dayan, P., & Dolan, R. J. (2014). A Ross Otto is an Assistant Professor in the
 computational and neural model of momentary subjective well-
 being. Proceedings of the National Academy of Sciences, Department of Psychology at McGill University
 111(33), 12252–12257. https://doi.org/10.1073/pnas.1407535111 (Canada). His work relies on a combination of
Schulreich, S., Heussen, Y. G., Gerhardt, H., Mohr, P. N. C., Binkofski, F. computational, behavioural, psychophysiological, and
 C., Koelsch, S., & Heekeren, H. R. (2014). Music-evoked incidental (more recently) ‘big data’ techniques to understand
 happiness modulates probability weighting during risky lottery
 choices. Frontiers in Psychology, 4, 981. how people make decisions both in the laboratory and
 https://doi.org/10.3389/fpsyg.2013.00981 in the real world.
Shepperd, J. A., & McNulty, J. K. (2002). The affective consequences of
 expected and unexpected outcomes. Psychological Science,
 13(1), 85–88. https://doi.org/10.1111/1467-9280.00416

 63
H.-N. Fu et al. / Critical Gambling Studies, 2 (2021) 55–67

Table 1
Mixed-effects regression coefficients for model estimating effect of Solar Irradiance prediction errors (PEs) on log per-
person lottery purchases. Predictor variables in capital letters denote nuisance variables coding for year (2014 vs.
2015), day of week, month of year, the first and fifteenth of the month, and statutory holidays.

 Std.
 Coefficient Estimate p-value
 Error
 (Intercept) -3.1232 0.0846
H.-N. Fu et al. / Critical Gambling Studies, 2 (2021) 55–67

Table 2
Mixed-effects regression coefficients for model estimating effect of Solar Irradiance PEs and Solar Irradiance on log
per-person lottery purchases.

 Std.
 Coefficient Estimate p-value
 Error
 (Intercept) -3.1312 0.0846
H.-N. Fu et al. / Critical Gambling Studies, 2 (2021) 55–67

Table 3
Mixed-effects regression coefficients for model estimating effect of City-wide (Sum) Sports PEs on log per-person
lottery purchases.

 Std.
 Coefficient Estimate p-value
 Error
 (Intercept) -3.1078 0.0847
H.-N. Fu et al. / Critical Gambling Studies, 2 (2021) 55–67

Table 4
Mixed-effects regression coefficients for model estimating effect of City-wide (Sum) Sports PEs and City-wide Sports
Wins on log per-person lottery purchases.

 Std.
 Coefficient Estimate p-value
 Error
 (Intercept) -3.1221 0.0850
You can also read