Introducing the extended volatility range proton-transfer-reaction mass spectrometer (EVR PTR-MS)
←
→
Page content transcription
If your browser does not render page correctly, please read the page content below
Atmos. Meas. Tech., 14, 1355–1363, 2021
https://doi.org/10.5194/amt-14-1355-2021
© Author(s) 2021. This work is distributed under
the Creative Commons Attribution 4.0 License.

Introducing the extended volatility range proton-transfer-reaction
mass spectrometer (EVR PTR-MS)
Felix Piel1,2,a , Markus Müller1 , Klaus Winkler1 , Jenny Skytte af Sätra3,b , and Armin Wisthaler2,3
1 IONICON    Analytik, Innsbruck, Austria
2 Institutefor Ion Physics and Applied Physics, University of Innsbruck, Innsbruck, Austria
3 Department of Chemistry, University of Oslo, Oslo, Norway
a now at: Department of Chemistry, University of Oslo, Oslo, Norway
b now at: Norwegian Environment Agency, Oslo, Norway

Correspondence: Armin Wisthaler (armin.wisthaler@kjemi.uio.no)

Received: 18 June 2020 – Discussion started: 21 July 2020
Revised: 17 December 2020 – Accepted: 7 January 2021 – Published: 22 February 2021

Abstract. Proton-transfer-reaction mass spectrometry (PTR-          that are currently in use. The fast time response can be used
MS) is widely used in atmospheric sciences for measuring            for rapid (∼ 1 min equilibration time) switching between gas
volatile organic compounds in real time. In the most widely         and particle measurements. The CHARON EVR PTR-MS
used type of PTR-MS instruments, air is directly introduced         instrument can thus be used for real-time monitoring of both
into a chemical ionization reactor via an inlet capillary sys-      gaseous and particulate organics in the atmosphere. Finally,
tem. The reactor has a volumetric exchange time of ∼ 0.1 s,         we show that the CHARON EVR PTR-MS instrument also
enabling PTR-MS analyzers to measure at a frequency of              rapidly detects highly oxygenated species (with up to eight
10 Hz. The time response does, however, deteriorate if low-         oxygen atoms) in particles formed by limonene ozonolysis.
volatility analytes interact with surfaces in the inlet or in the
instrument. Herein, we present the extended volatility range
(EVR) PTR-MS instrument which mitigates this issue. In the
EVR configuration, inlet capillaries are made of passivated
stainless steel, and all wetted metal parts in the chemical ion-    1   Introduction
ization reactor are surface-passivated with a functionalized
hydrogenated amorphous silicon coating. Heating the entire          The Earth’s atmosphere contains a plethora of organic com-
setup (up to 120 ◦ C) further improves the time-response per-       pounds, both in the gas and in the particulate phase (Gold-
formance.                                                           stein and Galbally, 2007). Atmospheric organic compounds
   We carried out time-response performance tests on a set          vary widely in their physicochemical properties (e.g., volatil-
of 29 analytes having saturation mass concentrations C 0 in         ity, polarity, solubility), which makes their comprehensive
the range between 10−3 and 105 µg m−3 . The 1/e-signal de-          measurement challenging (Heald and Kroll, 2020).
cay times after instant removal of the analyte from the sam-           Proton-transfer-reaction mass spectrometry (PTR-MS) is
pling flow were between 0.2 and 90 s for gaseous analytes.          widely used in atmospheric sciences for measuring volatile
We also tested the EVR PTR-MS instrument in combination             organic compounds (Hansel et al., 1995; de Gouw and
with the chemical analysis of aerosols online (CHARON)              Warneke, 2007; Yuan et al., 2017). In PTR-MS instru-
particle inlet, and 1/e-signal decay times were in the range        ments, air is directly introduced into an ion–molecule reac-
between 5 and 35 s for particulate analytes. We show on a set       tor wherein organic molecules ionize in collisions with hy-
of example compounds that the time-response performance             dronium (H3 O+ ) ions. An electric field is applied across the
of the EVR PTR-MS instrument is comparable to that of               ion–molecule reactor, which is thus commonly referred to as
the fastest flow tube chemical ionization mass spectrometers        the drift tube. Reagent and analyte ions are extracted from
                                                                    the drift tube and analyzed in a mass spectrometer.

Published by Copernicus Publications on behalf of the European Geosciences Union.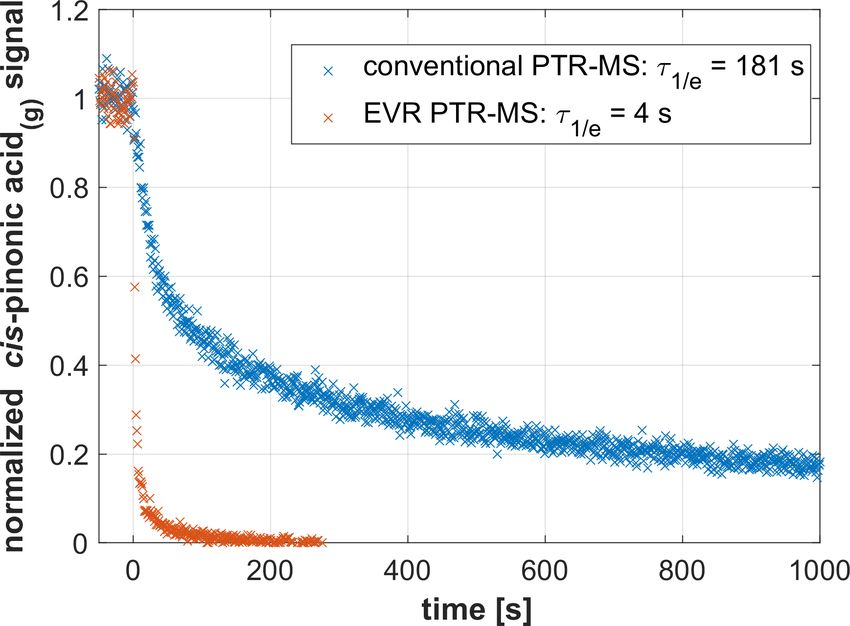
1356                                                                              F. Piel et al.: The EVR PTR-MS instrument

   One of the main advantages of PTR-MS is its rapidness.           genated amorphous silicon coating. The same surface pas-
The drift tube has a volumetric exchange time of ∼ 0.1 s,           sivation was applied to all wetted SS parts in the drift tube.
enabling PTR-MS analyzers to measure at a frequency of              In the CHARON inlet, the sampler and the vaporizer as well
10 Hz (Müller et al., 2010). The time response does, how-           as the transfer tube from the vaporizer to the drift tube were
ever, deteriorate if low-volatility analytes interact with sur-     surface-passivated. Figure 1 shows all surface-treated parts
faces in the inlet or in the instrument. PTR-MS instru-             in blue. As for conventional PTR-MS analyzers, the drift
ment users have mitigated this problem by (i) operating the         tube and inlet lines were housed in a temperature-controlled
drift tube at elevated temperatures (Mikoviny et al., 2010),        enclosure that can be operated from room temperature to
(ii) increasing the flow through the drift tube (Breitenlech-       120 ◦ C. The enclosure temperature is referred to as the drift
ner et al., 2017; Krechmer et al., 2018) and (iii) minimizing       tube temperature (Tdrift ).
the wall collisions of analyte molecules (Breitenlechner et
al., 2017). The problem of analyte adsorption becomes even          2.2   Performance assessment of the EVR PTR-MS
more pronounced when particles are analyzed with the chem-                instrument
ical analysis of aerosols online (CHARON) inlet (Eichler et
al., 2015; Müller et al., 2017). After particle vaporization,       A laboratory study was carried out to measure signal decay
low-volatility gases adsorb onto surfaces in the vaporizer, in      times in the EVR PTR-MS analyzer for 29 analytes listed in
the transfer line from the vaporizer to the drift tube and in the   the Supplement (Table S1). A single analyte was supplied in
drift tube itself. This slows down the instrumental response        steady concentration to the analyzer and instantly removed
significantly (Piel et al., 2019).                                  from the inlet. τ1/e is the time it took the analyte signal to
   A second major advantage of PTR-MS is that H3 O+ ion             decay to 1/e (36.8 %) of its initial value. τ90 is the time it
chemistry detects a wide spectrum of organic analytes, from         took the analyte signal to decay to 10 % of its initial value.
non-oxidized to highly oxidized species. It must, however,          A stable gaseous analyte concentration, which is herein de-
be ensured that the analyte molecules reach the ionization          noted with the subscript (g), was generated by placing a spat-
region and are not lost in the inlet line (e.g., Pagonis et         ula tip of the solid sample into a 100 mL glass vial. The vial
al., 2017; Deming et al., 2019) or onto the drift tube walls.       was heated and flushed with zero air (RH ∼ 30 %). Heating
   Herein we will demonstrate how the use of heated inlet           temperatures ranged from 50 to 120 ◦ C, depending upon the
capillaries made of passivated stainless steel (SS) and of a        melting point of the analyte. The dynamic headspace of the
heated drift tube with passivated metal surfaces significantly      vial was sampled through the gas inlet of the PTR-MS ana-
improves the time-response performance of PTR-MS analyz-            lyzer. The instrument and inlet were zeroed by overflowing
ers. We will show that the heated and passivated instrument         the inlet with zero air (Fig. S1 in the Supplement). A sta-
responds fast to low-volatility analytes, both for gas-phase        ble particulate analyte concentration, which is herein denoted
and particle-phase measurements. The instrument setup de-           with the subscript (p), was generated by dissolving an aliquot
scribed herein has thus been named the extended volatility          of the solid sample in HPLC-grade water (Sigma-Aldrich
range (EVR) configuration.                                          Chemie GmbH, Taufkirchen, Germany). The solution was
                                                                    then nebulized with a homebuilt nebulizer. The nebulizer
                                                                    outflow was dried with two homebuilt diffusion dryers, and
2     Experimental                                                  gases were removed with an activated charcoal denuder (No-
                                                                    vaCarb F, Mast Carbon International Ltd., Guildford, UK).
2.1    The EVR PTR-MS instrument                                    The CHARON inlet and PTR-MS instrument were zeroed
                                                                    by diverting the sample flow through a high-efficiency par-
The PTR-MS instrument has been described in detail else-            ticulate air (HEPA) filter (Fig. S1).
where (Yuan et al., 2017, and references therein). The data            Example data from a field study were taken to show the
presented herein were obtained with two state-of-the-art            signal response of the EVR PTR-MS analyzer when switch-
CHARON PTR-MS analyzers (models PTR-TOF 4000X2                      ing between the CHARON particle inlet and the gas inlet.
and PTR-TOF 6000X2) produced by IONICON Analytik                    The data were collected during a measurement campaign at
(Innsbruck, Austria). In their conventional setup, these ana-       the TROPOS Research Station Melpitz (Spindler et al., 2013)
lyzers include inlet capillaries made of polyether ether ke-        in Germany in February 2019.
tone (PEEK) and a drift tube plus ion funnel consisting                A laboratory study was carried out for investigating the
of electropolished SS drift rings and polytetrafluoroethylene       capability of the CHARON EVR PTR-MS analyzer to de-
(PTFE) spacers. PEEK and especially SS are known to ad-             tect highly oxidized organic molecules in particles. For this
sorb certain analytes. In an effort to optimize the instrumental    purpose, we reacted ozone and limonene in a flow reactor
time response, we have eliminated all surfaces that are prone       to form secondary organic aerosol (SOA). The reactor out-
to analyte adsorption (Fig. 1). All PEEK capillaries were re-       flow was passed through an activated charcoal denuder (No-
placed by surface-treated SS capillaries. The surface treat-        vaCarb F, Mast Carbon International Ltd., Guildford, UK)
ment consisted in an application of functionalized hydro-           for removing gaseous organics and subsequently injected

Atmos. Meas. Tech., 14, 1355–1363, 2021                                              https://doi.org/10.5194/amt-14-1355-2021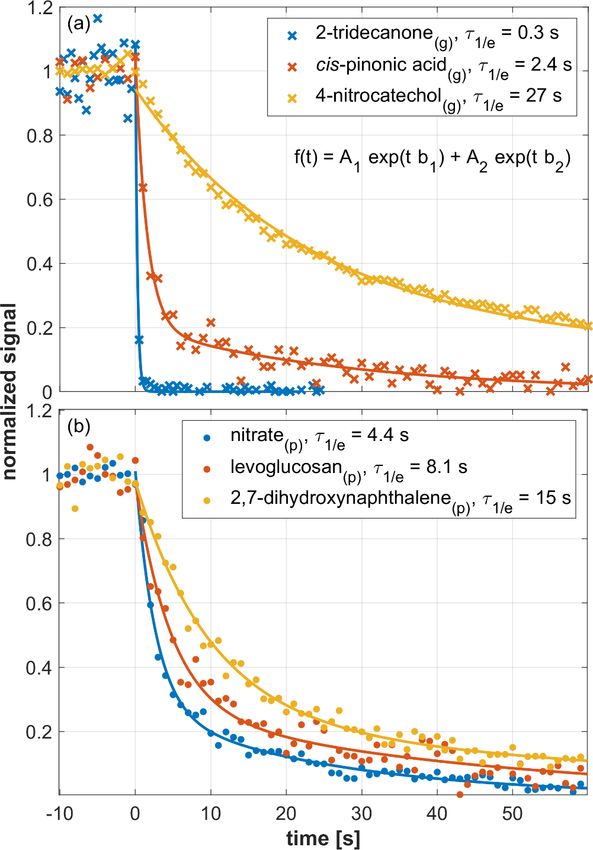
F. Piel et al.: The EVR PTR-MS instrument                                                                                             1357

Figure 1. Scheme of the EVR PTR-MS instrument including a gas inlet and the CHARON particle inlet. The parts in blue were passivated
with a functionalized hydrogenated amorphous silicon coating. MFC: mass flow controller; PC: pressure controller, ADL: aerodynamic lens;
ToF-MS: time-of-flight mass spectrometer.

into a 210 L steel barrel (Wilai GmbH, Wiedemar, Germany).
The CHARON EVR PTR-MS analyzer sampled from this
reservoir. The instrument was operated at low reduced elec-
tric field strength (E/N = 30 Td; 1 Td = 10−17 V cm−2 ) and
with NH+   4 as the reagent ion (Müller et al., 2020). With
these instrumental settings, ionic fragmentation is largely
suppressed, and highly oxidized organic molecules are de-
tected in their ammonium adduct form (Zaytsev et al., 2019).

3     Results and discussion

3.1    Effect of surface passivation on time response

Figure 2 shows data from two experiments wherein the sig-
nal decay of cis-pinonic acid(g) was measured with the same           Figure 2. Signal decay as observed in a conventional PTR-MS in-
PTR-MS instrument before and after being modified to the              strument (Tdrift = 100 ◦ C; in blue) and in an EVR PTR-MS ana-
EVR configuration. Tdrift was set to 100 ◦ C in both experi-          lyzer (Tdrift = 100 ◦ C; in red) after a steady supply of gaseous cis-
ments; all other experimental parameters were kept identi-            pinonic acid was instantly switched off at t = 0 s.
cal. In the conventional configuration, the analyte signal ex-
hibited a long tailing while it rapidly dropped to near-zero
levels in the EVR configuration. τ1/e was 181 s for the con-
ventional setup and 4 s in the EVR configuration. These data          volumetric exchange time of the drift tube (∼ 0.1 s). The
clearly demonstrate that surface passivation greatly improves         three example compounds shown here cover the full 3 or-
the time response of PTR-MS analyzers.                                ders of magnitude span in τ1/e (10−1 to 102 s) that was ob-
   Figure 3 shows the response of the EVR PTR-MS ana-                 served for gaseous analytes. For particulate analytes, τ1/e
lyzer (Tdrift = 120 ◦ C) to an example set of analytes, mea-          ranged from a few seconds to a few tens of seconds. The
sured via the gas inlet (upper panel) and via the CHARON              lower panel of Fig. 3 shows example data obtained for
particle inlet (lower panel). 4-Nitrocatechol(g) (in dark yel-        2,7-dihydroxynaphthalene(p) (in dark yellow; τ1/e = 15 s),
low) exhibited a rather slow decay (τ1/e = 27 s). cis-Pinonic         levoglucosan(p) (in red; τ1/e = 8.1 s) and nitrate(p) (in blue;
acid(g) (in red) decayed in a few seconds (τ1/e = 2.4 s). For         τ1/e = 4.4 s). The nitrate(p) signal originated from ammo-
2-tridecanone (in blue), τ1/e was 0.3 s, which is close to the        nium nitrate particles.

https://doi.org/10.5194/amt-14-1355-2021                                                 Atmos. Meas. Tech., 14, 1355–1363, 2021
1358 F. Piel et al.: The EVR PTR-MS instrument
row range. We will thus not discuss any concentration depen-
dence of τ1/e here. We observed an increase in τ1/e with de-
creasing saturation mass concentrations (log C 0 ) as a general
trend, although with significant deviations for some com-
pounds (Fig. S2). Glucose(g) , for example, exhibited a much
faster response than the sugar alcohols (xylitol(g) , arabitol(g) )
despite having a similar log C 0 . Structural effects may play
a role here, since glucose is a cyclic molecule, while the
sugar alcohols are both linear. It is also important to note
that the SIMPOL.1 method has not been validated for sac-
charides and that the calculated log C 0 may be inaccurate.
4-Nitrocatechol, with a relatively high log C 0 of 4.2, was
among the slowest responding gaseous analytes. This obser-
vation remains unexplained. With the CHARON inlet con-
nected, τ1/e was in the 5 to 20 s range for most analytes
(Fig. 4, lower panel). Exceptions were diglycolic acid(p) and
tartaric acid(p) with τ1/e up to ∼ 35 s. Notably, no obvious
dependence of τ1/e on log C 0 was observed. Levoglucosan,
2,7-dihydroxynaphthalene, stearic acid, azelaic acid, digly-
colic acid and vanillic acid were studied in both phases. The
instrumental response was typically ∼ 5 s slower in the par-
ticle measurements. The CHARON inlet has a larger surface
area and a lower sample flow than the gas inlet. Stearic acid
and azelaic acid responded faster with the CHARON inlet,
which remains unexplained. The reader is cautioned that the
τ1/e values presented in Fig. 4 should not be taken as abso-
lute and generally applicable values. The reported numbers
should be seen as indicative figures for the time response
of state-of-the-art IONICON EVR PTR-MS instruments. It
Figure 3. Signal decay as observed in an EVR PTR-MS an-
alyzer (Tdrift = 120 ◦ C) after a steady supply of analyte was
is well known that analytes compete for surface adsorption
instantly switched off at t = 0 s. The decay of gaseous an- with other matrix constituents such as water or other surface-
alytes is shown in the upper panel, while the lower panel affine compounds. All of our experiments were carried out
refers to particulate analytes. Initial steady-state mixing ra- with a single compound at one humidity level. We consider
tios were as follows: 2-tridecanone(g) , 1 ppbv; cis-pinonic it beyond the scope of this work to investigate a matrix de-
acid(g) , 2.2 ppbv; 4-nitrocatechol(g) , 30 ppbv; nitrate, 3 ppbv; pendence of τ1/e . Especially for low-volatility analytes, re-
levoglucosan(p) , 1.2 ppbv; 2,7-dihydroxynaphthalene(p) , 0.3 ppbv. peated sampling may passivate remaining active sites, which
Signals were fitted using a double exponential decay function (see in turn improves the time response. This effect probably ex-
insert in a). All fitting parameters are listed in Table S2. plains the relatively large variations in τ1/e observed for the
slow-responding analytes, even if all three experiments were
carried out at similar mixing ratios. In previous work, we
Figure 4 summarizes the τ1/e values measured for 21 anecdotally observed that basic analytes exhibited a signif-
gaseous analytes (upper panel) and 15 particulate analytes icantly slower time response when acidic samples had been
(lower panel). The color coding and sizing are explained sampled before. The sampling history was not considered in
in the figure legend. Mixing ratios were quantified ac- our study.
cording to the procedure outlined in the Supplement of
Müller et al. (2017) and were typically in the 0.1–10 ppbv 3.2 Drift tube temperature effects
range. For some compounds (vanillin(g) , 2-tridecanone(g) ,
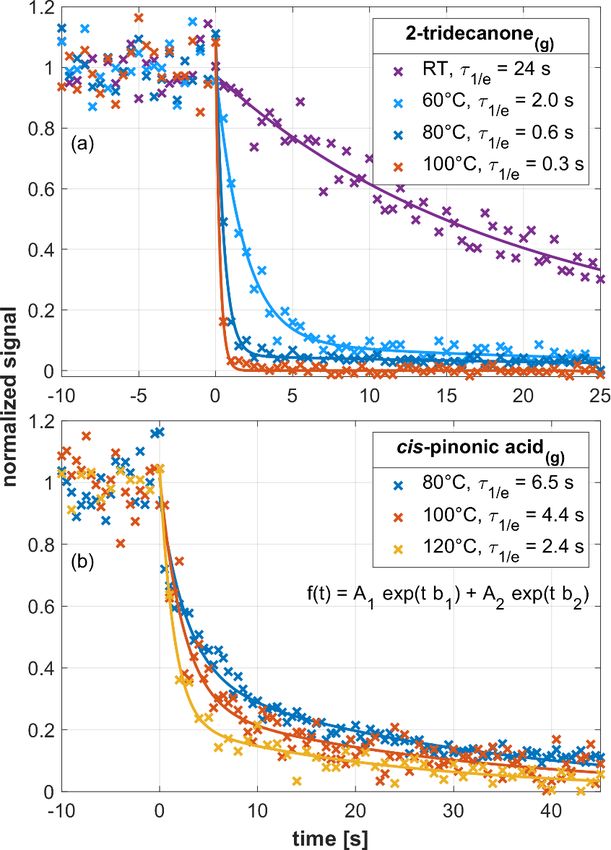
2,6-dimethoxyphenol(g) , 4-nitroguaiacol(g) , ammonia(g) ) it For long-chain ketones (Pagonis et al., 2017; Krechmer et
was difficult to generate mixing ratios in the low-ppbv range, al., 2018) and carboxylic acids (Fig. S2), τ1/e exhibits the ex-
which is why we also included mixing ratios up to 100 ppbv pected increase with decreasing log C 0 . Since log C 0 depends
in our analysis. We typically measured τ1/e at three differ- upon temperature, changes in Tdrift should lead to predictable
ent mixing ratios for each compound. Three data points are changes in τ1/e . We thus measured τ1/e for 2-tridecanone(g)
thus typically shown for each analyte. Only small changes and cis-pinonic acid(g) at variable Tdrift (Fig. 5). In the case
in the instrumental time response were observed because an- of 2-tridecanone(g) (upper panel), an increase in Tdrift from
alyte concentrations typically only spanned a relatively nar- room temperature to 60 ◦ C decreased τ1/e from 24 to 2 s. At
Atmos. Meas. Tech., 14, 1355–1363, 2021 https://doi.org/10.5194/amt-14-1355-2021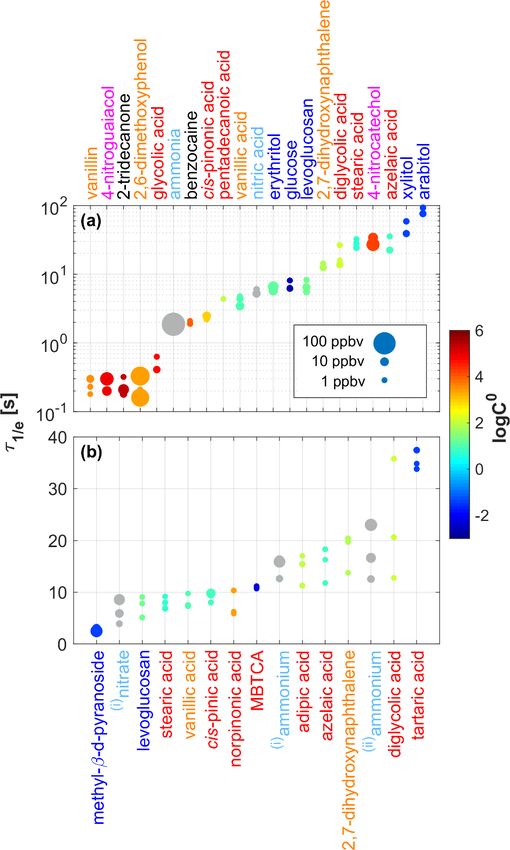
F. Piel et al.: The EVR PTR-MS instrument                                                                                                 1359

                                                                         Figure 5. Signal decay as observed in an EVR PTR-MS analyzer for
                                                                         2-tridecanone(g) (a) and cis-pinonic acid(g) (b), respectively, at dif-
                                                                         ferent drift tube temperatures. Initial steady-state mixing ratios were
                                                                         as follows: 2-tridecanone(g) , 1–1.3 ppbv; cis-pinonic acid, 2.2 ppbv.
                                                                         Signals were fitted using a double exponential decay function (see
                                                                         insert in b). All fitting parameters are listed in Table S3.
Figure 4. Signal decay times (τ1/e ) measured for 21 gaseous an-
alytes (a) and 15 particulate analytes (b). Analytes were grouped
and color-coded into six classes: saccharides (in dark blue), car-
boxylic acids (in red), substituted phenols (in orange), nitroaromat-
ics (in magenta), small polar molecules (in light blue) and others (in
black). The size of the dots indicates the initial steady-state mixing   al. (2010), a 15 ◦ C temperature rise increases log C 0 by ∼ 1
ratio (0.1–100 ppbv) used in the respective experiment. The color        in the 0 to 50 ◦ C temperature range. The effect becomes less
code of the data points indicates the saturation mass concentrations     pronounced at higher temperatures. For cis-pinonic acid, the
(log C 0 ) of the analytes as calculated using the SIMPOL.1 method       SIMPOL.1 method yields a log C 0 increase from 5.2 to 6.2 in
(Pankow and Asher, 2008). (i) Originating from ammonium nitrate;         the 80 to 120 ◦ C temperature range. At 45 ◦ C, 2-tridecanone
(ii) originating from ammonium sulfate.                                  has roughly the same log C 0 as cis-pinonic acid at 120 ◦ C
                                                                         (Fig. S3). Consistently, we observed a similar time response
                                                                         for the two compounds at Tdrift = 45 ◦ C and Tdrift = 120 ◦ C,
Tdrift = 100 ◦ C, τ1/e was 0.3 s, approaching the volumetric             respectively. We conclude that increasing Tdrift to 120 ◦ C is
exchange time of the drift tube. In the case of cis-pinonic              an effective way for reducing τ1/e in EVR PTR-MS analyz-
acid(g) (lower panel), we only investigated temperatures of              ers.
80 ◦ C and above because the solid analyte sample was kept                  Exposing the sample gas to heated surfaces in an analyzer
at 70 ◦ C. When increasing Tdrift from 80 to 120 ◦ C, τ1/e               may thermally degrade some analytes. It is important to note
dropped from 6.5 to 2.4 s. For the two compounds inves-                  that none of the acids studied in this work decarboxylated at
tigated, the decrease in τ1/e can be explained by the in-                Tdrift = 120 ◦ C. It may, however, be necessary to use a lower
crease in log C 0 with temperature. According to Epstein et              Tdrift when more thermally labile analytes are targeted.

https://doi.org/10.5194/amt-14-1355-2021                                                     Atmos. Meas. Tech., 14, 1355–1363, 2021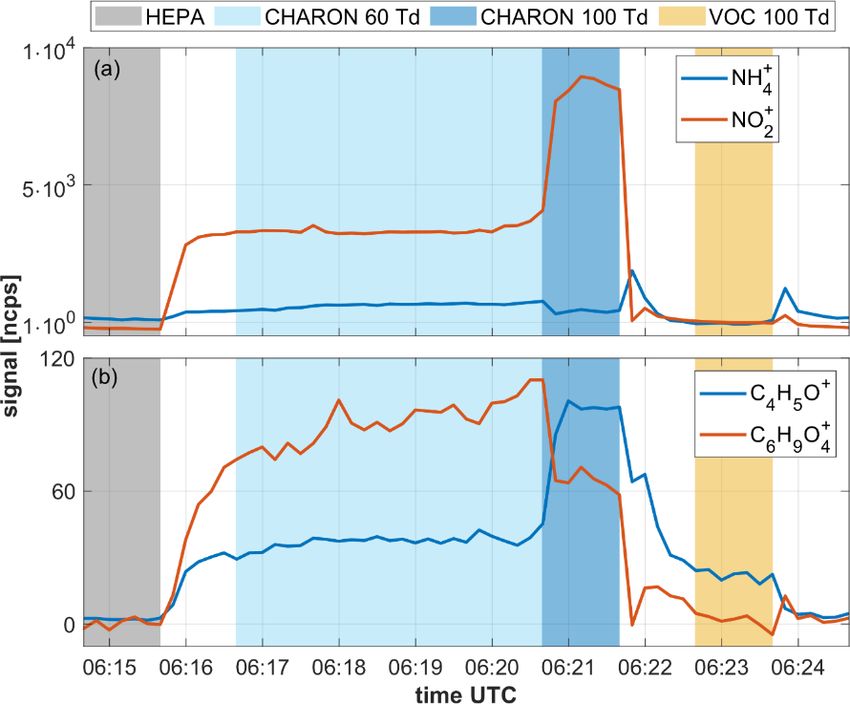
1360 F. Piel et al.: The EVR PTR-MS instrument
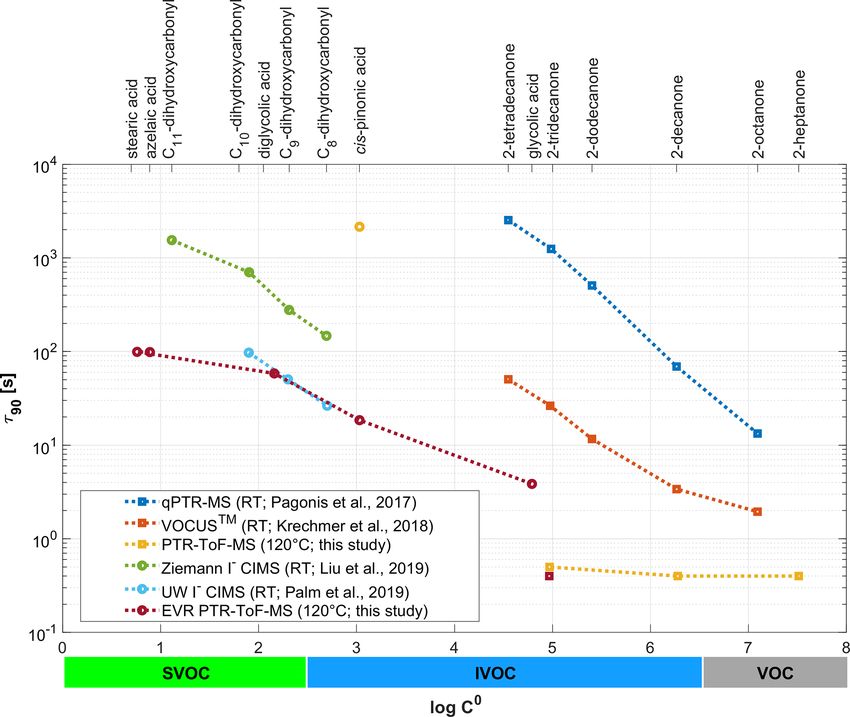
Figure 6. Signal decay times (here reported as τ90 ) as observed in different online chemical ionization mass spectrometry (CIMS) instru-
ments for a set of ketones, carboxylic acids and dihydroxycarbonyls. τ90 is plotted as a function of the SIMPOL.1-derived saturation mass
concentration (log C 0 ). Note that the figure legend shows the different operating temperatures of the instruments used (RT: room tempera-
ture).
3.3 Response times of different online CIMS organic compounds (IVOCs) and semi-volatile organic com-
instruments pounds (SVOCs). Since the instruments did not measure the
same SVOCs, we only use our carboxylic acid data for the
log C 0 -based comparison. For the acids, log C 0 appears to be
Figure 6 compares the signal decay times (here reported as
the main determinant of τ90 , whereas for the saccharides and
τ90 and not as τ1/e ) as observed in different online chemi-
substituted phenols other properties affect τ90 (Fig. S2). For
cal ionization mass spectrometry (CIMS) instruments. The
VOCs and the more volatile IVOCs (log C 0 ≥ 5), τ90 is close
plot includes data from this study, which were obtained with
to the volumetric exchange time of the drift tube for both
two state-of-the-art IONICON PTR-MS analyzers. The data
the EVR and the conventional PTR-ToF-MS instrument, if
points in yellow were obtained with a conventional instru-
the drift tube and inlet are heated to 120 ◦ C. Conventional
ment, while the data points in dark red were collected with
unheated PTR-MS instruments have a much slower time re-
an EVR-type analyzer. Both instruments were operated at
sponse. For the less volatile IVOCs (log C 0 ≤ 3; cis-pinonic
Tdrift = 120 ◦ C. The figure also includes literature data ob-
acid) surface passivation reduces τ90 by 2 orders of magni-
tained with an old quadrupole PTR-MS instrument (qPTR-
tude, even if the drift tube is heated to 120 ◦ C in both the
MS; in blue: Pagonis et al., 2017), with a PTR-ToF-MS an-
conventional and the EVR PTR-ToF-MS analyzer. For the
alyzer from a different manufacturer (VOCUS™; in orange:
SVOCs, the heated EVR PTR-ToF-MS has a similar time re-
Krechmer et al., 2018) and with two iodide (I− ) CIMS in-
sponse as an optimized I− CIMS instrument with reduced
struments (in green: Liu et al., 2019; in light blue: Palm
instrument wall interactions (Palm et al., 2019).
et al., 2019). The latter four instruments were all operated
at room temperature (RT). τ90 is plotted against log C 0 of
the respective analyte, which was calculated using the SIM- 3.4 Rapid switching between the gas inlet and the
POL.1 method (Pankow and Asher, 2008). The upper hori- CHARON particle inlet
zontal axis lists the compound names; the lower horizontal
axis shows in which log C 0 range molecules are classified as For certain applications, it is desirable to periodically switch
volatile organic compounds (VOCs), intermediate-volatility between gas and particle measurements. Figure 7 shows ex-
Atmos. Meas. Tech., 14, 1355–1363, 2021 https://doi.org/10.5194/amt-14-1355-2021F. Piel et al.: The EVR PTR-MS instrument 1361
Figure 8. Decay of the NH+ 4 (C19 H30 O8 ) signal as recorded by a
Figure 7. Time series showing various analyte signals as recorded CHARON EVR PTR-MS analyzer when O3 /limonene SOA was
during a 10 min measurement cycle of ambient air. The 10 min sampled and the instrument was switched from the CHARON par-
measurement cycle included (i) 1 min of instrumental background ticle inlet to the gas inlet at t = 0.
measurements with the CHARON inlet including a HEPA fil-
ter, (ii) 4 min of particulate measurements at an E/N of 60 Td,
(iii) 1 min of particulate measurements at an E/N of 100 Td and ionic fragment from levoglucosan (Leglise et al., 2019).
(iv) 1 min of gas measurements at an E/N of 100 Td. The benefit C4 H5 O+ is believed to be a fragment of larger furanoid com-
of measuring particles at 60 and 100 Td is explained in Leglise et pounds in particles and protonated furan in the gas measure-
al. (2019) and is not discussed here. The CHARON inlet enriched ment. The instrumental response to these analytes was some-
the particle concentration by a factor of ∼ 20, which explains the
what slower than to ammonium nitrate but equilibration still
higher signal intensities in the particle measurement (in blue) as
compared to the gas measurement (in yellow).
occurred within 1 min. The instrumental response to levoglu-
cosan is similar to what we observed in single compound
measurements in the laboratory, suggesting that the presence
of a complex matrix does not negatively affect instrumental
ample data collected by a CHARON EVR PTR-MS instru- response times.
ment during ambient air measurements at a rural background
station in Germany. 3.5 Detection of highly oxidized organic compounds
The reader should focus on the transition from back-
ground to ambient particle measurements at 06:15:40 UTC The CHARON PTR-MS instrument has been successfully
and the transition from particle to gas measurements at used for measuring the chemical composition of SOA (e.g.,
06:21:40 UTC, which is when the slow signal response be- Gkatzelis et al., 2018). The detection of highly oxidized
comes most evident. The upper panel shows the time evo- species has, however, been hampered by the adsorption of
lution of the NH+ +
4 (m/z 18.034) and NO2 (m/z 45.996) low-volatility species onto instrumental surfaces. In an at-
signals. In the CHARON inlet, ammonium nitrate particles tempt to demonstrate the improved detection capability of
evaporate to yield gaseous ammonia (NH3 ) and nitric acid the CHARON EVR PTR-MS instrument, we sampled SOA
(HNO3 ). Ammonia is detected in its protonated form, while generated from limonene ozonolysis. Up to eight oxygen
nitric acid dehydrates upon protonation to yield the nitron- atoms were detected in the analyte ions (Fig. S4). Figure 8
ium ion (NO+ 2 ). Both ammonia and nitric acid are particu- shows the rapid decay (τ1/e = 15 s) of an O8 compound
larly prone to adsorptive losses on stainless steel (Neuman (C19 H30 O8 , detected as ammonium adduct) when switch-
et al., 1999; Nowak et al., 2007). In the EVR-type instru- ing from the CHARON particle inlet to the gas inlet. The
ment, wetted surfaces do not include any untreated stain- rapidness of the decay suggests that surface adsorption ef-
less steel, which results in a fast instrumental response to fects play a minor role even for such highly oxidized species.
both compounds. Both the NH+ +
4 and the NO2 signal equi- Hammes et al. (2019) claimed that the C19 H30 O8 molecule
librated within 1 min when switching from HEPA to ambient formed from limonene ozonolysis is a multifunctional com-
CHARON measurements and from particle to gas measure- pound containing three keto groups, one carboxyl group, one
ments, respectively. The lower panel shows the evolution of hydroperoxy group and one ester group. A calculation us-
the C4 H5 O+ (m/z 69.033) and C6 H9 O+ 4 (m/z 145.049) sig- ing SIMPOL.1 (Pankow and Asher, 2008) yields a log C 0 of
nals within one measurement cycle. C6 H9 O+ 4 is the main −5.9 for this molecule, suggesting that even extremely low
https://doi.org/10.5194/amt-14-1355-2021 Atmos. Meas. Tech., 14, 1355–1363, 20211362 F. Piel et al.: The EVR PTR-MS instrument
volatility organic compounds (ELVOCs) can be monitored configuration) and the CHARON particle inlet. Markus Müller and
in real time by CHARON EVR PTR-MS. The fact that the Armin Wisthaler profit from a license agreement (CHARON inlet)
detected C19 H30 O8 molecule contains a hydroperoxy group between the University of Innsbruck and IONICON Analytik.
is notable, because hydroperoxides are known to efficiently
decompose on metal surfaces in conventional PTR-MS in-
struments (Rivera-Rios et al., 2014). An additional benefit of Acknowledgements. We would like to thank Laurent Poulain and
surface passivation may thus be that the metal-catalyzed de- Gerald Spindler from TROPOS for their support during the mea-
surements in Melpitz. Special thanks go to Magda Claeys for pro-
composition of peroxides and hydroperoxides is suppressed.
viding many of the substances studied in this work.
Preliminary laboratory tests with cumene hydroperoxide and
dicumylperoxide (i.e., the only peroxides that are commer-
cially available, although with significant impurities) indicate Financial support. Felix Piel has been supported by the Horizon
that these compounds do indeed not decompose in EVR-type 2020 Framework Programme (H2020) Marie Skłodowska-Curie
instruments. More work is needed to confirm this preliminary Actions (IMPACT (grant no. 674911)). Jenny Skytte af Sätra has re-
finding. ceived support from the Erasmus+ program of the European Union.
Measurements in Melpitz have been supported by the European
Union’s Horizon 2020 research and innovation program (ACTRIS-
4 Conclusion 2 (grant no. 654109)).
We have described and characterized the novel EVR PTR-
MS instrument, which exhibits a significantly improved Review statement. This paper was edited by Andreas Hofzumahaus
time-response performance as compared to conventional and reviewed by two anonymous referees.
IONICON PTR-MS analyzers. The time response of this op-
timized instrument is comparable to that of the fastest flow
tube CIMS instruments that are currently in use. This allows
us to rapidly switch between gas and particle measurements, References
making the CHARON EVR PTR-MS instrument the only di-
Breitenlechner, M., Fischer, L., Hainer, M., Heinritzi, M., Curtius,
rect sample introduction CIMS instrument that can monitor J., and Hansel, A.: PTR3: An Instrument for Studying the Lifecy-
gaseous and particulate organics in the atmosphere in real cle of Reactive Organic Carbon in the Atmosphere, Anal. Chem.,
time. Besides being faster, the EVR PTR-MS instrument also 89, 5824–5831, https://doi.org/10.1021/acs.analchem.6b05110,
allows us to target new analyte classes such as highly oxy- 2017.
genated organic molecules and potentially also hydroperox- de Gouw, J. and Warneke, C.: Measurements of volatile organic
ides. We believe that the CHARON EVR PTR-MS instru- compounds in the earth’s atmosphere using proton-transfer-
ment will be a valuable tool for overcoming current chal- reaction mass spectrometry, Mass Spectrom. Rev., 26, 223–257,
lenges in the measurement of atmospheric organic carbon https://doi.org/10.1002/mas.20119, 2007.
(Heald and Kroll, 2020). Deming, B. L., Pagonis, D., Liu, X., Day, D. A., Talukdar, R.,
Krechmer, J. E., de Gouw, J. A., Jimenez, J. L., and Ziemann,
P. J.: Measurements of delays of gas-phase compounds in a
wide variety of tubing materials due to gas–wall interactions, At-
Data availability. The data used in this paper are available from the
mos. Meas. Tech., 12, 3453–3461, https://doi.org/10.5194/amt-
corresponding author upon request.
12-3453-2019, 2019.
Eichler, P., Müller, M., D’Anna, B., and Wisthaler, A.: A novel
inlet system for online chemical analysis of semi-volatile sub-
Supplement. The supplement related to this article is available on- micron particulate matter, Atmos. Meas. Tech., 8, 1353–1360,
line at: https://doi.org/10.5194/amt-14-1355-2021-supplement. https://doi.org/10.5194/amt-8-1353-2015, 2015.
Epstein, S. A., Riipinen, I., and Donahue, N. M.: A Semiempiri-
cal Correlation between Enthalpy of Vaporization and Saturation
Author contributions. KW developed the EVR system and per- Concentration for Organic Aerosol, Environ. Sci. Technol., 44,
formed initial tests. MM, FP and AW designed the experimental 743–748, https://doi.org/10.1021/es902497z, 2010.
studies. MM, FP and JSaS carried out the experiments. FP per- Gkatzelis, G. I., Tillmann, R., Hohaus, T., Müller, M., Eichler,
formed the data analysis, with support from JSaS and MM. FP and P., Xu, K.-M., Schlag, P., Schmitt, S. H., Wegener, R., Kamin-
MM drafted the manuscript. AW wrote the final manuscript. All au- ski, M., Holzinger, R., Wisthaler, A., and Kiendler-Scharr, A.:
thors commented and accepted the final version of the manuscript. Comparison of three aerosol chemical characterization tech-
niques utilizing PTR-ToF-MS: a study on freshly formed and
aged biogenic SOA, Atmos. Meas. Tech., 11, 1481–1500,
Competing interests. Markus Müller, Felix Piel and Klaus Winkler https://doi.org/10.5194/amt-11-1481-2018, 2018.
work for IONICON Analytik. IONICON Analytik commercializes Goldstein, A. H. and Galbally, I. E.: Known and Unexplored Or-
PTR-MS instruments (both in the conventional and in the EVR ganic Constituents in the Earth’s Atmosphere, Environ. Sci.
Atmos. Meas. Tech., 14, 1355–1363, 2021 https://doi.org/10.5194/amt-14-1355-2021F. Piel et al.: The EVR PTR-MS instrument 1363 Technol., 41, 1514–1521, https://doi.org/10.1021/es072476p, Neuman, J. A., Huey, L. G., Ryerson, T. B., and Fa- 2007. hey, D. W.: Study of Inlet Materials for Sampling Atmo- Hammes, J., Lutz, A., Mentel, T., Faxon, C., and Hallquist, spheric Nitric Acid, Environ. Sci. Technol., 33, 1133–1136, M.: Carboxylic acids from limonene oxidation by ozone and https://doi.org/10.1021/es980767f, 1999. hydroxyl radicals: insights into mechanisms derived using Nowak, J. B., Neuman, J. A., Kozai, K., Huey, L. G., Tanner, D. J., a FIGAERO-CIMS, Atmos. Chem. Phys., 19, 13037–13052, Holloway, J. S., Ryerson, T. B., Frost, G. J., McKeen, S. A., and https://doi.org/10.5194/acp-19-13037-2019, 2019. Fehsenfeld, F. C.: A chemical ionization mass spectrometry tech- Hansel, A., Jordan, A., Holzinger, R., Prazeller, P., Vogel, W., nique for airborne measurements of ammonia, J. Geophys. Res., and Lindinger, W.: Proton transfer reaction mass spectrome- 112, D10S02, https://doi.org/10.1029/2006JD007589, 2007. try: on-line trace gas analysis at the ppb level, Int. J. Mass. Pagonis, D., Krechmer, J. E., de Gouw, J., Jimenez, J. L., and Spectrom., 149–150, 609–619, https://doi.org/10.1016/0168- Ziemann, P. J.: Effects of gas–wall partitioning in Teflon tub- 1176(95)04294-U, 1995. ing and instrumentation on time-resolved measurements of gas- Heald, C. L. and Kroll, J. H.: The fuel of atmospheric chemistry: phase organic compounds, Atmos. Meas. Tech., 10, 4687–4696, Toward a complete description of reactive organic carbon, Sci. https://doi.org/10.5194/amt-10-4687-2017, 2017. Adv., 6, eaay8967, https://doi.org/10.1126/sciadv.aay8967 2020. Palm, B. B., Liu, X., Jimenez, J. L., and Thornton, J. A.: Perfor- Krechmer, J., Lopez-Hilfiker, F., Koss, A., Hutterli, M., Stoer- mance of a new coaxial ion–molecule reaction region for low- mer, C., Deming, B., Kimmel, J., Warneke, C., Holzinger, pressure chemical ionization mass spectrometry with reduced in- R., Jayne, J., Worsnop, D., Fuhrer, K., Gonin, M., and de strument wall interactions, Atmos. Meas. Tech., 12, 5829–5844, Gouw, J.: Evaluation of a New Reagent-Ion Source and https://doi.org/10.5194/amt-12-5829-2019, 2019. Focusing Ion–Molecule Reactor for Use in Proton-Transfer- Pankow, J. F. and Asher, W. E.: SIMPOL.1: a simple group con- Reaction Mass Spectrometry, Anal. Chem., 90, 12011–12018, tribution method for predicting vapor pressures and enthalpies https://doi.org/10.1021/acs.analchem.8b02641, 2018. of vaporization of multifunctional organic compounds, Atmos. Leglise, J., Müller, M., Piel, F., Otto, T., and Wisthaler, Chem. Phys., 8, 2773–2796, https://doi.org/10.5194/acp-8-2773- A.: Bulk organic aerosol analysis by PTR-MS: an im- 2008, 2008. proved methodology for the determination of total or- Piel, F., Müller, M., Mikoviny, T., Pusede, S. E., and Wisthaler, A.: ganic mass, O : C and H : C elemental ratios and the av- Airborne measurements of particulate organic matter by proton- erage molecular formula, Anal. Chem., 91, 12619–12624, transfer-reaction mass spectrometry (PTR-MS): a pilot study, At- https://doi.org/10.1021/acs.analchem.9b02949, 2019. mos. Meas. Tech., 12, 5947–5958, https://doi.org/10.5194/amt- Liu, X., Deming, B., Pagonis, D., Day, D. A., Palm, B. B., Talukdar, 12-5947-2019, 2019. R., Roberts, J. M., Veres, P. R., Krechmer, J. E., Thornton, J. A., Rivera-Rios, J. C., Nguyen, T. B., Crounse, J. D., Jud, W., St. Clair, de Gouw, J. A., Ziemann, P. J., and Jimenez, J. L.: Effects of gas– J. M., Mikoviny, T., Gilman, J. B., Lerner, B. M., Kaiser, J. wall interactions on measurements of semivolatile compounds B., Gouw, J., Wisthaler, A., Hansel, A., Wennberg, P. O., Sein- and small polar molecules, Atmos. Meas. Tech., 12, 3137–3149, feld, J. H., and Keutsch, F. N.: Conversion of hydroperoxides https://doi.org/10.5194/amt-12-3137-2019, 2019. to carbonyls in field and laboratory instrumentation: Observa- Mikoviny, T., Kaser, L., and Wisthaler, A.: Development and char- tional bias in diagnosing pristine versus anthropogenically con- acterization of a High-Temperature Proton-Transfer-Reaction trolled atmospheric chemistry, Geophys. Res. Lett., 41, 8645– Mass Spectrometer (HT-PTR-MS), Atmos. Meas. Tech., 3, 537– 8651, https://doi.org/10.1002/2014GL061919, 2014. 544, https://doi.org/10.5194/amt-3-537-2010, 2010. Spindler, G., Grüner, A., Müller, K., Schlimper, S., and Herrmann, Müller, M., Graus, M., Ruuskanen, T. M., Schnitzhofer, R., Bam- H.: Long-term size-segregated particle (PM10 , PM2.5 , PM1 ) berger, I., Kaser, L., Titzmann, T., Hörtnagl, L., Wohlfahrt, characterization study at Melpitz – influence of air mass inflow, G., Karl, T., and Hansel, A.: First eddy covariance flux mea- weather conditions and season, J. Atmos. Chem., 70, 165–195, surements by PTR-TOF, Atmos. Meas. Tech., 3, 387–395, https://doi.org/10.1007/s10874-013-9263-8, 2013. https://doi.org/10.5194/amt-3-387-2010, 2010. Yuan, B., Koss, A. R., Warneke, C., Coggon, M., Sekimoto, K., and Müller, M., Eichler, P., D’Anna, B., Tan, W., and Wisthaler, de Gouw, J. A.: Proton-Transfer-Reaction Mass Spectrometry: A.: Direct Sampling and Analysis of Atmospheric Par- Applications in Atmospheric Sciences, Chem. Rev., 117, 13187– ticulate Organic Matter by Proton-Transfer-Reaction 13229, https://doi.org/10.1021/acs.chemrev.7b00325, 2017. Mass Spectrometry, Anal. Chem., 89, 10889–10897, Zaytsev, A., Breitenlechner, M., Koss, A. R., Lim, C. Y., Rowe, https://doi.org/10.1021/acs.analchem.7b02582, 2017. J. C., Kroll, J. H., and Keutsch, F. N.: Using collision- Müller, M., Piel, F., Gutmann, R., Sulzer, P., Hartungen, E., and induced dissociation to constrain sensitivity of ammonia chem- Wisthaler, A.: A novel method for producing NH4+ reagent ical ionization mass spectrometry (NH+ 4 CIMS) to oxygenated ions in the hollow cathode glow discharge ion source of volatile organic compounds, Atmos. Meas. Tech., 12, 1861– PTR-MS instruments, Int. J. Mass. Spectrom., 447, 116254, 1870, https://doi.org/10.5194/amt-12-1861-2019, 2019. https://doi.org/10.1016/j.ijms.2019.116254, 2020. https://doi.org/10.5194/amt-14-1355-2021 Atmos. Meas. Tech., 14, 1355–1363, 2021
You can also read