A combined convolutional and recurrent neural network for enhanced glaucoma detection - Nature
←
→
Page content transcription
If your browser does not render page correctly, please read the page content below
www.nature.com/scientificreports
OPEN A combined convolutional
and recurrent neural network
for enhanced glaucoma detection
Soheila Gheisari1*, Sahar Shariflou1, Jack Phu2,5, Paul J. Kennedy3, Ashish Agar4,
Michael Kalloniatis2,5 & S. Mojtaba Golzan1
Glaucoma, a leading cause of blindness, is a multifaceted disease with several patho-physiological
features manifesting in single fundus images (e.g., optic nerve cupping) as well as fundus videos
(e.g., vascular pulsatility index). Current convolutional neural networks (CNNs) developed to detect
glaucoma are all based on spatial features embedded in an image. We developed a combined CNN and
recurrent neural network (RNN) that not only extracts the spatial features in a fundus image but also
the temporal features embedded in a fundus video (i.e., sequential images). A total of 1810 fundus
images and 295 fundus videos were used to train a CNN and a combined CNN and Long Short-Term
Memory RNN. The combined CNN/RNN model reached an average F-measure of 96.2% in separating
glaucoma from healthy eyes. In contrast, the base CNN model reached an average F-measure of only
79.2%. This proof-of-concept study demonstrates that extracting spatial and temporal features from
fundus videos using a combined CNN and RNN, can markedly enhance the accuracy of glaucoma
detection.
Glaucoma is a chronic disease associated with age. It is described as an ocular disorder that encompasses a group
of progressive optic neuropathies with established pathophysiological changes at the optic nerve head (ONH)1.
The glaucoma continuum describes the optic neuropathy associated with progressive glaucomatous damage as
RGC loss during the initial and asymptomatic stages of the disease followed by detectable retinal nerve fibre layer
(RNFL) thinning and ultimately visual field (VF) defects2. Previous studies have shown that, in untreated patients,
due to missed diagnosis, the risk of progressing from ocular hypertension to unilateral vision loss (i.e., legal
blindness) is 1.5% to 10.5%3. Accordingly, early diagnosis is vital to prevent disease progression and vision loss.
Fundus photographs provide a 30-degree image of the ONH and an opportunity to quantify a number of
glaucoma specific morphological features4, including neuroretinal rim loss, and an increased cup-to-disc ratio5.
Despite the computer-aided approach for objective assessment of these features, there is well known inter- and
intra- observer variation in analysing images obtained from the O NH6. Another major limitation of single
fundus imaging is that it does not reveal markers associated with blood flow dysregulation, a well-established
phenomenon in glaucoma7. To overcome this limitation, a number of recent studies have focused on analysing
fundus videos (i.e. image sequences) in search of markers associated with blood flow. Through analysing fun-
dus videos, temporal features such as alteration in the amplitude of spontaneous venous pulsations (SVP)8 and
blood column v ariations9 can be obtained, both of which have been linked to g laucoma10–12. Taken together, it
is imperative to incorporate both spatial and temporal features for any approach aimed at glaucoma assessment.
Computer aided diagnosis (CAD) systems play an important role in making an accurate, reliable and fast
diagnosis of g laucoma13. Recent advances in computational power capabilities have allowed implementation
of convolutional neural networks (CNN) facilitating autonomous classification of glaucoma based on complex
features derived from thousands of available fundus images. The specificity and sensitivity of these models
range between 85 to 95%, with the transfer-trained models (as opposed to native trained) achieving the highest
performance in separating glaucoma from healthy fundus images14–16. While these experimental results show
that pre-trained CNNs have the ability to achieve superior results in classifying glaucomatous fundus images,
the complexity of glaucoma pathology poses unique challenges for CNNs trained on fundus images only. More
1
Vision Science Group, Graduate School of Health, University of Technology Sydney, Sydney, Australia. 2Centre for
Eye Health, School of Optometry and Vision Science, University of New South Wales, Sydney, Australia. 3Center
for Artificial Intelligence, Faculty of Engineering and Information Technology, University of Technology Sydney,
Sydney, Australia. 4Department of Ophthalmology, Prince of Wales Hospital, Sydney, Australia. 5School of
Optometry and Vision Science, University of New South Wales, Sydney, Australia. *email: soheila.gheisari@
uts.edu.au
Scientific Reports | (2021) 11:1945 | https://doi.org/10.1038/s41598-021-81554-4 1
Vol.:(0123456789)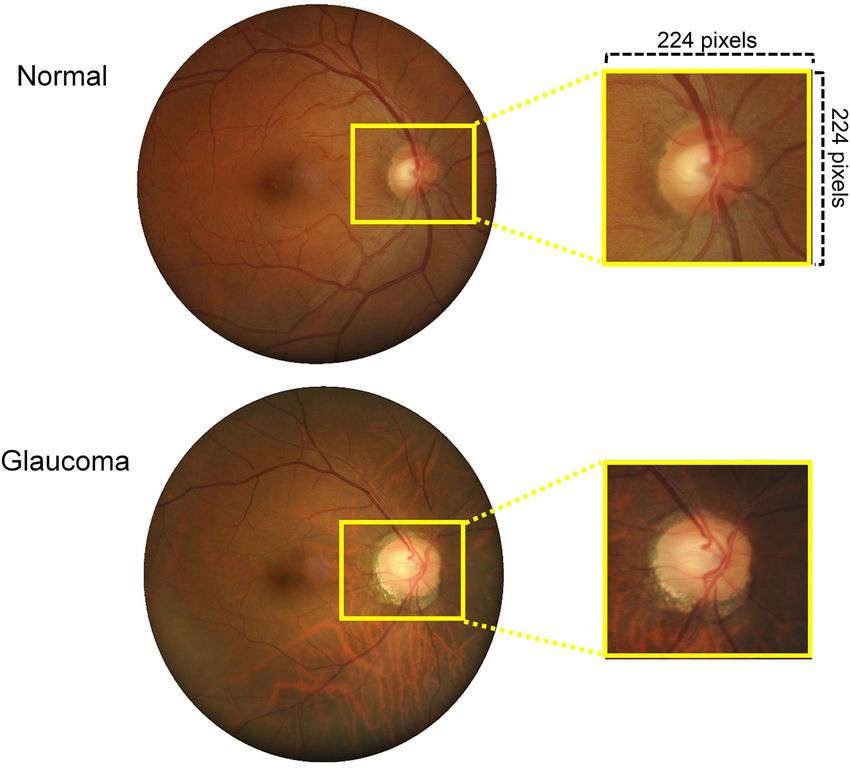
www.nature.com/scientificreports/
Glaucoma Normal
Number of participants 379 316
Gender (female) 158 151
Gender (male) 221 165
Average age (years, SD) 65.1 ± 13 47 ± 15
Table 1. Participant demographics and data distribution.
specifically, population differences in optic disc size and colouration17 as well myopic discs18 are a potential source
of errors for these networks as they have strong correlations with critical ONH structural parameters such as
cup-disc ratio and neuroretinal rim thickness relevant to glaucoma diagnosis. Accordingly, such networks can
only reach certain levels of accuracy and precision without compromising on false positive rates.
As glaucoma encompasses a range of spatial and temporal features, for any autonomous approach, it is essen-
tial to treat it as a video classification problem, rather than a static image problem. By taking such approach,
spatial features such as changes to ONH morphology as well as temporal features such as amplitude of spon-
taneous venous pulsations are taken into account. In this study, we propose a novel approach through which a
combined CNN and recurrent neural network (RNN) is used to extract spatial and temporal features embedded
in fundus videos to detect glaucoma.
Methods
Data collection. Fundus images and videos were collected from 489 and 206 participants attending the
Centre for Eye Health (University of New South Wales, Sydney, Australia), Marsden Eye Clinic, and Vision
Research Clinic (UTS). For fundus videos, participants had a bilateral dilated funduscopy and a minimum 5-s
recording (30 frames per second at a 46/60 degrees’ field of view of the retina, and 2.2 image magnification) cen-
tred on the optic disc (Table 1). All subjects were required to be > 18 years of age, visual acuity better than 6/12,
and have sufficiently clear ocular media for accurate capturing of fundus photos and videoscopy.
We included patients with glaucoma who had primary open-angle (either high- or low-tension glaucoma),
pseudoexfoliative or pigmentary glaucoma. Glaucoma patients were diagnosed clinically on the basis of charac-
teristic structural losses observed on dilated stereoscopic examination of the optic nerve head (including but not
limited to the following features: increased cup-to-disc ratio, cup-to-disc ratio asymmetry, localised or general-
ised neuroretinal rim thinning or notching, deepening of the optic cup, and glaucomatous disc haemorrhages)
with or without concordant visual field defects on conventional white-on-white standard automated perimetry
(Humphrey Field Analyzer, 24-2 SITA-Standard; Carl Zeiss Meditec, Dublin, CA). Glaucomatous visual field
defects were not attributable to other diseases of the visual pathway and were defined as any of the following:
three or more contiguous points of sensitivity reduction with a significance level of p < 0.05, of which at least one
point is significant at the p < 0.01 level, on the pattern deviation map; a pattern standard deviation result with
a significance level of p < 0.05; or three consecutive Glaucoma Hemifield Tests that were outside normal limits.
Elevated intraocular pressure was not required for a diagnosis of glaucoma. In all cases, a glaucoma specialist
was responsible for diagnosis of glaucoma.
Normal subjects were required to have a normal visual field (pattern standard deviation not less than p < 0.05;
Glaucoma Hemifield Test within normal limits; and no cluster of points of depression as described above), nor-
mal ocular health on comprehensive dilated fundus examination and intraocular pressure below 22 mmHg. A
glaucoma specialist was also involved in identifying these patients as ophthalmically normal (i.e. no glaucoma).
For all subjects, optical coherence tomography was used as an adjunct to the diagnostic process, but no specific
numerical cut-offs were used to determine whether or not a patient had glaucoma.
This study was performed in accordance with the guidelines of the tenets of the Declaration of Helsinki and
approved by the University of New South Wales and University of Technology Sydney’s Human Research Ethics
Committee. Informed consent was obtained from each subject following an explanation of the nature of the study.
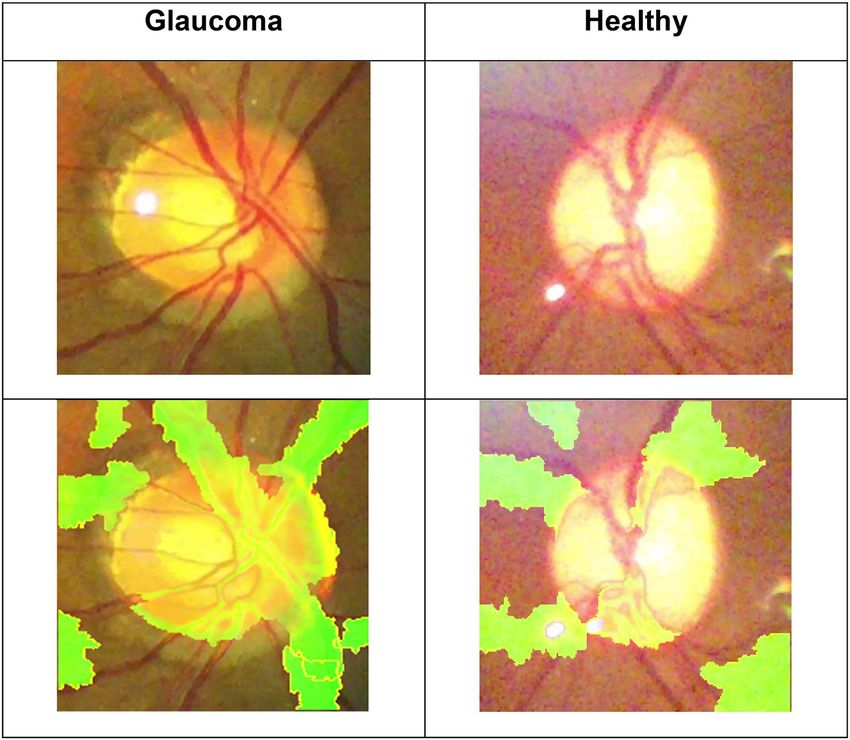
Preprocessing of data. Prior to developing the deep leaning architecture, one of the authors (SG) normal-
ized all the images and frames and then marked the center of the optic disc in all of the frames in each video.
An automated algorithm (custom written in MATLAB, The Mathworks, Massachusetts, USA) was then applied
to crop all images to a square region centered on the optic disc and limited to two disc diameters surrounding
the manually marked disc center. This approach was chosen as glaucoma-specific static and dynamic features
are mainly manifested on retinal tissue surrounding the ONH. Furthermore, a previous study by Orlando and
colleagues has shown that cropping images around the optic disc is more efficient than using the whole images
for training C NNs19. Finally, we employed a data augmentation procedure to solve the imbalance issue in our
dataset and to increase the amount of normal images in the training set. The training images were augmented
through random rotation, zooming and horizontal flipping. As the default size of the input images to the net-
work is 224 × 224, we resized the images to match this specification (Fig. 1).
Convolutional neural network (CNN): extracting spatial features from retinal images. We
evaluated two different deep learning architectures in this study: VGG1620 and ResNet5021. These architectures
were selected as they have been widely used for medical image classification tasks22. Both networks have a similar
architecture and comprise of convolutional layers, pooling layers and a final fully connected layer that produces a
Scientific Reports | (2021) 11:1945 | https://doi.org/10.1038/s41598-021-81554-4 2
Vol:.(1234567890)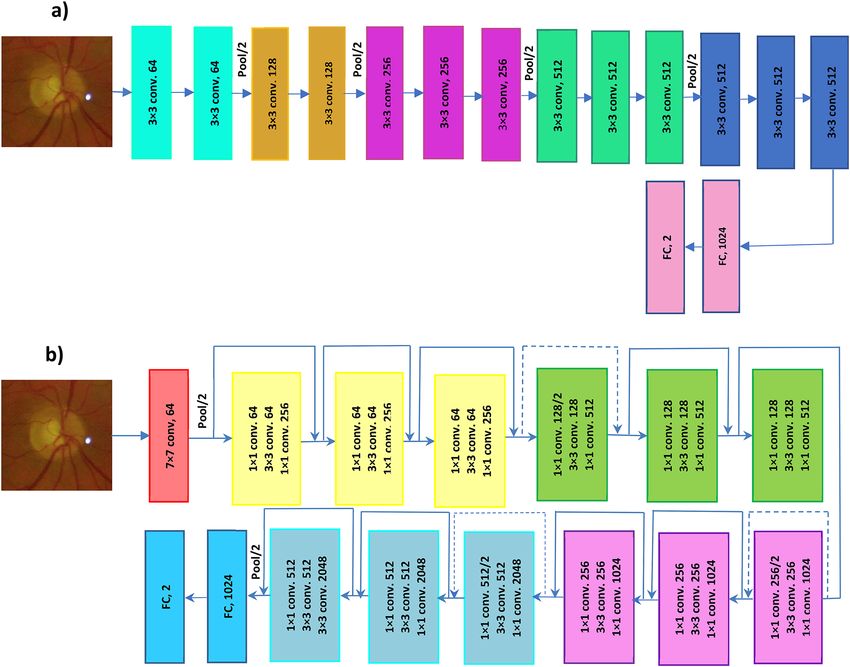
www.nature.com/scientificreports/
Figure 1. Examples of the original and cropped fundus images. All images were labeled as normal or glaucoma.
label for the input image (Fig. 2). The depth of VGG16 is 16 layers (13 convolutional layers and 3 fully connected
layer). ResNet50 contains 50 layers (16 residual layers and 2 fully connected layers, each residual layer contains
3 convolutional layers). The input of the networks was set to 224 × 224 pixel images that are passed through a
stack of convolutional layers. The convolutional layers filter images with a kernel size of 3 × 3. Each convolutional
block, a group of convolutional layers, is followed by a max-pooling layer. Applying the max-pooling layer not
only allows the higher layer outputs to be resilient to subtle changes in the input, but also reduces the overall
computational cost. A stack of convolutional layers is followed by fully connected (FC) layers to map the con-
volutional features to the feature vectors. The CNNs act like a feature extractor that extract static features of the
input image.
Recurrent neural network: extracting temporal features from retinal videos. Recurrent neural
networks (RNN) are specifically designed to identify patterns in sequences of data or, in our scenario, images.
In a traditional neural network, all inputs are treated as being independent of each other. The limitation of such
approach is in tasks that require the network to remember events from previous data, such as predicating a word
in a sentence or predicting a frame in a video. As RNNs perform the same task for every element of a sequence,
they are called recurrent. In these networks, the output depends on previous computations. Moreover, these
networks have a “memory” which captures information about what has been calculated so far. The most popular
RNN network is Long Short Term Memory (LSTM), originally proposed by Hochreiter and Schmidhuber23, to
learn long term dependencies. The superior performance of LSTM in language translation and speech process-
ing has made it the first RNN of choice for tasks that feature extraction from a sequence of data is required (i.e.
videos).
The LSTM architecture comprises memory blocks with each block containing a number of memory cells. Each
memory cell consists of three gates: forget, input and output gate. The forget gate is an σ function that decides
which information to retain and which to forget. The input gate decides what new information is to be stored in
each cell. The output gate selects useful information from the current cell state and displays it as an output (Fig. 3).
Scientific Reports | (2021) 11:1945 | https://doi.org/10.1038/s41598-021-81554-4 3
Vol.:(0123456789)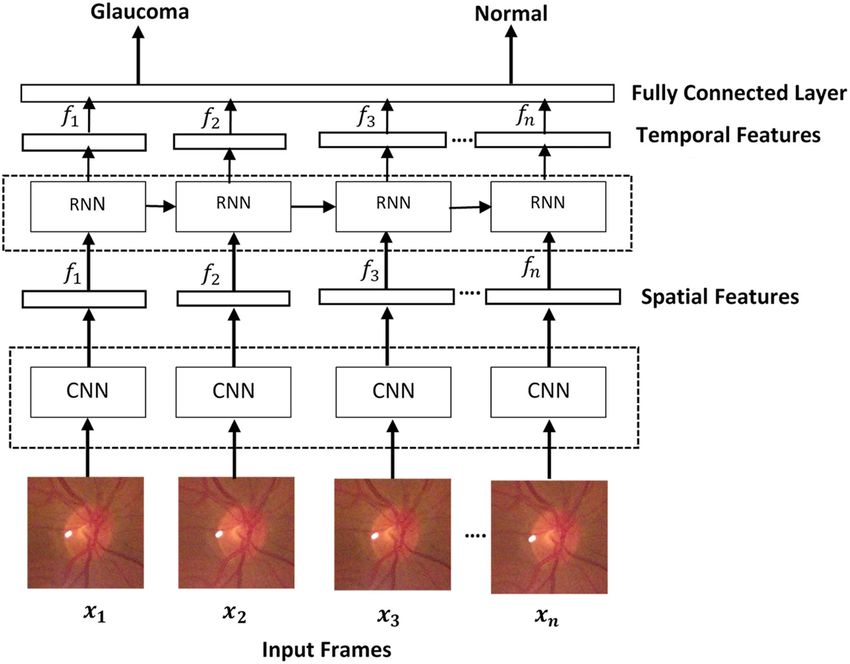
www.nature.com/scientificreports/

                                            Figure 2.  Overall framework of convolutional neural networks. (a) VGG16, (b) ResNet50.

                                            Figure 3.  Structure of the Long Short Term Memory (LSTM), encompassing the three gates; forget, input and
                                            output. X denotes the input of the memory, h is the prediction at time t, and σ is a function that selects which
                                            information to retain or forget.

          Scientific Reports |   (2021) 11:1945 |                https://doi.org/10.1038/s41598-021-81554-4                                                    4

Vol:.(1234567890)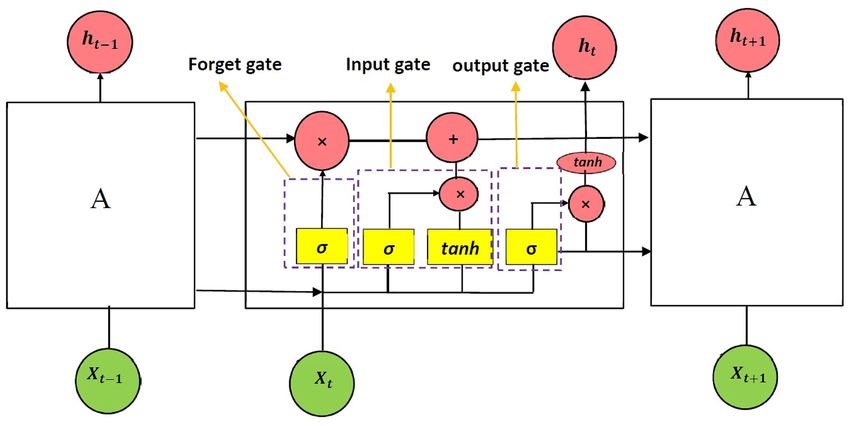
www.nature.com/scientificreports/
Figure 4. Overall framework of the fused Convolutional Neural Network-Recurrent Neural Network (CNN-
RNN). The extracted spatial features from the CNN passes through the RNN to create the temporal features.
Combining CNN and RNN. We developed a combined CNN (VGG16 and ResNet 50) and RNN (LSTM)
architecture to extract spatial and temporal features, respectively. The overall framework of our approach is
shown in Fig. 4. Each video is converted into sequential images and passed onto the CNN to extract spatial
features. The outputs are then passed into a recurrent sequence learning model (i.e. LSTM) to identify temporal
features within the image sequence. The combined features are finally passed on to a fully connected layer to
predict the classification for the full input sequence.
Network training. We evaluated the networks described earlier using transfer learning. In transfer learn-
ing, as opposed to native training, model weights are initialized based on the ImageNet dataset, a large bench-
mark dataset in object category classification and detection on hundreds of object categories and millions of
images. Transfer learning is to initialize the model weights based on a huge general image dataset, except for the
fully connected layers which are trained on our constructed fundus dataset. To train and evaluate the models,
we divided the dataset randomly into three subsets: training (85% of total images), testing (10% of total images),
and validation (5% of total images) and quantified the F-measure, precision and recall. This procedure was
repeated ten times and the average of F-measures, precisions and recalls are reported. To ensure a homogenous
training and testing, all images and videos from an individual participant were included in the same subset. In
other words, all the images and videos used for testing the network were not “seen” by the network as part of the
training and validation step.
Local interpretable model‑agnostic explanations: uncovering the black box. We employed the
Local Interpretable Model-Agnostic Explanations (LIME) algorithm to visualize sections of the image that the
model is using to produce its final prediction. Briefly, LIME works based on creating a new dataset that contains
permuted samples and the associated predictions. The new dataset is then used to train a new model which is
weighted by the proximity of various features in the input image to the feature of interest. As a result, the weights
are continuously updated based on whether they are contributing to the prediction or are against it. The fully
trained new model is then used to interpret and explain the predictions24.
Network evaluation. For each of the models; VGG16, Resnet50, VGG16 + LSTM and Resnet50 + LSTM,
the performance was evaluated on the training and test datasets using sensitivity, specificity, and F-measure. The
Scientific Reports | (2021) 11:1945 | https://doi.org/10.1038/s41598-021-81554-4 5
Vol.:(0123456789)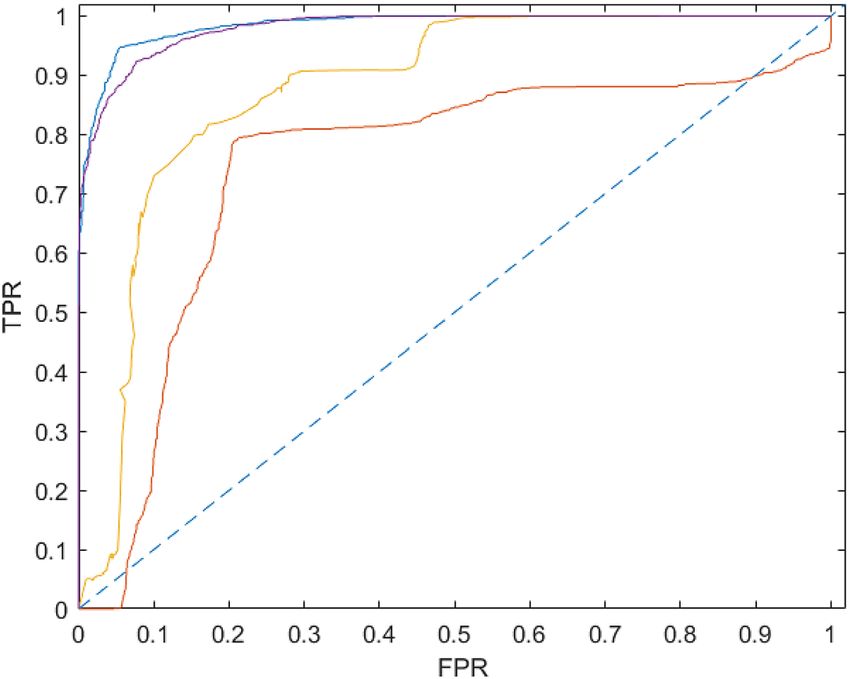
www.nature.com/scientificreports/

                                             Models            Sensitivity   Specificity   F-measure (%)
                                             CNN
                                             VGG16             0.59 ± 0.1    0.65 ± 0.23   70.3 ± 5
                                             Resnet50          0.71 ± 0.19   0.76 ± 0.13   79.2 ± 11.6
                                             CNN + RNN
                                             VGG16 + LSTM      0.95 ± 0.02   0.96 ± 0.02   96.19 ± 1.7
                                             Resnet50 + LSTM   0.89 ± 0.04   0.97 ± 0.02   94.03 ± 2.1

                                            Table 2.  Performance of the various models on the total dataset.

                                             Models            Sensitivity   Specificity   F-measure (%)
                                             CNN
                                             VGG16             0.59          0.55          56.4
                                             Resnet50          0.72          0.70          70.3
                                             CNN + RNN
                                             VGG16 + LSTM      0.94          0.86          89.9
                                             Resnet50 + LSTM   0.88          0.79          83.9

                                            Table 3.  Performance of the various models on the age-matched dataset.

                                            area under the receiver operating characteristics curve (AUC) was also used to evaluate the performance of each
                                            model.

                                            Results
                                            The combination of VGG16 and LSTM achieved the highest performance. To determine the best
                                            performance for each model, we ran several experiments varying the number of epochs, batch size and learning
                                            rate. A batch size of eight, 20 epochs, and a learning rate of 0.001 were determined as the optimum values to
                                            achieve the best performance. Table 2 summarizes the sensitivity, specificity and F-measure achieved for each of
                                            the models, using the aforementioned parameters. Our results show that the combination of VGG16 and LSTM
                                            achieved the highest accuracy, outperforming the models trained and tested on spatial features only.
                                                As our overall database had a significant age difference between the glaucoma and normal group, a subsequent
                                            analysis was performed on a subgroup of age-matched glaucoma and normals to determine whether age may
                                            have a likely effect on the end results. A total of 23 glaucomatous fundus videos (obtained from 22 glaucoma
                                            participants, 67 ± 12 years) and 26 normal fundus videos (obtained from 17 healthy participants, 64 ± 18 years)
                                            were selected and tested using each of the models (no significant difference in age; p > 0.05). Table 3 summarizes
                                            the sensitivity, specificity and F-measure achieved for each model. Consistent with earlier results, aggregation of
                                            VGG16 and ResNet50 with LSTM achieved the higher F-measure, sensitivity and specificity, with the combined
                                            VGG16 and LSTM achieving the highest performance amongst all the models.

                                            Combined CNN and RNN models achieved significantly higher performance than CNNs
                                            alone. An inter-group analysis was performed to evaluate the performance of each model in comparison to
                                            others. A one-way ANOVA applied to the average sensitivity, specificity and F-measure revealed a significant
                                            difference amongst all models (p < 0.0001, p < 0.001, p < 0.0001, respectively). Post-hoc analysis showed that a
                                            combined CNN and RNN, outperformed sole CNN models across all measures of sensitivity, specificity, and
                                            F-measure. The combination of VGG16 and LSTM achieved the highest performance in comparison to VGG16
                                            for separating glaucoma from healthy image and videos, with a sensitivity of 0.95 (vs. 0.59; p < 0.0001) , specific-
                                            ity of 0.96 (vs. 0.65; p < 0.0001), and F-measure of 96 (vs. 70; p < 0.0001). (detailed post-hoc results available in
                                            supplementary file, tables S1-S3).

                                            Combined VGG16 and LSTM achieved the highest AUC in separating glaucoma from healthy
                                            eyes. To evaluate each model’s performance in separating glaucoma from healthy eyes, we compared the
                                            area under the Receiver Operating Characteristic Curves (AUC). The VGG16 and ResNet50 models achieved
                                            an AUC of 0.6 and 0.83, respectively. However, these values increased to 0.99 and 0.97 for VGG16 + LSTM and
                                            ResNet50 + LSTM, respectively. Consistent with previous results, the combined VGG16 and LSTM achieved the
                                            highest AUC (Fig. 5).
                                               The loss and accuracy plots over the epochs for the train dataset are shown in Figs. 6 and 7. From the curves,
                                            we can see that our methods have a good behavior of convergence.

                                            Temporal features drive the accuracy of the end prediction. To evaluate whether the increased
                                            accuracy observed in the combined models are driven by temporal features (and is not due to the increased

          Scientific Reports |   (2021) 11:1945 |                 https://doi.org/10.1038/s41598-021-81554-4                                                   6

Vol:.(1234567890)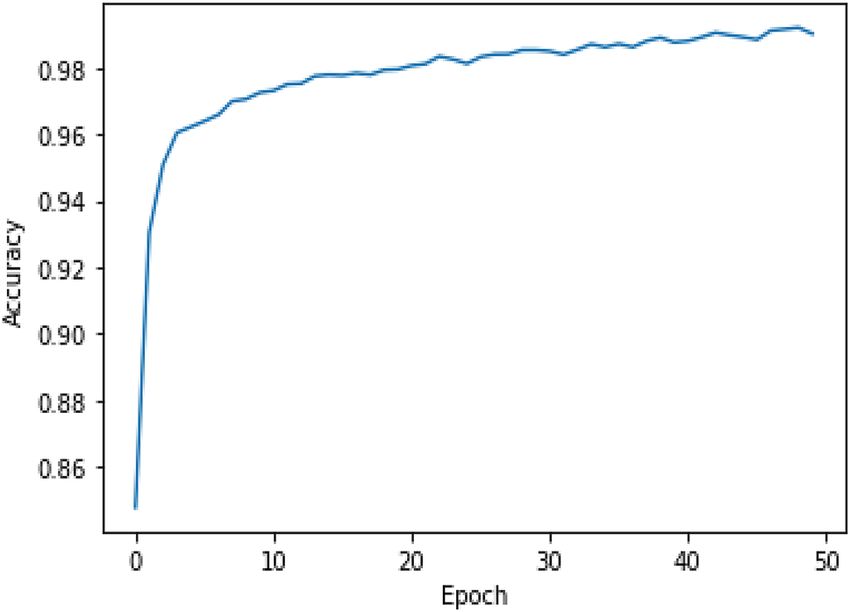
www.nature.com/scientificreports/

                                  Figure 5.  The receiver operating characteristic curves (AUC) for all the different models.

                                  Figure 6.  The loss over the epochs for the train dataset.

                                  Figure 7.  The accuracy over the epochs for the train dataset.

Scientific Reports |   (2021) 11:1945 |                https://doi.org/10.1038/s41598-021-81554-4                                    7

                                                                                                                                Vol.:(0123456789)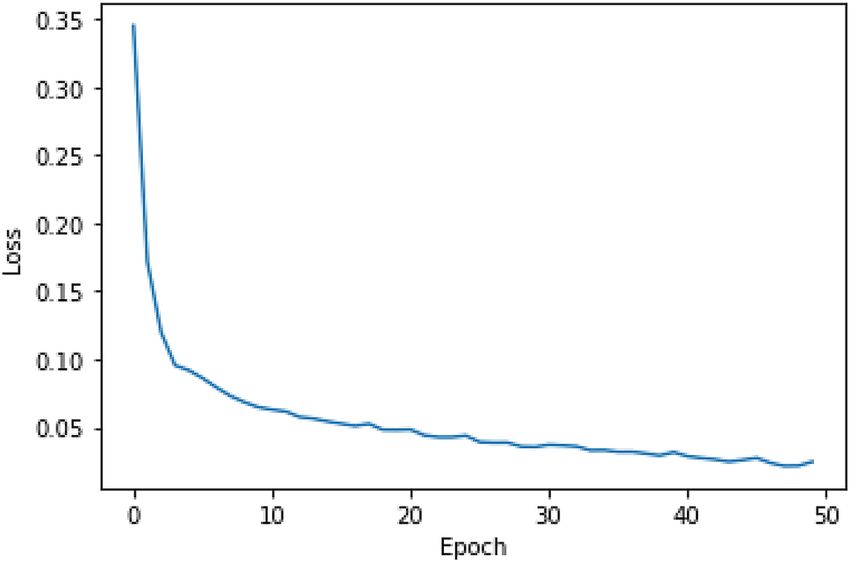
www.nature.com/scientificreports/

                                             Models                       Sensitivity           Specificity            F-measure (%)
                                             VGG16 + LSTM                 0.51                  0.58                   63
                                             Resnet50 + LSTM              0.76                  0.64                   82

                                            Table 4.  Performance of combined CNN with RNN trained on images and tested on sequential images.

                                            Figure 8.  Average intensity map (60 sequential frames) from the LIME algorithm applied to the combined
                                            models showing significant regions of the image used to predict glaucoma and healthy. Regions with brighter
                                            intensity (green) indicate a larger impact compared to regions with lower intensity (yellow).

                                            sample size as result of multiple frames), we trained the combined models using fundus images, tested with
                                            sequential frames, all whilst eliminating the sequential frames from the training set. A significant decrease in the
                                            performance of both combined models was noted, further confirming that temporal features played a significant
                                            role in achieving the higher performance shown earlier (Table 4).

                                            Vascularized regions were predominantly influential in predicting end‑classification. The
                                            LIME algorithm was employed to uncover regions of the image that the combined CNN/RNN model is using
                                            to extract spatial and temporal features and to produce its final class prediction (i.e., glaucoma or normal). The
                                            vascularized regions of superior and inferior retina were identified as regions of “influence” the VGG16 + LSTM
                                            has utilized in determining the final classification (Fig. 8). As we applied CNN + RNN on sequential frames of a
                                            video, the LIME algorithm is applied on one frame of a video to visualize the difference between a healthy and
                                            a glaucoma eye.

                                            Discussion
                                            In this study, we show, for the first time, that training a combined CNN and RNN on retinal image sequences,
                                            can extract both spatial and temporal features, resulting in significantly improved detection of glaucoma. More
                                            specifically, the combination of a VGG16 or ResNet50 network with an LSTM architecture, reached significantly
                                            higher sensitivity and specificity rates compared with a base VGG16 or ResNet50 network. The VGG16 + LSTM
                                            combination reached the highest performance, amongst all other networks, achieving a sensitivity of 0.95, speci-
                                            ficity of 0.96, F-measure of 96.19% and an AUC of 0.99 in separating glaucoma from healthy eyes. The concept

          Scientific Reports |   (2021) 11:1945 |                https://doi.org/10.1038/s41598-021-81554-4                                                   8

Vol:.(1234567890)
www.nature.com/scientificreports/
described here provides the first solid evidence that by treating glaucoma as a video classification task, a highly
accurate and autonomous AI-based approach for glaucoma detection can be developed.
While the retinal structures are static in nature, our reasoning for improved performance of the combined
model is based on the dynamic changes of retinal vasculature observed at the ONH. More specifically, there is
now evidence that the amplitude of spontaneous venous pulsations (SVP) are linked to glaucomatous pathology
with lower SVPs associated with thinner RNFL thickness and visual field d efects25. While the origin of SVPs is a
matter of debate, there is a consensus that the trans-laminar pressure difference is the main driver behind these
pulsations. The translaminar pressure is governed by the difference in IOP and the pressure of the cerebrospinal
fluid surrounding the optic nerve sheath; both of which have been linked to glaucomatous pathology26,27. Fur-
thermore, using a modified photoplethysmography tool (i.e., using the green channel of a colour fundus video
to visualise blood column variation in the axial direction and across all regions of the retina.), Morgan et al. have
shown a reduction in blood column intensity of glaucoma patients compared to normal9. It is these vascular
changes that manifest themselves through temporal features of a fundus video and in combination with spatial
features of the ONH, result in an overall improved performance of the combined model, as demonstrated in
this study.
Deep CNNs have proven to be an efficient AI-based tool in identifying clinically significant features from reti-
nal fundus i mages28–31. Deep CNNs trained on glaucomatous fundus images have achieved a varied performance
ranging from 0.75 to 0.9 in sensitivity and 0.65 to 0.97 s pecificity16,32,33 and these differences may be related to
sample size. A recent study by Liu et al.34, using a deep CNN architecture applied to 3,788 fundus photographs,
showed a 87.9% in sensitivity and 96.5% in specificity in glaucomatous disc identification. A follow-up study by
Christopher et al.15, using a similar approach on 14,822 fundus photographs, showed a network sensitivity and
specificity of 0.84 and 0.83 in distinguishing glaucoma eyes from healthy eyes. There have been other attempts
at applying deep learning to a combination of retinal imaging modalities, mainly fundus images and optical
coherence tomography (OCT) scans, to improve network performance. Such networks have achieved an area
under the ROC curve of 0.94 in separating glaucoma from normal healthy e yes35. While promising, the approach
requires access to both modalities and double the data, limiting scaling for large screening programs, mainly
in remote and rural areas where access to OCT can be scarce. Furthermore, such approach is, again, based on
spatial features only, neglecting the potential impact of temporal features. In contrast, our approach only requires
a single device that can capture retinal image and videos.
Collectively, while deep learning methods have been capable of classifying glaucoma based on fundus images,
they are yet to be utilised in a clinical setting mainly due to a high proportion of false positive rates and low
precision. To overcome this limitation, we developed a model combining a deep spatial feature extractor (i.e.
VGG16 and ResNet 50) with a model that can learn to recognize and synthesize temporal features (i.e. LSTM).
By taking this approach, our aim was to combine glaucoma-specific temporal features (extracted from image
sequences) with spatial biomarkers (extracted from fundus images) to significantly improve classification results
compared with a model trained on fundus images only.
To compare results between base and combined models, we constructed and trained a number of architec-
tures; VGG16, ResNet50, VGG16 + LSTM, and ResNet50 + LSTM. For all networks, a transfer training approach
was used. This method was chosen mainly for two reasons. First, Christopher et al.15, has shown that a model
encompassing transfer learning achieves a statistically significantly higher performance than natively trained
models. Second, our sample size is relatively small and thus native training may not have achieved the intended
results we were anticipating. All networks were trained and tested on images and sequential frames extracted
from the videos. Our results showed that overall a combined CNN and RNN outperforms sole CNNs.
Amongst all the models trained, the combined VGG16 and LSTM achieved the highest performance. Intra-
group analysis revealed a marginal statistically significant difference between the VGG16 and ResNet50 network
(p = 0.04), with the latter achieving a higher F-measure. This is consistent with a previous report demonstrat-
ing higher performance of ResNet50 compared with V GG1615. We also observed a non-significant difference
between the VGG16 + LSTM and ResNet50 + LSTM (p = 0.19). While ResNet50 outperformed VGG16, it was
the combination of VGG16 and LSTM that achieved the highest performance. This could be attributed the
network structure within each model. Our trained ResNet50 had a total of 50 layers compared with 16 layers
in the VGG16. Deeper networks extract more complicated features and achieve higher accuracy. The fact that
the combination of VGG16 with LSTM achieved higher performance, demonstrates that the temporal features
are possibly a dominant factor in predicting output classification compared to spatial features. As the output
dimension of the ResNet50 is higher than VGG16, its connection with the LSTM needs more parameters. Both
networks, VGG16 + LSTM and ResNet50 + LSTM are trained with the same dataset. However, Resnet50 + LSTM
requires more training data since it has more free parameters. Therefore, under similar conditions, the network
with more free parameters (i.e. VGG16 + LSTM) achieves higher accuracy.
To help understand and visualize the temporal features of the image sequence the combined model is utilizing
to distinguish glaucoma from healthy videos, we used the LIME algorithm. Results showed that the vascular-
ized regions of superior and inferior retina have the greatest impact on the model prediction. This is consistent
with our previous studies that showed a dynamic vascular change in glaucoma eyes10,36. We further evaluated
the significance of temporal features on the model prediction by training the combined models using fundus
images and testing with sequential images. This resulted in an average 22% decrease in the F-measure of the
combined models, further proof that temporal features play a significant role in increasing model performance.
Limitations. Our study has a number of limitations. First, our sample size is relatively small and is from a
racially homogenous population. This has resulted in lower network accuracy of the stand-alone VGG16 and
ResNet50 compared to other research reports. However, the primary goal of our study was not to develop a
Scientific Reports | (2021) 11:1945 | https://doi.org/10.1038/s41598-021-81554-4 9
Vol.:(0123456789)www.nature.com/scientificreports/
highly precise model for glaucoma detection, but rather demonstrate that adding recurrent connections to
stand-alone CNNs could significantly increase a network’s performance in separating glaucoma from healthy
images .Nonetheless, we acknowledge that a larger and heterogeneous sample size is required to further sup-
port our findings. Second, videos obtained from glaucoma and normal participants, encompassing our final
dataset, were not age-matched. However, we performed an analysis on a subgroup of age-matched glaucoma and
controls, with results confirming our initial findings; combined CNN/RNN performed superior compared with
CNN-only models. Third, the ground truth was based on the clinical evaluation of two different expert clini-
cians, with one labelling the images and the other labelling the videos. Accordingly, we cannot determine agree-
ment. However, given that a benchmark inclusion and exclusion criteria was used for each of the two groups, we
do not anticipate a significant impact on our findings. Finally, the camera used to capture retinal fundus videos
was different to that of used for capturing retinal fundus images. As a result, the effect of such approach on our
results cannot be determined.
In conclusion, this study presented a novel AI-based approach for glaucoma detection based on unification
of spatial (static structural) and temporal (dynamic vascular) features. By considering glaucoma as a video
classification task, our proposed method demonstrated promising performance in separating glaucoma from
healthy compared with models solely reliant on spatial features as their input. Static features such as disc size,
opulations37, and therefore, have hindered
cup and rim size, and cup-to-disc ratio are variable across different p
development of models with high sensitivity and s pecificity38. The method proposed here achieved a sensitivity
of 0.95 and specificity of 0.96 in identifying glaucoma and thus, may provide an impetus for large-scale screening
programs. However, further evaluation on a larger, heterogeneous population is required.
Received: 22 June 2020; Accepted: 5 January 2021
References
1. Casson, R. J., Chidlow, G., Wood, J. P., Crowston, J. G. & Goldberg, I. Definition of glaucoma: Clinical and experimentalconcepts.
Clin. Exp. Ophthalmol. 40, 341–349. https://doi.org/10.1111/j.1442-9071.2012.02773.x (2012).
2. Weinreb, R. N. et al. Primary open-angle glaucoma. Nat. Rev. Dis. Primers 2(1), 160–167. https://doi.org/10.1038/nrdp.2016.67
(2016).
3. Weinreb, R. et al. Risk assessment in the management of patients with ocular hypertension. Am. J. Ophthalmol. 138, 458–467.
https://doi.org/10.1016/j.ajo.2004.04.054 (2004).
4. Wiley, H. & Iii, F. Nonproliferative diabetic retinopathy and diabetic macular edema. Retina Fifth Edn. 2, 940–968 (2012).
5. Spaeth, G. L. et al. The disc damage likelihood scale: Reproducibility of a new method of estimating the amount of optic nerve
damage caused by glaucoma. Trans. Am. Ophthalmol. Soc. 100, 181–186 (2002).
6. Garway-Heath, D. F. et al. Inter- and intraobserver variation in the analysis of optic disc images: Comparison of the Heidelberg
retina tomograph and computer assisted planimetry. Br. J. Ophthalmol. 83(6), 664–669. https: //doi.org/10.1136/bjo.83.6.664 (1999).
7. Flammer, J. et al. The impact of ocular blood flow in glaucoma. Prog. Retina Eye Res. 21(4), 359–393. https: //doi.org/10.1016/s1350
-9462(02)00008-3 (2002).
8. Golzan, S. M., Graham, S., Leaney, J. & Avolio, A. Dynamic association between intraocular pressure and spontaneous pulsations
of retinal veins. Curr. Eye Res. 36, 53–59. https://doi.org/10.3109/02713683.2010.530731 (2011).
9. Morgan, W. H. et al. Photoplethysmographic measurement of various retinal vascular pulsation parameters and measurement of
the venous phase delay. Investig. Ophthalmol. Vis. Sci. 55(9), 5998–6006. https://doi.org/10.1167/iovs.14-15104 (2014).
10. Golzan, S. M., Morgan, W. H., Georgevsky, D. & Graham, S. L. Correlation of retinal nerve fibre layer thickness and spontaneous
retinal venous pulsations in glaucoma and normal controls. PLoS ONE 10(6), 1–12. https://doi.org/10.1371/journal.pone.01284
33 (2015).
11. Golzan, S. M., Georgevsky, D., Bowd, C., Weinreb, R. & Graham, S. Visual field sensitivity is decreased with reduced spontaneous
venous pulsation in glaucoma eyes. Investig. Ophthalmol. Vis. Sci. 58(8), 734 (2017).
12. Morgan, W. H., Hazelton, M. L. & Yu, D.-Y. Retinal venous pulsation: Expanding our understanding and use of this enigmatic
phenomenon. Prog. Retina Eye Res. 55, 82–107. https://doi.org/10.1016/j.preteyeres.2016.06.003 (2016).
13. Cheriguene, S., Azizi, N., Djellali, H., Bunakhla, O., Aldwairi, M. and Ziani, A. New computer aided diagnosis system for glaucoma
disease based on twin support vector machine. In International Conference on Embedded Distributed Systems (EDiS), pp. 1–6,
(2017).
14. Al-Bander, B., Al-Nuaimy, W., Al-Taee, M. A. and Zheng, Y. Automated glaucoma diagnosis using deep learning approach. In 14th
International Multi-Conference on Systems, Signals & Devices (SSD), pp. 207–210 (2017).
15. Christopher, M. et al. Performance of deep learning architectures and transfer learning for detecting glaucomatous optic neuropathy
in fundus photographs. Sci. Rep. https://doi.org/10.1038/s41598-018-35044-9 (2018).
16. Diaz-Pinto, A., Morales, S., Naranjo, V., Thomas, K. & Mossi, J. M. CNNs for automatic glaucoma assessment using fundus images:
An extensive validation. BioMed. Eng. 18(29), 1–19. https://doi.org/10.1186/s12938-019-0649-y (2019).
17. Huynh, S. C., Wang, X. Y., Rochtchina, E., Crowston, J. G. & Mitchell, P. Distribution of optic disc parameters measured by OCT:
Findings from a population-based study of 6-year-old Australian children. Investig. Ophthalmol. Vis. Sci. 47(8), 3276–3285. https
://doi.org/10.1167/iovs.06-0072 (2006).
18. Tan, N. Y. Q., Sng, C. C. A. & Ang, M. Myopic optic disc changes and its role in glaucoma. Curr. Opin. Ophthalmol. 30(2), 89–96
(2019).
19. Orlando, J., Prokofyeva, E., Fresno, M., and Blaschko, M. Convolutional neural network transfer for automated glaucoma identi-
fication. In International Symposium on Medical Information Processing and Analysis, pp. 241–250 (2017).
20. Simonyan, K. and Zisserman, A. Very deep convolutional networks for large image recognition. In International Conference Learn-
ing Representation, pp. 1–14 (2015).
21. Szegedy, C., Ioffe, S. and Vanhoucke, V. Inception-v4, inception-ResNet and the impact of residual connections on learning, In
Computer Vision and Pattern Recognition (CVPR) 2016.
22. Geert, L. et al. A survey on deep learning in medical image analysis. Med. Image Anal. 42, 60–88. https://doi.org/10.1016/j.media
.2017.07.005 (2017).
23. Hochreiter, S. & Schmidhuber, J. Long short-term memory. Neural Comput. 9(8), 1735–1780 (1997).
24. Ribeiro, M. T., Singh, S. and Guestrin, C. Why should I trust you? Explaining the predictions of any classifier. In Proceedings of
the 22nd ACM SIGKDD International Conference on Knowledge Discovery and Data Mining, pp. 1135–1144 (2016). https://doi.
org/10.18653/v1/N16-3020.
Scientific Reports | (2021) 11:1945 | https://doi.org/10.1038/s41598-021-81554-4 10
Vol:.(1234567890)www.nature.com/scientificreports/
25. Golzan, S. M., Morgan, W. H., Georgevsky, D. & Graham, S. L. "Correlation of retinal nerve fibre layer thickness and spontaneous
retinal venous pulsations in glaucoma and normal controls. PLoS ONE https://doi.org/10.1371/journal.pone.0128433 (2015).
26. Jonas, J. B., Ritch, R. & Panda-Jonas, S. Cerebrospinal fluid pressure in the pathogenesis of glaucoma. Prog. Brain Res. 221, 33–47
(2015).
27. Price, D. A., Harris, A., Siesky, B. & Mathew, S. The influence of translaminar pressure gradient and intracranial pressure in glau-
coma: A review. J. Glaucoma 29(2), 141–146 (2020).
28. Wen, J. C. et al. Forecasting future humphrey visual fields using deep learning. PLoS ONE https://doi.org/10.1371/journ
al.pone.0214875 (2018).
29. De Fauw, J. et al. Clinically applicable deep learning for diagnosis and referral in retinal disease. Nat. Med. 24(9), 1342–1350 (2018).
30. Schmidt-Erfurth, U., Sadeghipour, A., Gerendas, B. S., Waldstein, S. M. & Bogunović, H. Artificial intelligence in retina. Prog.
Retinal Eye Res. 67, 1–29. https://doi.org/10.1016/j.preteyeres.2018.07.004 (2018).
31. Hogarty, D., Mackey, D. & Hewitt, A. Current state and future prospects of artificial intelligence in ophthalmology: A review:
Artificial intelligence in ophthalmology. Clin. Exp. Ophthalmol. 47, 128–139. https://doi.org/10.1111/ceo.13381 (2018).
32. Devasia, T., Jacob, K. and Thomas, T. Automatic early stage glaucoma detection using cascade correlation neural network. In Second
International Conference on Smart Computing and Informatics (SCI), pp. 659–669, (2019).
33. Zheng, C., Johnson, T. V., Garg, A. & Boland, M. V. Artificial intelligence in glaucoma. Curr. Opin. Ophthalmol. 30(2), 97–103
(2019).
34. Liu, S. et al. A deep learning-based algorithm identifies glaucomatous discs using monoscopic fundus photographs. Ophthalmol.
Glaucoma 1(1), 15–22 (2018).
35. Medeiros, F. A., Jammal, A. A. & Thompson, A. C. From machine to machine: An oct-trained deep learning algorithm for objective
quantification of glaucomatous damage in fundus photographs. Ophthalmology 126(4), 513–521. https://doi.org/10.1016/j.ophth
a.2018.12.033 (2019).
36. Golzan, S. M., Graham, S. L., Leaney, J. & Avolio, A. Dynamic association between intraocular pressure and spontaneous pulsations
of retinal veins. Curr. Eye Res. 36(1), 53–59. https://doi.org/10.3109/02713683.2010.530731 (2011).
37. Zangwill, L. M. et al. Racial differences in optic disc topography: Baseline results from the confocal scanning laser ophthalmos-
copy ancillary study to the ocular hypertension treatment study. JAMA Ophthalmol. 122(1), 22–28. https://doi.org/10.1001/archo
pht.122.1.22 (2004).
38. Ervin, A. M., et al. Screening for glaucoma comparative effectiveness. Agency for Healthcare Research and Quality, Report No.:
12-EHC037-EF., 2012.
Acknowledgements
SMG is a recipient of an NHMRC-ARC Dementia Research Fellowship. Guide Dogs NSW/ACT provides salary
support for MK and JP. We thank the staff at the Centre for Eye Health, University of New South Wales, Australia,
for their technical and clinical assistance.
Author contributions
Methodology, SG; Resources, SS, JP, PJK, AA, MK; Software, SG; Supervision, SMG; Writing original draft, SG;
Writing: review and editing, SS, JP, PK, AA, MK and SMG.
Competing interests
The authors declare no competing interests.
Additional information
Supplementary Information The online version contains supplementary material availlable at https://doi.
org/10.1038/s41598-021-81554-4.
Correspondence and requests for materials should be addressed to S.G.
Reprints and permissions information is available at www.nature.com/reprints.
Publisher’s note Springer Nature remains neutral with regard to jurisdictional claims in published maps and
institutional affiliations.
Open Access This article is licensed under a Creative Commons Attribution 4.0 International
License, which permits use, sharing, adaptation, distribution and reproduction in any medium or
format, as long as you give appropriate credit to the original author(s) and the source, provide a link to the
Creative Commons licence, and indicate if changes were made. The images or other third party material in this
article are included in the article’s Creative Commons licence, unless indicated otherwise in a credit line to the
material. If material is not included in the article’s Creative Commons licence and your intended use is not
permitted by statutory regulation or exceeds the permitted use, you will need to obtain permission directly from
the copyright holder. To view a copy of this licence, visit http://creativecommons.org/licenses/by/4.0/.
© The Author(s) 2021
Scientific Reports | (2021) 11:1945 | https://doi.org/10.1038/s41598-021-81554-4 11
Vol.:(0123456789)You can also read