Electrical impedance characterization of in vivo porcine tissue using machine learning
←
→
Page content transcription
If your browser does not render page correctly, please read the page content below

J Electr Bioimp, vol. 12, pp. 26-33, 2020
 Received 21 mar 2021 / published 25 Jun 2021
 https://doi.org/10.2478/joeb-2021-0005

Electrical impedance characterization of
in vivo porcine tissue using machine learning
Stephen Chiang 1,2,3,4, Matthew Eschbach 2, Robert Knapp 2, Brian Holden 2, Andrew Miesse 2, Steven Schwaitzberg 3,
and Albert Titus 1

1. Department of Biomedical Engineering, University at Buffalo, The State University of New York, Buffalo, NY, USA.
2. Medtronic LLC.
3. Department of Surgery, University at Buffalo, The State University of New York Buffalo, NY USA.
4. E-mail any correspondence to: schiang3@buffalo.edu

Abstract stomach typically increases in thickness from the fundus
The incorporation of sensors onto the stapling platform has been down to the antrum and this must be accounted for when
investigated to overcome the disconnect in our understanding of choosing the staple size to preserve staple line integrity and
tissue handling by surgical staplers. The goal of this study was to prevent leakage of gastric contents [1]. One of the
explore the feasibility of in vivo porcine tissue differentiation using drawbacks of endo-staplers that impacts stapling procedure
bioimpedance data and machine learning methods. In vivo
 is the loss of tactile feedback, which leads to a disconnect
electrical impedance measurements were obtained in 7 young
 between surgeons and the tissue handling characteristics of
domestic pigs, using a logarithmic sweep of 50 points over a
frequency range of 100 Hz to 1 MHz. Tissues studied included lung,
 these devices [2]. The incorporation of sensing technology
liver, small bowel, colon, and stomach, which was further within these instruments provides an opportunity for us to
segmented into fundus, body, and antrum. The data was then supplement, and even improve, our characterization of
parsed through MATLAB’s classification learner to identify the best tissue handling in real time by enabling feedback control of
algorithm for tissue type differentiation. The most effective the stapler. Multiple modalities of tissue characterization
classification scheme was found to be cubic support vector have been explored in the literature including, but not
machines with 86.96% accuracy. When fundus, body and antrum limited to optical [3], biomechanical [4], and bioelectric
were aggregated together as stomach, the accuracy improved to methods [5-7]. Electrical impedance has emerged as a
88.03%. The combination of stomach, small bowel, and colon promising tissue characterization modality as it offers good
together as GI tract improved accuracy to 99.79% using fine k
 temporal resolution and has the advantages of being non-
nearest neighbors. The results suggest that bioimpedance data can
 invasive and non-ionizing. However, it suffers from poor
be effectively used to differentiate tissue types in vivo. This study is
one of the first that combines in vivo bioimpedance tissue data
 spatial resolution and is prone to artifacts from electrode
across multiple tissue types with machine learning methods. movement and contact quality [8]. The utility of electrical
 impedance within medical instruments has already been
Keywords: Bioimpedance; surgical staplers; tissue characterization demonstrated as advanced bipolar devices that deliver
 precise energy to seal and divide tissue by monitoring
 changes in tissue impedance have been on the market for
Introduction over 20 years [9]. By advancing our understanding of tissue
Surgical staplers are widely used in surgical procedures such impedance further, we believe that bioimpedance can
as bariatric, thoracic, colorectal, and general surgery due to provide more sophisticated characterization beyond
their versatility and efficiency (Fig. 1). However, each tissue cauterized tissue to enable identification of tissue type and
type has its own challenges when stapling. For example, the disease states.

© 2020 Author(s). This is an open access article licensed under the Creative Commons Attribution License 4.0.
(http://creativecommons.org/licenses/by/4.0/).

 26
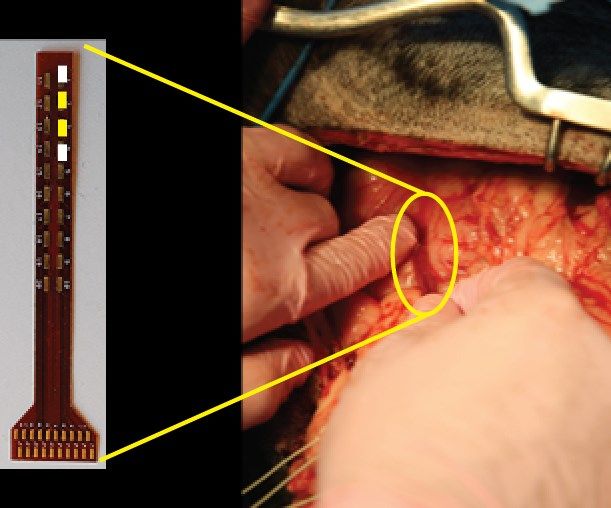
Chiang et al.: Electrical impedance characterization of in vivo porcine tissue. J Electr Bioimp, 12, 26-33, 2021

 0 − ∞
 ( ) = ∞ +
 1 + ( )

 where ω is the angular frequency, R0 is the resistance at
 zero frequency, R∞ is the resistance at infinite frequency, α
 is a dimensionless number between 0 and 1 that describes
 the shape of the curve, and τ is a time constant
 corresponding to the characteristic frequency fC (frequency
 at which the reactance is maximum) [13].
 Machine learning (ML) in medicine has focused primarily
 Fig.1. Medtronic’s Endo GIA laparoscopic stapler on clinical imaging for feature extraction to streamline
 identification of cancer [23]. Improvements in algorithms
 Electrical impedance spectroscopy (EIS) is a method and exponential growth in computing power have enabled
used to generate complex impedance measurements of analysis of large sets of high-dimensional data. While
dielectric materials, by inducing alternating current over powerful, one of the major criticisms of ML is that machine-
multiple frequencies to the material. EIS can be applied to built models are often too complex for human
biological tissue to determine its pathological and understanding. The discrete relationships between variables
physiological state. Impedance of biological tissues is can become muddled leading to a black box effect [24]. In
dependent on cellular features such as intracellular and cell general, machine learning (ML) has promise for tissue
membrane contents. Broad architectural features such as classification as increasingly large and complex data sets are
cellular size, density, spacing, and constituents of the generated. Expanded characterization efforts include not
extracellular matrix (ECM) also play an important role [10]. only simple tissue identification, but also disease states.
Intracellular and extracellular fluids are ionic solutions that Modeling methods have been effective in tissue impedance
provide conducting paths for alternating currents and work when investigations have been limited in scope.
contribute to the resistance portion of impedance. Cell However, when evaluating multiple tissue types and disease
membranes are a lipid bilayer and contribute to a capacitive states, the complex pool of heterogenous data makes it
reactance [10]. The electrical response of tissues has been increasingly difficult to correlate data to relevant equivalent
divided into different segments of frequency responses circuit parameters, making ML more appealing and relevant.
known as dispersions regions [11]. The α dispersion ML methods have been applied to bioimpedance data, albeit
encompasses lower frequencies up to several kHz and is in a more limited scope. Several groups have applied
related to electrical conduction of the extracellular fluid. The machine learning algorithms to bioimpedance data in order
β dispersion region ranges from several kHz to tens of MHz to detect needle to nerve contact [25] and differentiate
and involves the cell membrane and conduction of ischemic from healthy intestinal tissue in vivo [26]. But, to
intracellular fluid. The γ dispersion region from MHz to GHz date, no one has performed classification of in vivo
is associated with biological macromolecules such as bioimpedance tissue data across multiple tissue types using
proteins and organelles [12]. Electrical impedance has ML methods.
already been studied extensively as a means to distinguish In this work, we present and compare the results from in
benign and cancerous tissue. Multiple studies have vivo electrical impedance measurements from pigs in order
demonstrated significant differences in impedance between to attempt to use ML to classify healthy lung, liver, small
normal and malignant tissue for liver, breast, and prostate bowel, colon, and stomach. To our knowledge, this is the first
[13-15]. Since tissue bioimpedance is highly dependent on attempt at using ML to classify these in vivo tissue types
the water content within tissue, studies have also explored based on EIS data.
using impedance to identify areas of hemorrhage or monitor
ischemia [16, 17]. Several groups have also developed Materials and methods
custom impedance probes and demonstrated success in All impedance measurements were performed using a new,
differentiating tissue types in both ex-vivo [6] and in-vivo noncommercially available evaluation board (Analog
[18] settings. Devices, Massachusetts, USA), based on but not identical to
 The traditional method of representing bioimpedance the AD5940. As per the manufacturer notes, the board
data has been with modeling. An equivalent circuit to model utilizes a direct digital synthesis (DDS) chip that can set the
bioimpedance of tissue was produced by the work of Cole et test signal frequency in 0.2 Hz increments up to 10 MHz and
al. [19] and has been widely adopted for bioelectric change the amplitude with 16-bit resolution up to 2.4V. A
characterization [20-22]. The Cole function, shown below, customized flexible array strip (All Flex Inc) was designed
contains four parameters to model bioimpedance data, with two rows 5 mm apart, each with ten gold leads 2.5 mm

 27
Chiang et al.: Electrical impedance characterization of in vivo porcine tissue. J Electr Bioimp, 12, 26-33, 2021

 10025

 10000

 9975

 |Z| (Ω)
 9950

 9925

 Fig. 2. Electrode configuration. Zx represents board impedance 9900
 measurement. H_CUR and L_CUR are connected to ground 1.0E+02 1.0E+03 1.0E+04 1.0E+05 1.0E+06
 electrodes, while H_POT and L_POT are the sense electrodes. Frequency (Hz)

apart, mounted on a flexible copper strip. The sensor strip (a)
was
 Fig.interfaced with the module
 2. Electrode configuration. usingboard
 Zx represents a set of four co-axial
 impedance
cables. Impedance
 measurement. H_CUR andmeasurements in the
 L_CUR are connected literature
 to ground have
 electrodes,
 while H_POT andperformed
 L_POT are the sense electrodes. 5
generally been with two or four electrode setups.
For two electrode systems, the same pair of electrodes are 0
used for both current injection and voltage measurement. As -5
the alternating current is passed through the electrodes, ɸ (deg)
 -10
contact impedance and electrode polarization gets added to y = -2E-05x + 0.0116
the sample measurement which can lead to an over- -15 R² = 0.9993
estimation of tissue impedance [27]. While slightly more -20
complex, the benefit of a four-electrode system is that
 -25
measuring voltage with a very high input impedance 1.0E+02 1.0E+03 1.0E+04 1.0E+05 1.0E+06
prevents the flow of current in the sense electrodes [27].
Measurements in this study were performed using four- Frequency (Hz)
electrode testing arranged so that one pair of electrodes
(outer electrodes) was used for current injection and another (b)
pair of electrodes (inner electrodes) was used for voltage
 Fig. 3. Validation of measurement system with known resistor
measurement (see Fig. 2). This eliminates the electrode values. (a) Modulus values of a control 10 kΩ resistor. (b) Phase angle
polarization impedance and allows the four-electrode values of a control 10 kΩ resistor. Phase angle measurements exhibit
system to perform more accurate measurements than two- linear dependency on frequency with slope -2E-5.
electrode systems. All impedance measurements were
 All subsequent measurements were adjusted accordingly to
obtained with a frequency sweep from 100 Hz to 1 MHz
 account for this phase angle frequency dependence.
through fifty points, logarithmically. After each sweep, the
measurements were exported as a data file. The data files In Vivo Porcine Testing
were then exported and compiled into Excel using a custom For the in vivo porcine tissue testing, a total of seven live pigs
MATLAB program. were used for impedance measurements. Healthy young
 The impedance measurement system was validated domestic female pigs with weights ranging between 30-40 kg
against multiple known resistors. The modulus and phase
 were utilized for testing. The pigs were sedated, intubated,
angle values obtained from a standard 10 kΩ resistor are
 and all animal procedures were conducted under a protocol
depicted above in Fig. 3a and 3b. The modulus measure-
 approved by the Institutional Animal Care and Use
ments show good accuracy with
Chiang et al.: Electrical impedance characterization of in vivo porcine tissue. J Electr Bioimp, 12, 26-33, 2021

 machine learning tool. The resistance and reactance values
 for every tissue measurement were extracted from the data
 at seven frequencies: 145, 1400 11000, 49400, 184000,
 570000, 1000000 for a total of fourteen parameters. The
 frequencies were arbitrarily chosen along a logarithmic scale
 based on previous experimental results to preserve the
 overall shape of the curve while also decreasing the
 processing burden. The models were run with 10-fold
 random cross-validation. Four methods were used to classify
 the data; these included (a) Decision Trees, (b) Support
 Vector Machines (SVM), (c) K-Nearest Neighbor Classifiers
 (KNN), and (d) Ensemble Classifiers. Each model was run ten
 times and the average accuracy and standard deviation was
 computed for each method and its associated classifier
 types. This was done to determine which method provided
 (a) (b) the most accurate characterization.
 Fig. 4. Electrode placement. (a) is the electrode array that is Details of the machine learning methods used in this
 described in section IIA, and shown in Fig. 2. Four total electrodes study are available in detail from the MATLAB machine
 are used. The top and bottom white electrodes are H_CUR and
 learning toolbox documentation [29], but are summarized
 L_CUR and are connected to ground electrodes, while the center
 yellow electrodes are H_POT and L_POT, the sense electrodes. (b) here. Decision trees work by following the decisions in the
 The electrode array is manually applied to the tissue for tree from the root (starting) node as it splits down to a leaf
 measurements. node containing the response. Classifier types include
gastrointestinal tract, unlike humans, they have a larger and coarse, medium, and fine which are determined by the
more developed cecum and the colon is arranged in a spiral maximum number of splits used (4, 20, and 100
structure [28]. The spiral colon was mobilized and respectively). As the number of splits increase, the likelihood
attachments to itself were taken down to expose the colon of overfitting also increases. A fine tree with many leaves
for testing. The array strip (Fig. 4a) was manually placed
against the tissue by an assistant ensuring that all four 160 colon
electrodes were in contact (Fig. 4b). The area of tissue 140 stomach
examined by the electrode array is approximately 2 cm 2. 120 liver
 -Reactance (ohms)

 100 sb
Impedance measurements were then obtained along
 80 lung
different areas of the target tissue. The small bowel was then
 60
tested, followed by the liver. The attachments along the
 40
greater curve of the stomach were then taken down to 20
mobilize the stomach for testing, making sure to maintain 0
blood supply via the greater epiploic artery. Once all the -20 0 200 400 600 800 1000
intra-abdominal organs had been evaluated, a right -40 Resistance (ohms)
thoracotomy was performed if feasible to provide exposure (a)
for lung testing. Due to a combination of lab availability
 20 Stomach
constraints and animal instability, a thoracotomy was
 Antrum
performed in only three pigs. 15
 Body
 -Reactance (ohms)

 Across all seven pigs, a total of 106 impedance
 10 Fundus
measurements were taken on the stomach. Of these
measurements, 16 were clearly designated on the antrum, 5
20 on the body, and 14 on the fundus, while the remaining 0
56 measurements were broadly labeled as stomach without 50 70 90 110 130 150 170
 -5
further delineation. There were 121 unique measurements
on the colon, 82 on the liver, and 108 on the small bowel. -10
 Resistance (ohms)
Lung measurements were only able to be performed on
 (b)
three different pigs for a total of 33 measurements.
 Fig. 5. Nyquist plots for EIS measurements. (a) Comparison
Machine Learning between all measured tissue types: colon, liver, small bowel, lung,
 and aggregate stomach. (b) Comparison between just stomach
The validity of utilizing impedance for tissue differentiation segments (fundus, body, antrum) and all stomach data taken as
was evaluated using the MATLAB classification learner an aggregate.

 29
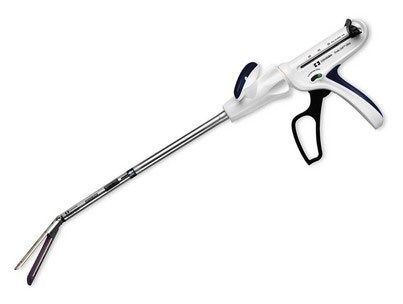
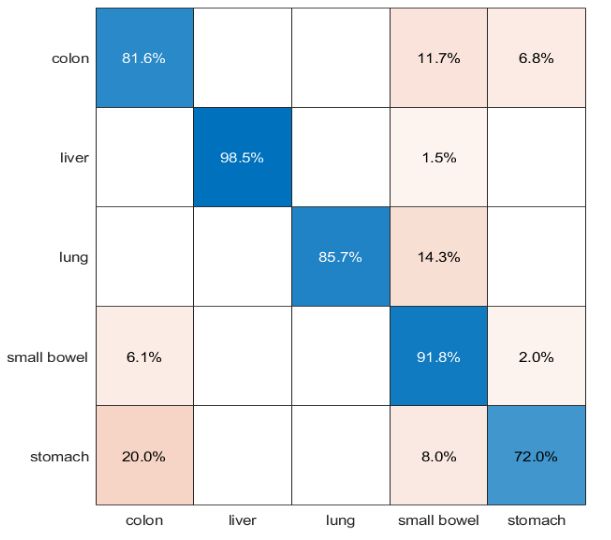
Chiang et al.: Electrical impedance characterization of in vivo porcine tissue. J Electr Bioimp, 12, 26-33, 2021

 Stomach segmented Stomach combined GI combined
 Tree 77.70 ± 1.50 (medium) 81.98 ± 0.61 (coarse) 98.89 ± 0.28 (all equal)
 SVM 86.96 ± 0.67 (cubic) 88.03 ± 0.84 (cubic) 99.67 ± 0.09 (med. Gaussian)
 KNN 81.91 ± 0.61 (weighted) 85.48 ± 0.94 (fine) 99.79 ± 0.14 (fine)
 Ensemble 82.47 ± 1.24 (subspace KNN) 83.72 ± 0.95 (subspace KNN) 98.83 ± 0.17 (subspace KNN)

 (a)

 (b) (c)

 Fig. 6. (a) Comparison of mean accuracy with standard deviations for the different machine learning classification methods, along with best
 performing subclass. Confusion matrix plots generated from a single 10 fold cross-validation run using the cubic support vector machine subclass
 with (b) stomach separated out into fundus, body, and antrum and (c) fundus, body, and antrum aggregated together as stomach prior to
 comparison to other tissues.

may be highly accurate on the training data but perform Ethical approval
poorly when tested on an independent data set. The research related to animal use complied with all the
 SVM classifies data by finding the hyperplane that relevant national regulations and institutional policies for the
optimizes the separation of data points between classes. The care and use of animals.
classifier type describes the shape of the hyperplane used to
separate the data points. The classifier types for this method Results
include linear, quadratic, cubic, and Gaussian which is A Nyquist plot is a common way to present impedance data
further separated into fine, medium, and coarse. The kernel where the real resistance portion of the impedance is
scale progressively decreases across the spectrum of coarse, plotted on the X-axis against the imaginary reactance portion
medium, and fine Gaussian classifiers. along the Y-axis. The average values of the aggregate data
 KNN works by categorizing a query point based on its were used to generate the Nyquist plot for each tissue and
distance to neighboring points in a training data set. The test the results are presented in Fig. 5a for all tissues. From this,
point is assigned the label which is most frequent based on it is clear that the liver and lung Nyquist curves have
either a distance metric or set number of neighbors. distinctly unique shapes, differentiating them from the
Classifier types tested include fine, medium, coarse with colon, stomach, and small bowel. The colon, stomach, and
increasing number of neighbors (1, 10, and 100, small bowel have similar shapes, however, their position
respectively). The classifiers set to 10 neighbors can be along the plot allows for differentiation.
further subdivided into cosine, cubic, and weighted based on During stomach impedance measurements, the specific
the structure of the distance metric. Nearest neighbor segment (fundus, body, antrum) was clearly delineated for
classifiers typically have good predictive accuracy in low about half of the measurements. The glandular architecture
dimensions but perform more poorly in higher dimensions. is different within the segments of the stomach and there is
 Ensemble classifiers combine more than one machine an increase in thickness progressing from the fundus to body
learning algorithm into a predictive model. The classifier to antrum [30]. Due to the differences in composition, the
types are named based on the methods combined and impedance measurements of each segment would also be
include boosted trees, bagged trees, subspace discriminant, expected to vary. The variation between different organs
subspace KNN, and RUSBoosted trees. was much larger than the difference between stomach
 segments. The Nyquist plots for each of the stomach
 segments is shown in Fig. 5b and can be compared to the
 aggregate stomach data. The shape of the stomach, antrum,
 30
Chiang et al.: Electrical impedance characterization of in vivo porcine tissue. J Electr Bioimp, 12, 26-33, 2021

fundus, and body plots are identical, but the antrum appears as anastomotic leaks. Lung tissue is uniquely challenging due
skewed to the right while the fundus is skewed to the left. to its heterogeneity. It is highly variable in the number of
The antrum is the thickest portion of the stomach while the solid elements such as bronchi and vasculature and elastic
fundus is thinner and floppier, and this may provide a elements such as alveoli [2]. These structural differences
physiological explanation for our observations. clearly differentiate lung tissue, and this was reflected in the
 There was a consistent change in character of the phase observed bioimpedance profile. The stomach segments,
angle at approximately 50 kHz for all tissue types. This may colon, and small bowel all shared similarly shaped Nyquist
be attributed to represent the shift between α and β curves and were positioned within the same vicinity on the
dispersion regions; however, prior work performed by plot. As a result, these tissues were commonly confused with
Strand-Amundsen et al. on the bioelectrical characterization each other during the ML classification. Within the segments
of in vivo porcine small bowel did not visualize the same shift of the stomach, the antrum was skewed in position
at 50 kHz [31]. Their group utilized a different impedance compared to the fundus while maintaining the overall shape
measurement system (Solartron). As this shift is maintained of the curve. It was difficult to differentiate the antrum from
throughout all tissue samples, the disparity is postulated to small bowel or colon, but it was never confused with the
be related to the testing setup. Veal et al. described how fundus. Identifying the various segments of stomach may
capacitance of the coaxial cables that connect the electrodes provide clinical benefit in gastric resections as differences in
to the circuit can provide a high frequency conduction path gastric wall thickness have been postulated as a cause for
to ground, so that some of the current that passes through staple line leaks [33]. The antrum, small bowel, and colon
the sample bypasses the electrometer producing inductive had comparable bioimpedance profiles which may be the
artifacts [32]. result of similar architecture. Small bowel and colorectal
 The data was parsed through the MATLAB classification tissue are much more uniform with similar stapling
learner three different ways: one where the stomach was techniques for both tissues; however, if we can correlate
segmented into body, fundus, antrum and compared to the tissue perfusion and tension with bioimpedance
small bowel, colon, liver, and lung; another where the characteristics, modifications to current techniques can be
stomach was taken as an aggregate; and finally, where the made to reduce anastomotic leaks.
stomach was combined with the small bowel and colon to A benefit of impedance sensors is that they are typically
define GI tract structures and compared to the liver and lung. lower profile compared to optical and mechanical sensors.
The mean accuracy and standard deviation along with the This allows for easier incorporation onto pre-existing surgical
best performing subclass after applying the four different instrumentation and stapling platforms. The electrode array
machine learning methods (decision trees, support vector strip used for this study was designed to provide flexibility
machines, nearest neighbor classifiers, and ensemble with electrode arrangements and had the added benefit of
classifiers) are presented in Fig. 6a. Support vector machines fitting along the jaws of a surgical stapler. One of the short-
yielded the best results with accuracy of 86.96% when the comings of bioimpedance is that measurements are highly
stomach was segmented and 88.03% when stomach was sensitive to both tissue inhomogeneity and electrode
taken as an aggregate. The antrum was the stomach contact. The spacing between the electrodes affects the
segment that was most the difficult to identify with an depth that the tissue is sampled, and further investigation
accuracy of only 25% (Fig. 6b). When the fundus, body, and remains to determine any discrepancies between superficial
antrum are aggregated together as “stomach,” the stomach and transverse tissue measurements. Measurements within
was the most frequently misclassified tissue, most often our study were obtained through manual application of the
mistaken for the colon at 20% (Fig. 6c). When the stomach electrodes to the tissue surface and significant variation was
was combined with colon and small bowel to define the GI seen between measurements even within the same tissue
tract, all the algorithms had accuracy >98%, but fine KNN type. The amount of force and electrode-tissue contact was
performed the best with 99.79% accuracy. not standardized and compounded the variation between
 measurements. Additionally, the effect of compression on
Discussion tissue impedance measurements remains poorly studied.
We recognize the limitation of this work due to the small Compression effects on impedance are different in ex vivo
dataset, but believe that the demonstration of this approach and in vivo settings, but the reason for this remains unclear
on actual tissue samples is important. Additionally, segment- [34]. Future work would focus on optimization of the testing
ation of the stomach divisions is limited compared to the setup to reduce contact variation as well as exploring the
small bowel and colon which have much larger surface areas effects of tissue thickness and compression.
for unique measurements. Future work is planned to test the
classification ability of our model for unknown tissue Conclusion
samples from different pigs. Tissue properties have a major The focus of this study was to explore how impedance can be
impact on stapling mechanics and technique. Suboptimal combined with ML to characterize different tissues. The
handling of tissue can increase the risk of complications such
 31
Chiang et al.: Electrical impedance characterization of in vivo porcine tissue. J Electr Bioimp, 12, 26-33, 2021

results from our in vivo testing have expanded on 7. Ruiz-Vargas A, Ivorra A, Arkwright JW. Design, Construction
bioimpedance characterization of multiple in vivo tissues and and Validation of an Electrical Impedance Probe with Contact
clearly demonstrate the capabilities of bioimpedance and ML Force and Temperature Sensors Suitable for in-vivo
 Measurements. Sci Rep. 2018;8(1):14818.
for classifying tissue. There were obvious bioelectric
 https://doi.org/10.1038/s41598-018-33221-4
differences observed between liver, lung, and gastro-
 8. Adler A, Boyle A. Electrical Impedance Tomography: Tissue
intestinal tissue with almost 100% classification accuracy
 Properties to Image Measures. IEEE Transactions on
across all machine learning algorithms. This work shows that
 Biomedical Engineering. 2017;64(11):2494-504.
impedance can be used to create a classification algorithm to https://doi.org/10.1109/TBME.2017.2728323
identify commonly stapled tissue such as colon, small bowel,
 9. Karande VC. LigaSure™ 5-mm Blunt Tip Laparoscopic
liver, stomach, and lung in vivo. With continued improve-
 Instrument. J Obstet Gynaecol India. 2015;65(5):350-2.
ment through additional data that improves training of the https://doi.org/10.1007/s13224-015-0745-2
ML tools, it can be possible to explore tissue compression
 10. Bera TK. Bioelectrical Impedance Methods for Noninvasive
effects and better control firing forces of surgical staplers Health Monitoring: A Review. J Med Eng. 2014;2014:381251.
depending on tissue type. https://doi.org/10.1155/2014/381251
 The feasibility of identifying tissue ischemia and 11. Martinsen OG, Grimnes SG, Schwan HP. Interface phenomena
malignancy has been proven repeatedly, but typically limited and dielectric properties of biological tissue. Encycl Surf
to a single tissue type, so next steps in this work would be to Colloid Sci. 2002:2643-52.
optimize the data collection and explore the feasibility of 12. Ramírez-Chavarría RG, Sánchez-Pérez C, Matatagui D, Qureshi
differentiating tissue states (healthy, ischemic, and N, Pérez-García A, Hernández-Ruíz J. Ex-vivo biological tissue
malignant) using ML. Also, in vivo disease state, particularly differentiation by the Distribution of Relaxation Times method
for human tissues, remains limited. With more data applied to Electrical Impedance Spectroscopy. Electrochimica
collection, we can then develop tissue specific firing Acta. 2018;276:214-22.
algorithms to optimize the stapling process such as site https://doi.org/10.1016/j.electacta.2018.04.167
selection, staple height, and firing speed to improve surgical 13. Gregory WD, Marx JJ, Gregory CW, Mikkelson WM, Tjoe JA,
outcomes. Shell J. The Cole relaxation frequency as a parameter to
 identify cancer in breast tissue. Medical Physics. 2012;39(7
 Part1):4167-74. https://doi.org/10.1118/1.4725172
Conflict of interest
Authors state no conflict of interest. 14. Halter RJ, Hartov A, Heaney JA, Paulsen KD, Schned AR.
 Electrical Impedance Spectroscopy of the Human Prostate.
 IEEE Transactions on Biomedical Engineering.
References
 2007;54(7):1321-7.
1. Susmallian S GD, Barnea R, Raziel A. Correct Evaluation of
 https://doi.org/10.1109/TBME.2007.897331
 Gastric Wall Thickness May Support a Change in Staplers Size
 When Performing Sleeve Gastrectomy. The Israel Medical 15. Laufer S, Ivorra A, Reuter VE, Rubinsky B, Solomon SB.
 Association Journal: IMAJ. 2017;19:351-4. Electrical impedance characterization of normal and cancerous
 https://doi.org/10.1016/j.clnesp.2017.02.002 human hepatic tissue. Physiological Measurement.
 2010;31(7):995-1009.
2. Chekan E, Whelan RL. Surgical stapling device-tissue
 https://doi.org/10.1088/0967-3334/31/7/009
 interactions: what surgeons need to know to improve patient
 outcomes. Med Devices (Auckl). 2014;7:305-18. 16. Dzwonczyk R, Rio Cd, Brown DA, Michler RE, Wolf RK, Howie
 https://doi.org/10.2147/MDER.S67338 MB. Myocardial electrical impedance responds to ischemia
 and reperfusion in humans. IEEE Transactions on Biomedical
3. Eriksson S, Nilsson J, Sturesson C. Non-invasive imaging of
 Engineering. 2004;51(12):2206-9.
 microcirculation: a technology review. Med Devices (Auckl).
 https://doi.org/10.1109/TBME.2004.834297
 2014;7:445-52. https://doi.org/10.2147/MDER.S51426
 17. Yang L, Zhang G, Song J, Dai M, Xu C, Dong X, et al. Ex-Vivo
4. Baker RS, Foote J, Kemmeter P, Brady R, Vroegop T, Serveld M.
 Characterization of Bioimpedance Spectroscopy of Normal,
 The Science of Stapling and Leaks. Obesity Surgery.
 Ischemic and Hemorrhagic Rabbit Brain Tissue at Frequencies
 2004;14(10):1290-8.
 from 10 Hz to 1 MHz. Sensors (Basel). 2016;16(11):1942.
 https://doi.org/10.1381/0960892042583888
 https://doi.org/10.3390/s16111942
5. Cheng Z, Dall'Alba D, Foti S, Mariani A, Chupin T, Caldwell DG,
 18. Dai Y, Du J, Yang Q, Zhang J. Noninvasive electrical impedance
 et al. Design and Integration of Electrical Bio-impedance
 sensor for in vivo tissue discrimination at radio frequencies.
 Sensing in Surgical Robotic Tools for Tissue Identification and
 Bioelectromagnetics. 2014;35(6):385-95.
 Display. Front Robot AI. 2019;6:55.
 https://doi.org/10.1002/bem.21854
 https://doi.org/10.3389/frobt.2019.00055
 19. Cole K, Curtis H. Electrical physiology: Electrical resistance and
6. Rigaud B, Hamzaoui L, Frikha MR, Chauveau N, Morucci JP. In
 impedance of cells and tissues, in Medical Physics. New York:
 vitro tissue characterization and modelling using electrical
 Year Book Publishers; 1944.
 impedance measurements in the 100 Hz-10 MHz frequency
 range. Physiological Measurement. 1995;16(3A):A15-A28.
 https://doi.org/10.1088/0967-3334/16/3A/002
 32
Chiang et al.: Electrical impedance characterization of in vivo porcine tissue. J Electr Bioimp, 12, 26-33, 2021

20. Gholami-Boroujeny S, Bolic M. Extraction of Cole parameters 28. Gonzalez LM, Moeser AJ, Blikslager AT. Porcine models of
 from the electrical bioimpedance spectrum using stochastic digestive disease: the future of large animal translational
 optimization algorithms. Med Biol Eng Comput. research. Transl Res. 2015;166(1):12-27.
 2016;54(4):643-51. https://doi.org/10.1016/j.trsl.2015.01.004
 https://doi.org/10.1007/s11517-015-1355-y 29. MathWorks. Machine Learning Toolbox [Available from:
21. Seoane F, Buendia R, Gil-Pita R. Cole parameter estimation https://www.mathworks.com/help/stats/choose-a-
 from electrical bioconductance spectroscopy measurements. classifier.html#bunt0ky.
 Annu Int Conf IEEE Eng Med Biol Soc. 2010;2010:3495-8. 30. Rawlins L, Rawlins MP, Teel D. Human tissue thickness
 https://doi.org/10.1109/IEMBS.2010.5627790 measurements from excised sleeve gastrectomy specimens.
22. Ayllon D, Seoane F, Gil-Pita R. Cole equation and parameter Surgical Endoscopy. 2014;28(3):811-4.
 estimation from electrical bioimpedance spectroscopy https://doi.org/10.1007/s00464-013-3264-1
 measurements - A comparative study. Annu Int Conf IEEE Eng 31. Strand-Amundsen RJ, Tronstad C, Kalvøy H, Gundersen Y,
 Med Biol Soc. 2009;2009:3779-82. Krohn CD, Aasen AO, et al. In vivocharacterization of ischemic
 https://doi.org/10.1109/IEMBS.2009.5334494 small intestine using bioimpedance measurements.
23. Bowen PK, Shearier ER, Zhao S, Guillory RJ, 2nd, Zhao F, Physiological Measurement. 2016;37(2):257-75.
 Goldman J, et al. Biodegradable Metals for Cardiovascular https://doi.org/10.1088/0967-3334/37/2/257
 Stents: from Clinical Concerns to Recent Zn-Alloys. Advanced 32. Veal B, Baldo P, Paulikas A, Eastman J. Understanding Artifacts
 healthcare materials. 2016;5(10):1121-40. in Impedance Spectroscopy. Journal of the Electrochemical
 https://doi.org/10.1002/adhm.201501019 Society. 2015;162:H47-H57.
24. Schmidt J, Marques MRG, Botti S, Marques MAL. Recent https://doi.org/10.1149/2.0791501jes
 advances and applications of machine learning in solid-state 33. Barski K, Binda A, Kudlicka E, Jaworski P, Tarnowski W. Gastric
 materials science. npj Computational Materials. 2019;5(1):83. wall thickness and stapling in laparoscopic sleeve gastrectomy
 https://doi.org/10.1038/s41524-019-0221-0 - a literature review. Wideochir Inne Tech Maloinwazyjne.
25. Kalvoy H, Tronstad C, Ullensvang K, Steinfeldt T, Sauter AR. 2018;13(1):122-7. https://doi.org/10.5114/wiitm.2018.73362
 Detection of needle to nerve contact based on electric 34. Moqadam S, Grewal P, Shokoufi M, Golnaraghi M.
 bioimpedance and machine learning methods. Conf Proc IEEE Compression-dependency of soft tissue bioimpedance for in-
 Eng Med Biol Soc. 2017;2017:9-12. vivo and in-vitro tissue testing. Journal of Electrical
 https://doi.org/10.1109/EMBC.2017.8036750 Bioimpedance. 2015;6:22-32.
26. Strand-Amundsen RJ, Tronstad C, Reims HM, Reinholt FP, https://doi.org/10.5617/jeb.1489
 Høgetveit JO, Tønnessen TI. Machine learning for
 intraoperative prediction of viability in ischemic small
 intestine. Physiological Measurement. 2018;39(10):105011.
 https://doi.org/10.1088/1361-6579/aae0ea
27. Chowdhury A, Ghoshal D, Bera T, Chakraborty B, Naresh M.
 Comparison of two and four electrode methods for studying
 the impedance variation during cucumber storage using
 Electrical Impedance Spectroscopy (EIS). 2017. p. 261-5.
 https://doi.org/10.1201/9781315400624-50

 33
You can also read