The factors associated with distress following exposure to smoke from an extended coal mine fire
←
→
Page content transcription
If your browser does not render page correctly, please read the page content below
The factors associated with distress
following exposure to smoke from an
extended coal mine fire
Jonathan C. Brodera, Caroline Gaoa,b, Timothy C. H. Campbellc, Emily Bergerd, Darryl Mayberye,
Alexander McFarlanef, Jessica Tsoutsoulise, Jillian Ikina, Michael J. Abramsona, Malcolm R. Sima, Judi
Walkerc, Ashok Luharg, Matthew Carrollc

Affiliations
a
  Department of Epidemiology and Preventive Medicine, School of Public Health and Preventive Medicine,
Monash University, 553 ST Kilda Road, Melbourne, Victoria, 3004, Australia
b
  Orygen, Centre for Youth Mental Health, The University of Melbourne, Parkville, VIC, Australia
c
  Monash Rural Health Churchill, Monash University, Northways Road, Churchill, Victoria, 3842, Australia
d
  Faculty of Education, Monash University, 29 Ancora Imparo Way, Clayton, Victoria, 3800, Australia
e
  Monash Rural Health, Monash University, 15 Sargeant Street, Warragul, Victoria, 3820, Australia
f
  Centre for Traumatic Stress Studies, The University of Adelaide, 30 Frome Road, South Australia, 5005,
Australia
g
  Aerosol and Chemistry Modelling, Climate Science Centre, CSIRO Oceans and Atmosphere, 107-121
Station Street, Aspendale, Victoria, 3195, Australia

Corresponding Author
Dr Matthew Carroll
Monash Rural Health Churchill, Monash University, C/- Federation University, Northways Road, Churchill,
Victoria, Australia
Telephone: 61 3 5122 7604
Fax: 61 3 5122 7841
Email: matthew.carroll@monash.edu

Note
This is the final accepted version of a paper which has been published by Environmental Pollution. The full
citation for the published paper is as follows:

Broder, J. C., Gao, C. X., Campbell, T. C. H., Berger, E., Maybery, D., McFarlane, A., Tsoutsoulis, J., Ikin, J. F.,
Abramson, M. J., Sim, M. R., Walker, J., A, L., & Carroll, M. (2020). The factors associated with distress
following exposure to smoke from an extended coal mine fire. Environmental Pollution, 266, part 2,
November 2020, 115131. https://doi.org/10.1016/j.envpol.2020.115131

                                                                                                         Page 1 of 23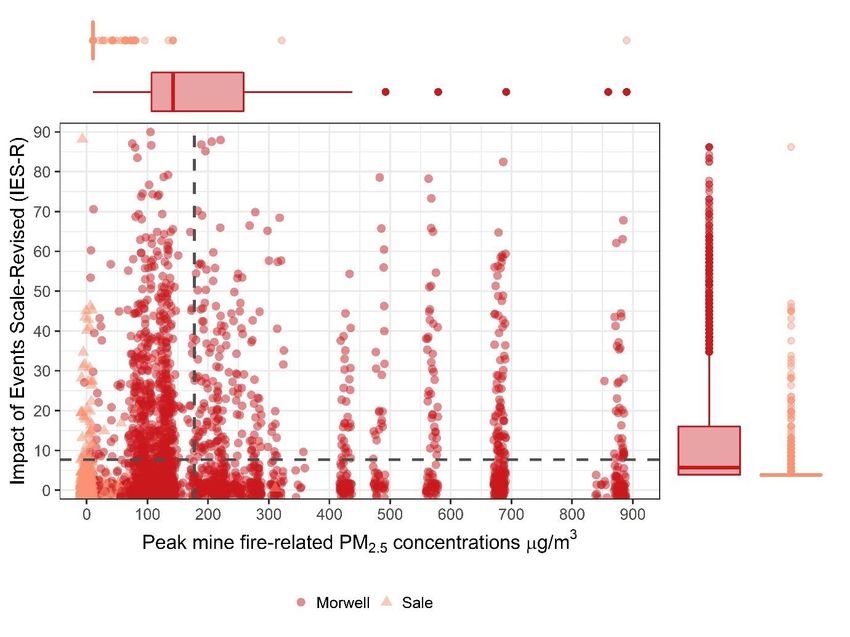
Abstract
In February 2014, the coalmine adjacent to the Hazelwood Power Station in the Latrobe Valley of Victoria,
Australia, caught fire, with residents from the nearby town of Morwell and the wider area exposed to
smoke for six weeks. Although there was evidence linking the mine-fire event with psychological distress,
no studies have evaluated the degree of distress in relation to the level of smoke exposure. We aimed to
investigate the exposure-response relationship between particulate matter 2.5μm or less in diameter
(PM2.5) released during the Hazelwood mine fire event and long-term symptoms of posttraumatic distress
in the affected community, including the consideration of other key factors. A total of 3,096 Morwell
residents, and 960 residents from the largely unexposed comparison community of Sale, were assessed for
symptoms of posttraumatic distress 2.5 years after the Hazelwood incident using the Impact of Events
Scale-Revised (IES-R). Individual-level PM2.5 exposure was estimated by mapping participants’ self-reported
location data on modelled PM2.5 concentrations related to the mine fire. Multivariate linear regression was
used to evaluate the exposure-response relationship. Both mean and peak exposure to mine fire-related
PM2.5 were found to be associated with participant IES-R scores with an interaction effect between age and
mean PM2.5 exposure also identified. Each 10 µg/m3 increase in mean PM2.5 exposure corresponded to a
0.98 increase in IES-R score (95% CI: 0.36 to 1.61), and each 100 µg/m3 increase in peak PM2.5 exposure
corresponded to a 0.36 increase (95% CI: 0.06 to 0.67). An age-effect was observed, with the exposure-
response association found to be stronger for younger adults. The results suggest that increased exposure
to PM2.5 emissions from the Hazelwood mine fire event was associated with higher levels of psychological
distress associated with the mine fire and the most pronounced effect was on younger adults living in the
affected community.

Main findings:

There is an exposure-response relationship between Pm2.5 released from the Hazelwood mine fire event
and long-term psychological distress towards the event. The exposure-response relationship is more
pronounced in younger adults than older adults.

Keywords:

Posttraumatic Distress; Mine Fire; Air Pollution; PM2.5 Exposure; Cross-Sectional Study

                                                                                                Page 2 of 23
Introduction
During February 2014, the open-cut coalmine adjacent to the Hazelwood Power Station in the Latrobe
Valley region of Victoria, Australia caught fire due to nearby wildfires. The resulting Hazelwood mine fire
burnt for approximately six weeks, releasing smoke into the air of the surrounding areas, particularly the
adjacent town of Morwell (see Figure 1 for map). During the mine fire event, the estimated hourly averaged
concentrations of fine particulate matter 2.5μm or less in diameter (PM2.5) was as high as 3700 g m3 in
Morwell, which was well above the estimated average background PM2.5 concentrations of 6 µg/m3 for the
town (Emmerson, Reisen, Luhar, Williamson, & Cope, 2016). Residents of the Latrobe Valley initially
expressed their concern about the effects of the coalmine fire on their physical health (Wood et al., 2015),
with a number of individuals reporting non-specific symptoms such as headaches, nausea and dizziness, as
well as psychological distress towards the event. Consequent to the mine fire, the Hazelwood Health Study
(HHS; hazelwoodhealthstudy.org.au) was established to investigate the long-term impact of the mine fire
smoke on the health and wellbeing of nearby communities.
Smoke released from coalmine fires is composed of many pollutants, including particulate matter and
carbon monoxide, which are hazardous to human health (Melody & Johnston, 2015). In the context of
psychological health, exposure to PM2.5 has been associated with an increased risk of both general and
phobia-related anxiety (Power et al., 2015), depression (Kioumourtzoglou et al., 2017; Ren, Yu, & Yang,
2019), and general psychological distress (Gu, Yan, Elahi, & Cao, 2020; Sass et al., 2017) regardless of the
individual’s awareness of their exposure. However, to date, very limited research has investigated the
impact of exposure to smoke emanating from coalmine fires on psychological health (Jones, Lee, Maybery,
& McFarlane, 2018; Maybery et al., 2020).
The Centralia coalmine fire in Pennsylvania, USA, has been burning since at least 1962, and is reported to
have resulted in elevated distress and mental instability in members of that community (Kroll-Smith, 1990).
Earlier qualitative research undertaken by the HHS (Jones et al., 2018) found that residents in Morwell had
experienced uncertainty and ambivalence during the prolonged Hazelwood mine fire event, which was
likely to have had an adverse impact on their psychological health. In a larger, epidemiological study, the
HHS compared the psychological health of individuals from Morwell with a control-group of residents from
the relatively unexposed, but otherwise demographically similar, town of Sale (Maybery et al., 2020). The
researchers found that, more than two years after the Hazelwood mine fire event, Morwell residents
experienced significantly more distress specifically related to the incident (also known as posttraumatic
distress or event-related distress) than Sale residents. However, no research to date has established an
exposure-response relationship between the level of exposure to mine fire smoke and the degree of
posttraumatic distress.
The current research aimed to investigate the effects of varying levels of exposure to PM2.5 released from
the Hazelwood mine fire event on the development of long-term symptoms of posttraumatic distress, as
well as the contribution of other known risk factors such as age, prior mental health and traumatic
exposures, and chronic respiratory and cardiovascular conditions. Based on the observed relationship
between PM2.5 exposure and psychopathology (Gu et al., 2020; Kioumourtzoglou et al., 2017; Power et al.,
2015; Ren et al., 2019; Sass et al., 2017), and existing evidence of the psychological impact of mine fire
disasters (Jones et al., 2018; Kroll-Smith, 1990; Maybery et al., 2020), we hypothesised that a positive
exposure-response relationship would be observed between levels of PM2.5 exposure and symptoms of
posttraumatic distress. Morwell residents were also compared to residents from Sale to assess for any
impact of residing in Morwell at the time of the event over and above the distress attributable to PM2.5
exposure. Furthermore, we hypothesised that other factors, such as age, and prior health trajectories,
would impact on the relationship between PM2.5 and event-related distress.
Page 3 of 23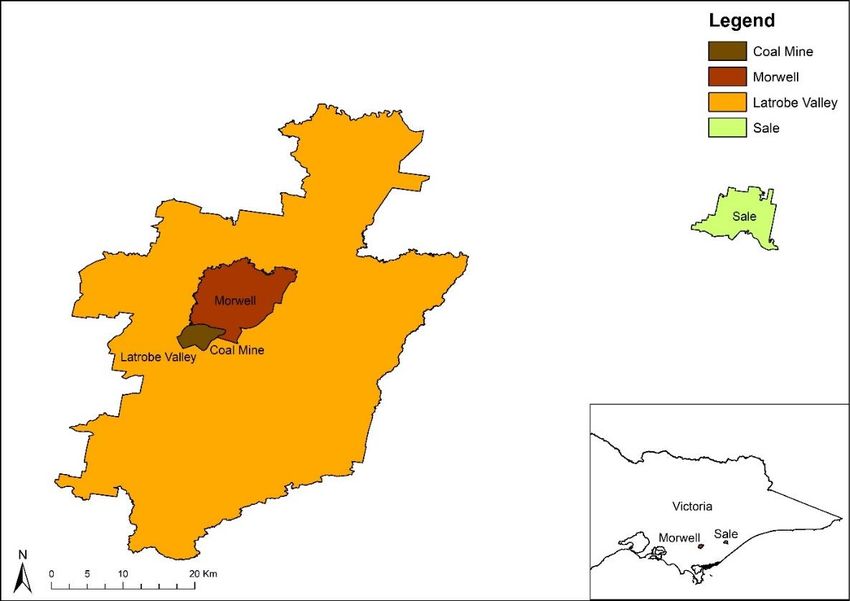
Methods
Study design
The current research is part of the HHS Adult Survey, which is a cross-sectional study that aimed to assess
the health effects of the Hazelwood mine fire event on a sample of Morwell adults in comparison to adults
from targeted areas of Sale. The comparison community was selected on the basis of having had negligible
exposure to the smoke from the Hazelwood coal mine fire (Emmerson et al., 2016), an adequate population
size, and being closely matched to the sociodemographic profile of Morwell in terms of SEIFA rankings
(Australian Bureau of Statistics, 2012). In order to maximise comparability, only people living in one of the
16 ABS Statistical Areas level 1 (SA1s) of Sale with the lowest SEIFA scores were invited to participate. In
Sale, the hourly averaged PM2.5 concentrations during the mine fire event only reached a maximum of 17
µg/m3, and the estimated background PM2.5 concentrations were similar to that of Morwell (approximately
6 µg/m3).

A total of 13,892 residents were identified from the electoral roll maintained by the Victorian Electoral
Commission as eligible for inclusion in the study. To be eligible for the study, participants had to be 18 years
or older on the 31st of March 2014. 3,096 Morwell residents and 960 Sale residents were recruited for the
Adult Survey, reflecting participation rates of 34% and 23% respectively. The Adult Survey, which
commenced in May 2016 and concluded in mid-February 2017, collected information on participants’
characteristics, including sociodemographic details, physical and mental health diagnoses, prior traumatic
experiences, and psychological distress related to the mine fire event. Participant recruitment in the HHS
Adult Survey included direct contact methods such as mailed invitations, reminder-packs and follow up
phone calls, as well as indirect methods such as flyers, media engagement and public events (see Abramson
et al. (2017) for additional details about the HHS Adult Survey).

The current research used data from the Adult Survey as well as data on participants’ estimated PM2.5
exposure during the mine fire event. Furthermore, the current analysis considered the role of other
variables on the exposure-response relationship, such as age, prior mental health, prior traumatic
exposures, and chronic health conditions.

Measures
Data was collected primarily by self-report questionnaire.

The Impact of Events Scale-Revised

The psychological outcome measure was the Impact of Events Scale-Revised (IES-R) (Weiss & Marmar,
1997), which measured the participant’s subjective psychological distress specifically in relation to the
Hazelwood mine fire incident. The IES-R is composed of 22 items scored on a 0-4 scale (0 = Not at all; 1 = A
little bit; 2 = Moderately; 3 = Quite a bit; 4 = Extremely). These items are grouped into three subscales
(Intrusion, Avoidance and Hyperarousal) relating to 14 of the 17 symptoms of PTSD from the Diagnostic and
Statistical Manual of Mental Disorders, 4th Edition. The present study used participant’s total score on the
IES-R (range: 0-88).

Mine fire exposure

High resolution, hourly mine fire-related PM2.5 concentrations were modelled retrospectively by the
Commonwealth Scientific and Industrial Research Organisation (CSIRO) Oceans and Atmosphere Flagship
(Emmerson et al., 2016). The modelled mine fire-related PM2.5 concentrations were then mapped to each
participants’ self-reported 12-hourly location diary of their residential, work or relocation addresses during
the mine fire event (9th February 2014 to 31st March 2014). The mean exposure to PM2.5 was derived by
averaging each participant’s 12-hourly exposure based on their location diary, thus reflecting the
participant’s mean PM2.5 exposure throughout the entire mine fire period. The peak exposure to PM2.5 was

                                                                                                    Page 4 of 23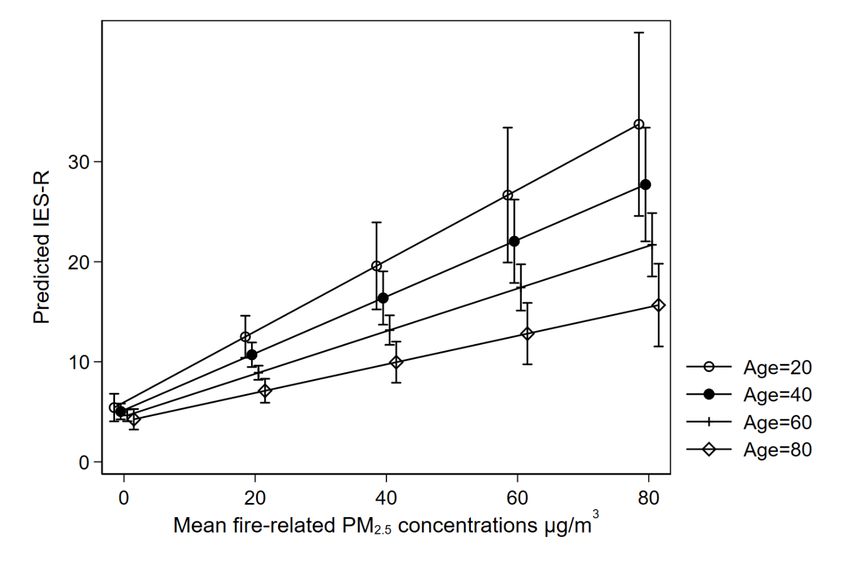
determined as the highest 12-hourly concentration value to which a participant was exposed at any of the
diary addresses, regardless of the amount of time the individual was exposed. For simplicity, mean
exposure to PM2.5 over the mine fire period will be referred to as ‘mean’ PM2.5 exposure, while the
participant’s peak PM2.5 exposure will simply be referred to as ‘peak’ PM2.5 exposure. See Blackman et al.
(2018) for more details about the PM2.5 exposure estimation.

Prior traumatic exposures

To capture participants’ exposure to prior traumatic experiences, a list of 11 traumatic exposures from the
posttraumatic distress disorder (PTSD) module of the Composite International Diagnostic Interview (CIDI)
Version 2.1 (Goldney, Wilson, Dal Grande, Fisher, & McFarlane, 2000) was used. The list of traumatic
experiences included physical attack, rape, life-threatening accidents, and other extremely stressful events
experienced by the participant or close associates. The number of prior traumatic exposures each
participant reported was tallied and then categorised as: (1) no traumatic events, (2) one traumatic event,
or (3) multiple traumatic events.

Self-reported doctor-diagnosed conditions

Participants self-reported doctor-diagnosed cardiovascular conditions (heart attack, heart failure, angina,
irregular heart rhythm, stroke or other heart disease), respiratory conditions (asthma and chronic
obstructive pulmonary disease [COPD]), and mental health conditions (anxiety, depression, posttraumatic
stress disorder, or other mental health conditions) along with year first diagnosed. These medical
conditions were classified as categorical variables with three levels: (1) no condition; (2) prior to the mine
fire (first diagnosed in 2013 or earlier) and (3) post mine fire (first diagnosed in 2014 or later).

Binge drinking

Binge drinking (heavy episodic drinking) was assessed using the binge drinking item from the Alcohol Use
Disorders Identification Test (AUDIT C) (Bush, Kivlahan, McDonell, Fihn, & Bradley, 1998). The binge
drinking item was utilised to measure how frequently participants consumed more than six standard drinks
on a single occasion, ranging from 0 (Never) to 5 (Daily or almost daily) (Foxcroft, Moreira, Almeida
Santimano, & Smith, 2015).

Occupational exposure

Participants were asked to report any job that they had held for 6 months or more that involved exposure
to fumes, dust, smoke, mist or gas vapour, including whether they had worked in the Latrobe Valley coal
mines or power stations (excluding office-based jobs) for at least 6 months. Based on this information,
participants were determined as either being occupationally exposed at a coal mine or power station,
occupationally exposed but not at a coal mine or power station, or not occupationally exposed.

Ethics approval
The protocol for the research was approved by the Monash University Human Research Ethics Committee
(MUHREC) for the period 21 May 2015 to 21 May 2020 (MUHREC Project number CF15/872). All
participants provided informed consent.

Statistical analysis
A total of 4,056 Adult Survey participants from both Morwell and Sale were included in these analyses.
Possible response biases were evaluated based on 2011 Census data (Australian Bureau of Statistics, 2012)
and Victorian Population Health Survey 2011-12 data (Department of Health, 2014), and post-stratification
weighting by gender and age group (5 years) were applied. Missing data, which ranged from 0-5.79% for

                                                                                                    Page 5 of 23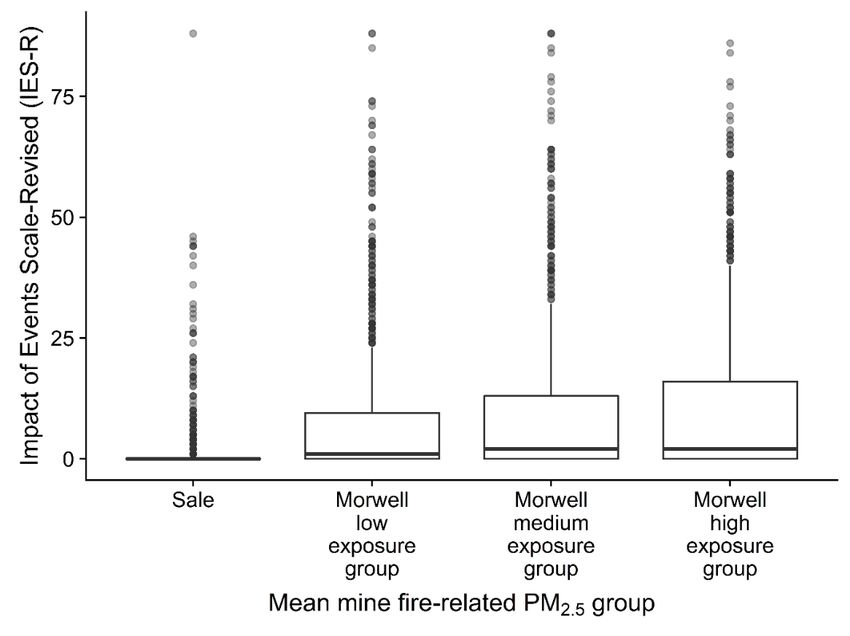
the Adult Survey data (for the questions included in the analysis) and 0% for the PM2.5 data, were handled
using multiple imputation (Rubin, 1996) by chained equations, using the ICE package under Stata MI
procedures (Royston & White, 2011).

Descriptive statistics were calculated for Sale (as the no exposure comparison community) and low,
medium and high exposure groups in Morwell based on mean PM2.5 exposure tertiles (of Morwell residents
only). Categorical variables were presented as counts and percentages, while numeric variables were
represented as means and standard deviations, or medians and inter-quartile ranges (IQR) for the IES-R, as
the score distribution was heavily skewed for this measure. Crude differences in characteristics between
low, medium and high exposure groups in Morwell and Sale participants were compared using Pearson chi-
squared tests for categorical variables and t-tests for numeric variables. The skewed IES-R was analysed
with the nonparametric Somers’ D statistic (Newson, 2006).

The relationships between IES-R and mean and peak exposure to PM2.5 were assessed using two separate
multivariate linear regression analysis models. To improve the interpretability of the results, mean and
peak PM2.5 were scaled per 10 µg/m3 and 100 µg/m3, respectively. All models accounted for post-
stratification weights and clustering at the household level (Blackman et al., 2018). The participant
characteristics, age, sex, employment, education, prior mental health conditions, prior traumatic
exposures, asthma, COPD, cardiac events, frequency of binge drinking (6 or more standard drinks in one
occasion), and occupational exposure were accounted for in the models as potentially confounding
variables. We included the participant township variable (Morwell vs. Sale) in the regression models to
evaluate the township effect when controlling for exposure level. This provides useful information
regarding whether Morwell participants experienced any event-related distress in the absence of exposure
to the mine fire smoke, as some Morwell residents (e.g. those who moved during the mine fire event)
would have had little to no PM2.5 exposure. Interaction effects between the confounding variables and
mean and peak exposure to PM2.5 were then evaluated. Sensitivity analysis was also performed by
removing Sale from the model, as well as analysing a natural log transformed IES-R (+1, as there were 0
values).

Due to the inclusion of an interaction effect between age and mean and peak PM2.5 exposure in the
regression models, age was centred at the mean (57 years), and mean and peak PM2.5 were centred at the
10 µg/m3 and 100 µg/m3, respectively. This allowed for main effect estimates of mean and peak PM2.5 on
IES-R scores at the mean age of the cohort, as well as main effect estimates of age on IES-R scores at 10
µg/m3 and 100 µg/m3 for mean and peak PM2.5, respectively. Predictive marginal plots were made using
marginal estimates for every 20 µg/m3 of mean PM2.5 exposure (from 0 to 80 µg/m3) and at ages 20, 40, 60
and 80 years, with other predictors at the mean value (for continuous variables) or the reference category
(for categorical variables). All analyses were conducted using Stata version 15 (StataCorp, 2017).

Results
Participants’ characteristics
Table 1 presents the characteristics of Morwell exposure groupsError! Reference source not found. and
Sale participants. Participants from the Morwell exposure groups and Sale were broadly comparable on
age, gender, presence of prior mental health conditions, number of traumatic exposures, and proportions
with cardiovascular disease and binge drinking behaviour. However, compared with Sale participants, those
from Morwell were more likely to have a lower level of education and to be unemployed or unable to work,
with little differences observed between each Morwell exposure group. A higher proportion of Morwell
participants had coal mine/station occupational exposure and self-reported diagnoses of asthma or COPD
(both pre- and post-fire). Within Morwell exposure groups, there were also no obvious differences in
occupational exposure, asthma and COPD. IES-R scores were observed to be higher on average in the
higher exposure groups.

                                                                                                 Page 6 of 23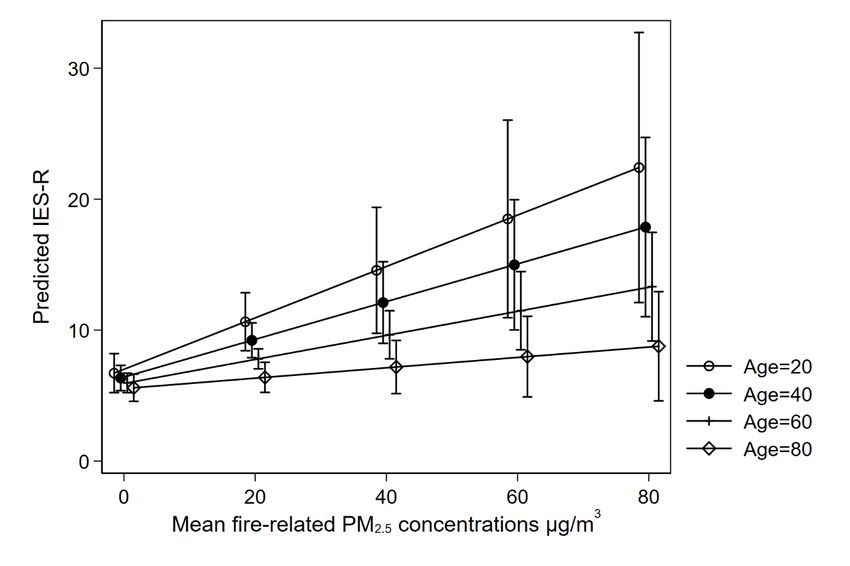
Figure 2 illustrates the distributions of IES-R scores for Sale compared to low, medium and high exposure
groups in Morwell. Peak PM2.5 exposure was higher in the higher exposure groups, reflecting the correlation
between mean and peak PM2.5 exposure. The relationship between IES-R scores and PM2.5 exposure, for
both Morwell and Sale residents, as well as the univariate distribution of these variables, is demonstrated
in Figure 3 and

Figure 4 for mean and peak PM2.5 exposure, respectively. Figure S 1 (see supplementary material) illustrates
the relationship and distributions between mean and peak PM2.5 exposure grouped by IES-R scores within
the 75th percentile (IES-R ≤ 8) and outside the 75th percentile (IES-R > 8) for Morwell residents only.

Exposure-response relationship between PM2.5 exposure and IES-R scores

                                                                                                 Page 7 of 23
Table 2 displays the results of the multivariate regression models for the effect of increases in mean and
peak PM2.5 exposure on change in IES-R score. When controlling for potentially confounding variables,
increases in both mean and peak PM2.5 exposures were found to be associated with increases in IES-R
scores. A negative interaction was identified between age and mean PM2.5 exposure, but not peak PM2.5
exposure. For every 10 µg/m3 increase in mean PM2.5 exposure, there was a 0.98 (95% CI: 0.36 to 1.61)
increase in IES-R score at the mean age (57 years) of the cohort. At the age of 20, the estimated effect size
was almost doubled with a 1.96 score increase in IES-R (95% CI: 0.57 to 3.36) per 10 µg/m3 increase in
mean PM2.5 exposure. The predictive marginal plot of this interaction effect between mean exposure to
PM2.5 and IES-R is shown in Figure 5. For every 100 µg/m3 increase in peak PM2.5 exposure, there was a 0.36
(95% CI: 0.06 to 0.67) increase in IES-R at the mean age (57) of the cohort, which was estimated similarly
across age groups. Exploratory analysis (not presented) revealed no other significant interactions between
the other confounding variables and either mean or peak PM2.5 exposure. Furthermore, the sensitivity
analysis of the log transformed IES-R scores (not presented) and the analysis on Morwell only (see Table S 1
and Figure S 2) were congruent with the aforementioned findings.
Participants in Morwell were found to have higher IES-R scores than those from Sale after controlling for
exposure level and other potentially confounding variables. Being younger, with lower educational levels,
unemployed or unable to work and having experienced multiple historical traumatic exposures were also
found to be independently associated with higher IES-R scores. Chronic health conditions, including having
any mental health condition, or either a pre- or post-fire diagnosis of asthma or COPD, were also
independently associated with higher IES-R scores. There were no associations found between binge
drinking, cardiovascular disease, or occupational exposure and IES-R scores.
Discussion
This research identified an exposure-response relationship between participants’ exposure to PM2.5 and
their self-reported symptoms of posttraumatic distress related to the Hazelwood mine fire event. This
finding suggests that adults who were heavily exposed to the coalmine fire generally experienced more
symptoms of posttraumatic distress two and half years after the mine fire event, compared to adults who
were less exposed. The exposure-response relationship was present after accounting for potentially
confounding variables, including participants’ age, prior mental health, sex, education, employment status,
number of traumatic exposures, binge drinking behaviour, presence of asthma, COPD, cardiovascular
disease, occupational exposure, and township. Further, the estimated exposure-response relationship was
also greater in younger adults, meaning that younger adults were more sensitive to PM2.5 exposure
compared to older adults.
Although past research has shown that exposure to ambient PM2.5 is positively associated with
psychopathological symptoms (Gu et al., 2020; Kioumourtzoglou et al., 2017; Power et al., 2015; Ren et al.,
2019; Sass et al., 2017), the current research extends this observation by revealing a clear exposure-
response relationship between mine fire emitted PM2.5 and posttraumatic distress. As theorised by Block
and Calderón-Garcidueñas (2009), the relationship between PM2.5 exposure and PTSD symptoms may be
due to nervous system changes in those who were exposed. Alternatively, it may be due to behavioural
changes, such as reduced physical activity (Goodwin, 2003) or greater time spent indoors (Bresnahan,
Dickie, & Gerking, 1997). As there is significant evidence linking pollution exposure to respiratory illness
(Delfino, 2002), it is possible that the association between exposure and PTSD symptoms is also related to
the aggravation of pre-existing respiratory conditions or development of new respiratory conditions post
the event. The analysis showed that asthma and COPD, diagnosed both prior to and following the exposure
event, were associated with increased event-related distress. However, the exposure-response relationship
persisted after controlling for these respiratory conditions diagnosed before and after the mine fire. There
is also no evidence that the exposure-response relationship varied between those with respiratory
Page 8 of 23conditions diagnosed prior to the fire and those without such conditions. These findings suggest that
factors other than respiratory conditions impacted on the exposure-response relationship.
It is likely that there are multiple causal pathways driving the exposure-response relationship, with
posttraumatic distress also likely to be associated with the perceived threat from the smoke exposure in
addition to the direct toxic effects. It has been argued that uncertainty to do with the degree and type of
exposure and about the potential health outcomes, can impact on the perceived threat from an exposure
event and the resultant psychological outcomes (Green, 1998). The potential for man-made or
technological disasters to have a greater impact on psychological health compared with natural disasters,
because of the perceived breach of the social contract between the responsible agencies and the
community, has also been proposed (Green, 1998). All of these factors are relevant to the Hazelwood mine
fire event.
Morwell residents scored higher on the IES-R scale than Sale residents after accounting for the level of
PM2.5 exposure and other potentially confounding variables. This suggests that those Morwell residents
who had little or no exposure to PM2.5 (perhaps due to having left the area prior to or during the smoke
event), still reported higher levels of event-related distress, on average, than Sale residents. The finding
that locality was associated with posttraumatic distress independent of individuals’ level of exposure to
smoke during the mine fire provides some evidence to suggest that distress was also potentially
determined by people’s appraisals of the impact of the event on the Morwell community, including wider
health, socioeconomic, and social outcomes.
Further, the current analysis also sheds considerable light on the role of individual characteristics in the
development of posttraumatic distress, with age in particular shown to be an important moderating factor.
The effect of PM2.5 exposure on posttraumatic distress was worse in younger adults and younger adults also
reported higher levels of posttraumatic distress regardless of PM2.5 exposure. There are multiple,
potentially intersecting, pathways for this increase in the level of response to stressful events in younger
people. Firstly, younger individuals typically have less experience coping with natural disasters, and those
with less experience are more psychologically vulnerable (Knight, Gatz, Heller, & Bengtson, 2000). Other
research suggests that age-related changes in the prefrontal cortex, including hippocampal atrophy, may
reduce the level of responsiveness to stressful events (Andrews et al., 2017; Novais, Monteiro, Roque,
Correia-Neves, & Sousa, 2017). The converse finding that older people were less likely to report symptoms
of event-related distress whereas those with asthma, COPD, mental health conditions, or not working due
to ill-health, were more likely to report event-related distress, suggests that there is a need to discriminate
between the effect of age and ill health.
Interestingly, the moderating effect of age in the current study was only present for mean, and not peak,
exposure to PM2.5. This is likely due to the differences in the measurement of mean and peak exposure,
with peak exposure being the maximum exposure for individuals during the event which varied markedly
depending on location, whereas mean exposure was the average of 12-hourly exposure across the entire
period and so was a marker of cumulative exposure. As such, mean exposure may be more sensitive to
psychological outcomes than a single acute spike in PM2.5.
The present analysis also showed that IES-R scores were related to a number of demographic and health
variables, lending support to several previous research findings. Those with higher education levels
(Bonanno, Galea, Bucciarelli, & Vlahov, 2007; Greene, Neria, & Gross, 2016) had lower symptoms of
posttraumatic distress, while those who were unemployed or unable to work (Greene et al., 2016), had
prior mental health conditions (Perrin et al., 2014), previous experience of multiple traumatic exposures
(Bodvarsdottir & Elklit, 2004; North, Hong, Suris, & Spitznagel, 2008), or had been diagnosed with asthma
or COPD appeared to have greater symptoms of posttraumatic distress (Arcaya, Lowe, Rhodes, Waters, &
Subramanian, 2014). The time of asthma diagnosis was also important, as the effect of asthma on
Page 9 of 23posttraumatic distress was greater for those who were diagnosed with the condition after the mine fire,
compared with those who had been diagnosed prior to the mine fire.
This research has a number of noteworthy strengths. In contrast to previous epidemiological studies of
pollution events, where associations between exposure and health risks were largely examined at a
population level, in the current analysis the association was specifically evaluated at an individual level. In
particular, the use of modelled exposure data coupled with participants’ location diaries provided a
measure of individual PM2.5 exposure which was largely free from the influence of the individual’s
perception of the exposure (Glass & Sim, 2006). The study also used a large sample of the Morwell and Sale
community, as well as accounting for and exploring the impact of a number of known risk factors, such as
asthma.
However, there are recognised limitations of the research. Firstly, there is potential for recall bias in the
location diary information provided by participants, particularly given that this information was collected
more than two years after the mine fire (Coughlin, 1990). Additionally, sampling bias (participation or
selection) may still be present even after the application of sampling weightings that was used in the
statistical analyses. There was also potential for response bias in the self-reported doctor diagnosed
conditions. While self-report survey was the only possible method for collecting this data for such a large
group, the limitations of self-reported diagnosis data is well-recognised (Althubaiti, 2016). In addition, data
were not collected on factors such as whether the participant had any family member working in the coal
mine and level of support they obtained after the mine fire, which may confound the association observed.
Conclusion
The current analysis is unique in showing a clear exposure-response relationship between objective
measurements of pollution exposure and the risk of experiencing symptoms of posttraumatic distress. The
analysis also sheds light on the wide range of factors which contribute to levels of vulnerability for
experiencing symptoms of distress related to exposure to a community-wide pollution event, including
prior mental health and traumatic exposures, chronic health conditions, education and employment status.
This provides important insights into vulnerable groups who should be considered by services responding
to community needs in the aftermath of pollution events. Importantly, the association between PM2.5 from
the Hazelwood mine fire event and posttraumatic distress was more apparent in younger adults. Overall,
these findings highlight the need for a more nuanced understanding of vulnerability to psychological
distress both during and following disaster events, in order to better support the mental health of members
of affected communities.
Page 10 of 23Acknowledgments
The Hazelwood Health Study is a large program of work that comprises a number of research streams in
addition to this Adult Survey stream. Those research streams are run by a multidisciplinary group of
academic and professional staff from several Institutions including Monash University, the University of
Tasmania, Federation University, University of Adelaide and the Commonwealth Scientific and Industrial
Research Organisation. All of these staff are thanked for their contribution to this collaborative work.
Professor Rory Wolfe is also acknowledged for being an external reviewer of the research.
Page 11 of 23References
Abramson, M., Blackman, J., Carroll, M., Dimitriadis, C., Del Monaco, A., Dennekamp, M., . . . Walker, J.
(2017). Hazelwood Health Study Adult Survey: Volume 1 Comparison of Morwell and Sale. Retrieved
from Melbourne/Victoria/Australia: www.hazelwoodhealthstudy.org.au/study-reports
Althubaiti, A. (2016). Information bias in health research: definition, pitfalls, and adjustment methods. J
Multidiscip Healthc, 9, 211-217. https://doi.org/10.2147/JMDH.S104807
Andrews, C., Nettle, D., Larriva, M., Gillespie, R., Reichert, S., Brilot, B. O., . . . Bateson, M. (2017). A marker
of biological age explains individual variation in the strength of the adult stress response. R Soc
Open Sci, 4(9), 171208. https://doi.org/10.1098/rsos.171208
Arcaya, M. C., Lowe, S. R., Rhodes, J. E., Waters, M. C., & Subramanian, S. V. (2014). Association of PTSD
symptoms with asthma attacks among hurricane Katrina survivors. Journal of Traumatic Stress,
27(6), 725-729. https://doi.org/10.1002/jts.21976
Australian Bureau of Statistics. (2012). 2011.0.55.001 Information paper: Census of population and housing
- Products and services, 2011. In.
Blackman, J., Carroll, M., Gao, C., Del Monaco, A., Brown, D., Guo, Y., . . . Abramson, M. (2018). Hazelwood
Health Study Adult Survey: Volume 2 The relationship between Hazelwood mine fire smoke
exposure and health outcomes. Retrieved from Melbourne/Victoria/Australia:
www.hazelwoodhealthstudy.org.au/study-reports
Block, M. L., & Calderon-Garciduenas, L. (2009). Air pollution: mechanisms of neuroinflammation and CNS
disease. Trends in Neurosciences, 32(9), 506-516. https://doi.org/10.1016/j.tins.2009.05.009
Bodvarsdottir, I., & Elklit, A. (2004). Psychological reactions in Icelandic earthquake survivors. Scandinavian
Journal of Psychology, 45(1), 3-13. https://doi.org/10.1111/j.1467-9450.2004.00373.x
Bonanno, G. A., Galea, S., Bucciarelli, A., & Vlahov, D. (2007). What predicts psychological resilience after
disaster? The role of demographics, resources, and life stress. Journal of Consulting and Clinical
Psychology, 75(5), 671-682. https://doi.org/10.1037/0022-006X.75.5.671
Bresnahan, B. W., Dickie, M., & Gerking, S. (1997). Averting behavior and urban air pollution. Land
Economics, 73(3), 340-357. https://doi.org/10.2307/3147172
Bush, K., Kivlahan, D. R., McDonell, M. B., Fihn, S. D., & Bradley, K. A. (1998). The AUDIT alcohol
consumption questions (AUDIT-C): an effective brief screening test for problem drinking.
Ambulatory Care Quality Improvement Project (ACQUIP). Alcohol Use Disorders Identification Test.
Archives of Internal Medicine, 158(16), 1789-1795. https://doi.org/10.1001/archinte.158.16.1789
Coughlin, S. S. (1990). Recall bias in epidemiologic studies. Journal of Clinical Epidemiology, 43(1), 87-91.
https://doi.org/10.1016/0895-4356(90)90060-3
Delfino, R. J. (2002). Epidemiologic evidence for asthma and exposure to air toxics: linkages between
occupational, indoor, and community air pollution research. Environmental Health Perspectives,
110, 573-589. https://doi.org/10.1289/ehp.02110s4573
Department of Health. (2014). Victorian Population Health Survey 2011–12, survey findings. (50). State
Government of Victoria, Melbourne: State Government of Victoria, Melbourne
Emmerson, K., Reisen, F., Luhar, A., Williamson, G., & Cope, M. (2016). Air quality modelling of smoke
exposure from the Hazelwood mine fire. Retrieved from CSIRO Australia:
Foxcroft, D. R., Moreira, M. T., Almeida Santimano, N. M., & Smith, L. A. (2015). Social norms information
for alcohol misuse in university and college students. Cochrane Database of Systematic
Reviews(12), CD006748. https://doi.org/10.1002/14651858.CD006748.pub4
Glass, D. C., & Sim, M. R. (2006). The challenges of exposure assessment in health studies of Gulf War
veterans. Philosophical Transactions of the Royal Society of London. Series B: Biological Sciences,
361(1468), 627-637. https://doi.org/10.1098/rstb.2006.1822
Goldney, R. D., Wilson, D., Dal Grande, E., Fisher, L. J., & McFarlane, A. C. (2000). Suicidal ideation in a
random community sample: attributable risk due to depression and psychosocial and traumatic
events. Australian and New Zealand Journal of Psychiatry, 34(1), 98-106.
https://doi.org/10.1046/j.1440-1614.2000.00646.x
Goodwin, R. D. (2003). Association between physical activity and mental disorders among adults in the
United States. Preventive Medicine, 36(6), 698-703. https://doi.org/10.1016/S0091-7435(03)00042-
2
Page 12 of 23Green, B. L. (1998). Psychological responses to disasters: Conceptualization and identification of high-risk
survivors. Psychiatry and Clinical Neurosciences, 52(S1), S27-S33. https://doi.org/10.1046/j.1440-
1819.1998.0520s5S67.x
Greene, T., Neria, Y., & Gross, R. (2016). Prevalence, Detection and Correlates of PTSD in the Primary Care
Setting: A Systematic Review. Journal of Clinical Psychology in Medical Settings, 23(2), 160-180.
https://doi.org/10.1007/s10880-016-9449-8
Gu, H., Yan, W., Elahi, E., & Cao, Y. (2020). Air pollution risks human mental health: an implication of two-
stages least squares estimation of interaction effects. Environmental Science and Pollution Research
International, 27(2), 2036-2043. https://doi.org/10.1007/s11356-019-06612-x
Jones, R., Lee, S., Maybery, D., & McFarlane, A. (2018). Experiences of a prolonged coal-mine fire. Disaster
Prevention and Management, 27(5), 534-545. https://doi.org/10.1108/Dpm-05-2018-0145
Kioumourtzoglou, M. A., Power, M. C., Hart, J. E., Okereke, O. I., Coull, B. A., Laden, F., & Weisskopf, M. G.
(2017). The Association Between Air Pollution and Onset of Depression Among Middle-Aged and
Older Women. American Journal of Epidemiology, 185(9), 801-809.
https://doi.org/10.1093/aje/kww163
Knight, B. G., Gatz, M., Heller, K., & Bengtson, V. L. (2000). Age and emotional response to the Northridge
earthquake: a longitudinal analysis. Psychology and Aging, 15(4), 627-634.
https://doi.org/10.1037/0882-7974.15.4.627
Kroll-Smith, J. S. a. C., S.R. (1990). The Real Disaster is Above Ground: A Mine Fire and Social Conflict.
Lexington/Kentucky/USA: University Press of Kentucky.
Maybery, D., Jones, R., Dipnall, J. F., Berger, E., Campbell, T., McFarlane, A., & Carroll, M. (2020). A mixed-
methods study of psychological distress following an environmental catastrophe: the case of the
Hazelwood open-cut coalmine fire in Australia. Anxiety Stress Coping, 33(2), 216-230.
https://doi.org/10.1080/10615806.2019.1695523
Melody, S. M., & Johnston, F. H. (2015). Coal mine fires and human health: What do we know?
International Journal of Coal Geology, 152, 1-14. https://doi.org/10.1016/j.coal.2015.11.001
Newson, R. (2006). Confidence intervals for rank statistics: Percentile slopes, differences, and ratios. Stata
Journal, 6(4), 497-520. https://doi.org/10.1177/1536867x0600600404
North, C. S., Hong, B. A., Suris, A., & Spitznagel, E. L. (2008). Distinguishing distress and psychopathology
among survivors of the Oakland/Berkeley firestorm. Psychiatry, 71(1), 35-45.
https://doi.org/10.1521/psyc.2008.71.1.35
Novais, A., Monteiro, S., Roque, S., Correia-Neves, M., & Sousa, N. (2017). How age, sex and genotype
shape the stress response. Neurobiol Stress, 6, 44-56. https://doi.org/10.1016/j.ynstr.2016.11.004
Perrin, M., Vandeleur, C. L., Castelao, E., Rothen, S., Glaus, J., Vollenweider, P., & Preisig, M. (2014).
Determinants of the development of post-traumatic stress disorder, in the general population.
Social Psychiatry and Psychiatric Epidemiology, 49(3), 447-457. https://doi.org/10.1007/s00127-
013-0762-3
Power, M. C., Kioumourtzoglou, M. A., Hart, J. E., Okereke, O. I., Laden, F., & Weisskopf, M. G. (2015). The
relation between past exposure to fine particulate air pollution and prevalent anxiety:
observational cohort study. BMJ, 350, h1111. https://doi.org/10.1136/bmj.h1111
Ren, T., Yu, X., & Yang, W. (2019). Do cognitive and non-cognitive abilities mediate the relationship
between air pollution exposure and mental health? PloS One, 14(10), e0223353.
https://doi.org/10.1371/journal.pone.0223353
Royston, P., & White, I. R. (2011). Multiple Imputation by Chained Equations (MICE): Implementation in
Stata. Journal of Statistical Software, 45(4), 1-20. https://doi.org/10.18637/jss.v045.i04
Rubin, D. B. (1996). Multiple imputation after 18+ years. Journal of the American Statistical Association,
91(434), 473-489. https://doi.org/10.2307/2291635
Sass, V., Kravitz-Wirtz, N., Karceski, S. M., Hajat, A., Crowder, K., & Takeuchi, D. (2017). The effects of air
pollution on individual psychological distress. Health Place, 48, 72-79.
https://doi.org/10.1016/j.healthplace.2017.09.006
StataCorp. (2017). Stata Statistical Software: Release 15. College Station, TX: StataCorp LLC.
Weiss, D. S., & Marmar, C. R. (1997). The Impact of Event Scale-Revised. In Assessing psychological trauma
and PTSD (pp. 399-411). New York City, New York, USA: Guilford Press; US.
Page 13 of 23Wood, P., Duffy, M., Yell, S., Morrissey, B., Whyte, S., Walker, L., & Maybery, D. (2015). Coal mine fire initial
impact on community health and wellbeing summary report. Retrieved from
Churchill/Victoria/Australia:
Figure 1. Relative locations of the coal mine, Morwell, wider Latrobe Valley, and Sale, and position with th e
state of Victoria, Australia.
Page 14 of 23Table 1. Participants’ characteristics by PM2.5 exposure – no exposure in Sale compared to mean PM2.5
tertiles in Morwell.
Sale no exposure a Morwell low a Morwell medium a Morwell high a
N=960 exposure exposure exposure
N=1053 N=1027 N=1016
n (%) b n (%) b n (%) b n (%) b p-value
Male 410 (45%) 459 (47%) 471 (50%) 459 (47%) 0.185
Employment
Paid employment 451 (56%) 432 (51%) 444 (52%) 435 (51%)a
Morwell participants were grouped by mean PM2.5 exposure tertiles and Sale participants were the no exposure
comparison group. However, some participants from Sale would have had some PM 2.5 exposure, and some
participants from Morwell would have had no PM2.5 exposure.
b
%, Mean, SD, Median and IQR were weighted.
c
Proportion of missing observations for each IES-R item ranged from 1.85% to 3.13% of study sample (4056). IESR-R
had 235 (5.79%) missing observations, sex had 2 (0.05%) missing observations, employment status had 54 (1.33%)
missing observations, highest education had 52 (1.28%) missing observations, prior mental health had 19 (0.47%)
missing observations, number of traumatic life events had 73 (1.80%) missing observations, cardiovascular disease
had 56 (1.38%) missing observations, asthma had 22 (0.54%) missing observations, COPD had 14 (0.35%) missing
observations, binge drinking had 84 missing observations (2.07%), occupational exposure had 0 missing observations,
age had 6 missing observations (0.15%), and mean and peak exposure to PM 2.5 had 0 missing observations.
Figure 2. Box plot of IES-R scores by exposure groups defined as Sale compared with tertiles of mean
exposure to PM2.5 within Morwell. IES-R scores were not weighted in Figure 2.
Page 16 of 23Figure 3. Scatter plot of mean exposure to PM2.5 (µg/m3) with IESR by group with marginal distribution by
the side. The dotted line across the vertical axis reflects the mean of IESR-R scores and the dotted line
across the horizontal axis reflects the mean of mean exposure to PM2.5.
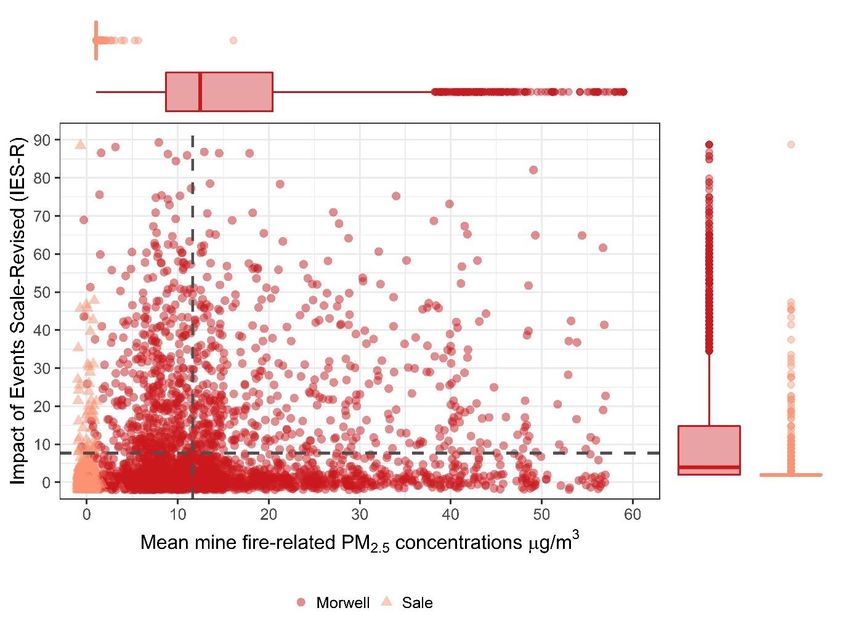
Page 17 of 23Figure 4. Scatter plot of peak exposure to PM2.5 (µg/m3) with IESR by group with marginal distribution by
the side. The dotted line across the vertical axis reflects the mean of IESR-R scores and the dotted line
across the horizontal axis reflects the mean of peak exposure to PM2.5.
Page 18 of 23Table 2. Association between IES-R scores with PM2.5 exposure and confounding variables.
Mean PM2.5 exposure Peak PM2.5 exposure Regression
Regression model a model b
IES-R IES-R
Adj coefficient e p-value Adj coefficient e p-value
Predictors (95% CI) (95% CI)
PM2.5 exposure 0.98 (0.36,1.61) 0.002 0.36 (0.06,0.67) 0.019
Age c -0.47 (-0.80,-0.13) 0.007 -0.44 (-0.76,-0.11) 0.009
Interaction between exposure and age -0.26 (-0.52,-0.01) 0.043 -0.05 (-0.19,0.09) 0.497
Any mental health conditions 1.66 (0.54,2.78) 0.004 1.69 (0.57,2.82) 0.003
Male -0.62 (-1.65,0.40) 0.234 -0.61 (-1.64,0.43) 0.249
Morwell 5.47 (4.25,6.68)Figure 5. Predictive marginal plot for mean exposure to PM2.5 (µg/m3) and IES-R by age group. Error bars
reflect 95% confidence intervals of IES-R for each age group across exposure levels.
Page 20 of 23Supplementary Material
Figure S 1. Scatter plot and distribution of mean and peak exposure to PM2.5 (µg/m3) by IES-R group (IES-R ≤
8 vs IES-R > 8) for Morwell residents only.
Page 21 of 23Table S 1. Association between IES-R scores with PM2.5 exposure and confounding variables in Morwell
only.
a
Mean PM2.5 exposure per 10 µg/m3 and centred at 10 µg/m3.
b
Mean PM2.5 exposure Peak PM2.5 exposure
Predictors Regression model a Regression model b
IES-R p-value IES-R p-value
Adj coefficient e Adj coefficient e
(95% CI) (95% CI)
PM2.5 exposure 0.92 (0.32,1.53) 0.003 0.36 (0.06,0.66) 0.020
Age c -0.30 (-0.80,0.20) 0.245 -0.41 (-0.93,0.11) 0.123
Interaction between exposure and age -0.45 (-0.79,-0.10) 0.012 -0.09 (-0.27,0.08) 0.301
Any mental health conditions 2.53 (1.04,4.02)Figure S 2. Predictive marginal plot for mean exposure to PM2.5 (µg/m3) and IES-R by age group in Morwell
only. Error bars reflect 95% confidence intervals of IES-R for each age group across exposure levels.
Page 23 of 23You can also read