Reply to anonymous referee #1 - Generic comments - "A numerical study to investigate the roles of ...
←
→
Page content transcription
If your browser does not render page correctly, please read the page content below

Reply to referees - WCD-2020-54 - "A numerical study to investigate the roles of
       former hurricane Leslie, orography, and evaporative cooling in the 2018 Aude heavy
                                       precipitation event"
        We thank the referees for their thoughtful comments, which we have addressed below. Comments from referees are in italics
 5   and our response is in upright font. Parts added to the manuscript are in blue and deleted parts are in red. Lines refer to the
     lines of the preprint.

     Reply to anonymous referee #1
     Generic comments

           This study investigates the mesoscale dynamics of the heavy precipitation event affecting the Aude region during
10         the heavy precipitation event of the 14-15 October 2018. After a (too ?) long and detailed description, the roles
           of former hurricane Leslie, the orography, and evaporative cooling are examined. The interaction of the incoming
           trough and surface cyclone with the orography helped the convective activity focusing west of the quasi-stationary
           cold front and downwind of the Albera Massif. Leslie’s remnants are involved in the formation of the second cold
           front CF2 and contributed to the supply of low-level conditionally unstable air in the second part of the event.
15         However, the grater contribution to the precipitation over the Aude department mainly originated from moisture
           coming from the Mediterranean Sea. Finally evaporative cooling did not seem to play a substantial role in the
           dynamics but only in the control of the total simulated amount of precip. The paper is well written and clearly
           structured however I feel it sometimes goes too long in the description of the dynamics of the event in a dispropor-
           tionate way compared to the focus of the research. The analysis of Leslie’s contribution and evaporative cooling
20         is resolved in a short part compared to the long introduction on the analysis of the event and the methodology of
           analysis which however I find accurate. So I do not have a strong recommendation if not to make the article more
           concise and to the point.

     > As recommended, the article has been made more concise and thus substantially shortened.

     Specific comments

25         I’m doubtful on the expression "personal weather station". What about "private weather stations" belonging to
           citizen weather observing networks integrating the official Meteo-France Network. Or something similar. I would
           also put a reference if this initiative is coordinated by the National Met Service.

   > Multiple names are given in the literature to personal weather stations: amateur weather stations (Bell et al., 2013; Muller
   et al., 2015; Chapman et al., 2017), citizen weather stations (Meier et al., 2017; Napoly et al., 2018; Nipen et al., 2020), personal
30 weather stations (Muller et al., 2015; Chapman and Bell, 2018; McNicholas and Mass, 2018; de Vos et al., 2020; Hintz et al.,
   2021), private (automatic) weather stations (Waller, 2020). The initiative of using these networks is not coordinated for the
   moment but Eumetnet is working on it with the recent creation of a working group on crowd-sourcing.
   In the abstract, the expression has been detailed: [...] including crowd-sourced observations of personal weather stations.
   In the introduction, a reference has been added: [...] from observations of standard and personal weather stations (Mandement
35 and Caumont, 2020).

           The literature cited in the introduction is appropriate. I think that the synoptic description, as well the numerical
           simulations section can be shortened perhaps limiting to the essential level of details needed for the following
           dynamical assessment.

     > The synoptic description and the numerical simulations section have been shortened.

                                                                     1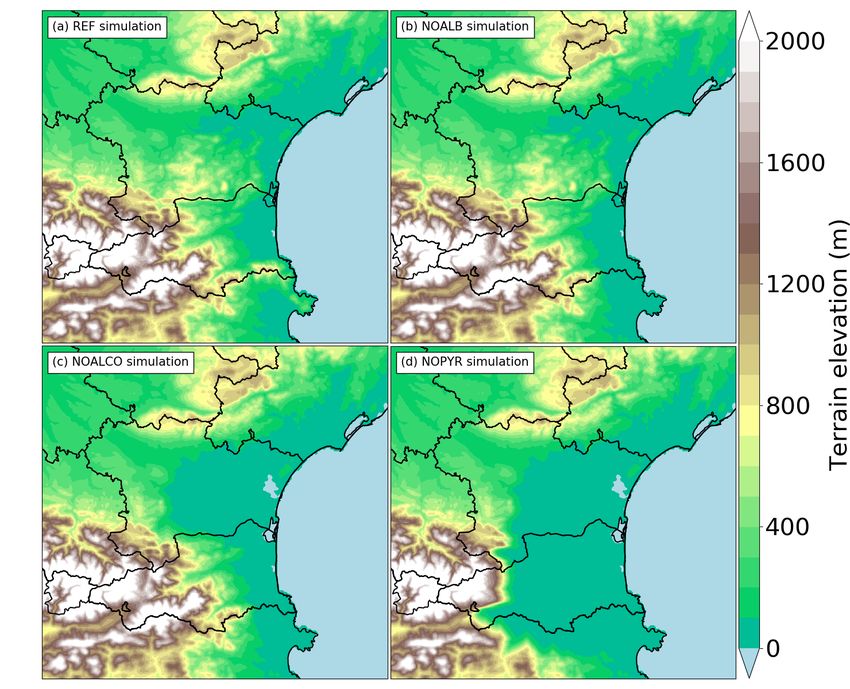
I’m also suggesting to shorten the Conclusions eliminating unnecessary details like time of the day references of
     values of single variables to have a more compact way to present results. In the conclusions bullet points (line
     590), I would add the part on the evaporative cooling reported earlier at line 585

> Conclusion has been shortened and modified as asked.

                                                            2
Reply to anonymous referee #2
Generic comments
This study focuses on the investigation of a heavy precipitation event in October 2018 in the Aude region,south-
eastern France. Following the investigation by Caumont et al. (2020), there main aspects are evaluated in this
5 investigation, the origin of moisture with particular attention paid to the role of the hurricane Leslie, the role of
the Pyrenees and the role of the evaporative cooling. Numerical simulations and near-surface observations are
examined with this purpose. Given the exceptionality of the event, but the increase in the frequency of such situ-
ations, and the enormous fatal consequences, the understanding of this heavy precipitation event is of relevance.
The paper is clear and well structured. However, sometimes too descriptive, which could make it difficult for the
10 reader to follow the main investigation line of the article. Therefore, I suggest shortening too descriptive sections
and focus with more detail in the description of those aspects pointed out as goals of this investigation. The liter-
ature cited in the introduction is appropriate although I suggest additionally introducing more recent references,
also providing some information and references of previous publications, focusing on the key role of moisture and
its origin, topography, and evaporative cooling on heavy precipitation events.
15 > The article has been substantially shortened, some more recent references have been introduced and some information has
been added on previous publications.
Specific comments
1. It could be important to clearly state in the abstract and more in detail in the introduction what is the novelty
and contribution of this investigation.
20 > The abstract and the introduction have been modified to clarify contributions and novelty of this investigation. The main
contributions of the study are to investigate, through numerical simulations, the physical processes that led to the location and
intensity of the observed rainfall during the 2018 Aude HPE. The realism of the simulated fields is evaluated by comparing
them with novel near-surface analyses including personal weather stations.
2. The model and resolution used for the numerical simulations could be provided already in the abstract.
25 > As recommended, they have been added in the abstract.
L6: numerical simulations are run at 1 km and 500 m horizontal resolutions. These simulations are and evaluated with
3. Try to substitute 4.5° in the abstract for a “easier location definition” for the reader.
> In the abstract, some of the text and the conclusion, east of 4.5◦ E has been replaced by east of the Balearic Islands.
4. The autumn 2018, and particularly October, was a period in which the western Mediterranean region was
30 strongly affected by damaging heavy precipitation events, including the known as the Aude 2018 event. Also, on 9
October 2018 the Balearic Islands suffered catastrophic consequences due to similar heavy precipitation phenom-
ena. Thus, the manuscript will benefit from a description of the conditions in the autumn period for the western
Mediterranean, the comparison with the climatological conditions particularly for the north-western Mediter-
ranean, and the description of any possible connection between the two events.
35 > You’re right, the Aude and the Balearic Islands HPEs belong to a series of precipitating episodes that occurred in October
and November 2018 as described by Lorenzo-Lacruz et al. (2019). For French territories of the western Mediterranean region,
Météo-France issued orange or red watches/warnings for thunderstorms, rain or floods for not less than 15 days during the
month of October 2018. We agree that a detailed analysis of the large-scale conditions over the north-western Mediterranean
region during this autumn period as well as establishing connections between these two HPEs is of particular interest. We think
3it is out of the scope of this particular study which focuses on what happened in a short time period at mesoscale but could be
the topic of a future work.
A short sentence has been added: This episode is part of a series of HPEs that occurred in October and November 2018 over
the north-western Mediterraneannd particularly affected the Balearic Islands on 9 October (Lorenzo-Lacruz et al., 2019) and
5 Italy on 27–30 October (Davolio et al., 2020).
5. The case description and the numerical simulations section could be shortened with major focus on the infor-
mation relevant for the case analysis and answering of the questions initially raised.
> The case description (Sect. 2) and the numerical simulations section (Sect. 3) have been shortened as recommended.
6. Please rethink the sentence in L215 “... is run to realistically simulate the case”.
10 > is run to realistically simulate the case has been replaced by is carried out to realistically simulate the rainfall observed during
the case.
7. It would be interesting providing an additional simulation in which the Pyrenees were removed since its position
is upstream and one goal of this study is provide and analysis of the role of topography. If this is not possible, a
hypothesis would be needed.
15 > Two additional simulations have been computed in addition with the two simulations (REF and NOALB) already shown
in the article. Fig. A summarises the topography of all simulations:
(a) REF: Reference
(b) NOALB: the Albera Massif is removed
(c) NOALCO: the Albera Massif and the Corbières Massif are removed
20 (d) NOPYR: the Eastern slopes of the Pyrénées, the Corbières Massif and the Albera Massif are removed.
However, because of a change in Météo-France supercomputer (that induced a change in model compilers) and the use of
a newer version of Meso-NH due to this supercomputer change (v5.4.4 instead of v5.4.2), the same physical choices have not
led to the exact same numerical solution. So, to produce Fig. B, REF and NOALB have also been recomputed with this version
5.4.4. Figures of the article are not modified, they still are from the v5.4.2. The 24 h rainfall of the 4 simulations is shown in
25 Fig. B and can be compared with Fig. 6 of the article. As adding these new figures would increase the length of the article, the
results of these additional simulations are explained in a small paragraph:
Additional simulations (not shown) in which the Corbières Massif and the Eastern slopes of the Pyrenees are successively
flattened show a substantial decrease in maximum accumulated precipitation downstream of these reliefs, associated with a
spread of precipitation above 200 mm over a larger area along the quasi-stationary front.
30 8. Please provide information of why only near-surface information is analysed and validated.
> A comparison to high resolution soundings at the initial state has been added, as well as an explanation of why we focus
on the validation of REF near the ground:
Since the initial conditions of REF are provided by the AROME analyses in which all conventional observations are assimi-
lated, there is little deviation from these observations at the initial time. At 12:00 UTC 14 October, comparison of REF fields on
35 all vertical levels to high resolution soundings of Nîmes, Barcelona and Palma (not shown, see Fig. 1 for the locations) reveal
absolute bias (respectively root mean square error) of < 0.3 K (resp. < 0.6 K) in temperature, < 0.3 g kg–1 (resp. < 0.8 g kg–1 ) in
water vapour mixing ratio, < 0.5 m s–1 (resp. < 1.9 m s–1 ) in wind speed and < 7◦ (resp. < 16◦ ) in wind direction.
Because the stationarity of precipitation is correlated to the quasi-stationarity of a MSLP trough and a virtual potential
temperature (θv ) gradient (Sect. 2.1), and because of the availability of near-surface observations that are not assimilated in the
40 AROME model, this section focuses on validating the REF simulation near the surface.
9. There are too many figures in the article, and multiple panels in some of them. Please, restrict the number of
figures to those strictly necessary and try to combine when possible several information in one figure.
> Figures 8, 10, 13 have been removed and several figures have been modified as recommended by other referees.
4Figure A. Orography of the south Languedoc-Roussillon including the Aude department in simulations (a) REF, (b) NOALB, (c) NOALCO
and (d) NOPYR.
5Figure B. 24 h accumulated precipitation between 12:00 UTC 14 October and 12:00 UTC 15 October from the (a) REF (b) NOCOOL, (c)
NOALCO and (d) NOPYR simulations. Dotted black lines indicate catchment limits of the Aude basin and its tributaries.
6Reply to anonymous referee #3
General comments
Paper would benefit from a more diverse collection of references, which place these heavy rainfall events into
wider context and better draw upon literature from all across the world.
5 > More diverse references have been added to the paper as recommended.
A schematic diagram of typical synoptic setup during heavy precipitation event might be useful (you show a map
in Figure 1, but as the reader, I want more information and detail). This kind of plot would really sell the paper to
the reader.
> We agree, but given the number of figures this plot have not been added. A schematic diagram of main low-level mechanisms
10 of HPEs in the western Mediterranean region is given by the Fig. 1 of Ducrocq et al. (2016), reference which has been added
to the article. Also, three composite analyses detailing the synoptic setup for HPEs occurring over Languedoc-Roussillon are
given by the Fig. 11 of Ricard et al. (2012).
The detail in evaluating model performance against observations is impressive. The length of this paper could be
reduced. The level of detail is commendable, but there are sections that are difficult to fully take in because of the
15 consistent level of depth.
– The text on the model setup in Section 3.1 is an example. The level of detail is impressive, but do you need to
go into this much detail?
– Along the same line, you could lose a couple of figures (and accompanying text) without reducing the quality
of your writing. As an example, you could remove either Figure 7 or 8, Figure 10, and Figure 13 without
20 impacting the quality of your analysis.
> The numerical simulations section (Sect. 3) has been significantly shortened. Details of the Meso-NH configuration necessary
to reproduce our experiments have been moved to an appendix. Figures 8, 10, 13 have been removed as recommended and the
accompanying text has been shortened.
Careful to use the same tense throughout your writing. In places you switch between present and past, which is
25 confusing.
> You’re right, verbs tense has been homogenised throughout the article.
When you introduce diagnostics such as water vapour mixing ratio and precipitable water in Section 2, it would
be useful to know how large these values are relative to climatology (how unusual?).
> The sentence introducing water vapour mixing ratio (L98) is detailed: These values are in the upper range of mixing ratios
30 observed within the boundary layer over the Gulf of Lion by Di Girolamo et al. (2016) (8–15 g kg–1 ) or within the free
troposphere below 3 km a.g.l. (2–8 g kg–1 ) over the Balearic Islands by Chazette et al. (2016) during southerly marine flows of
the HyMeX SOP1.
The sentence referring to precipitable water (PW) L116 has been removed to shorten this part. The 2002-2006 climatology of
Ricard et al. (2012) shows values of PW during the mature stage of HPEs ranging from 14.1 to 38.4 mm over southern France.
35 Khodayar et al. (2018) shows that all convective episodes leading to heavy precipitation systems during IOP12 (2012) occurred
in environments with integrated water vapour (IWV) ranging between 30 and 45 kg m–2 i.e. PW = IWV ρ ranging between 30
and 45 mm considering a water density ρ = 1000 kg m–3 .
Splitting section 2 into two sub-sections, one focusing on the synoptic evolution and the other on the mesoscale
details of the rainfall, could help to make the writing more streamlined and easier to follow. At the moment, there
40 is too much information crammed in; the section is too long.
7> The section has been split in two sub-sections, which have both been shortened.
You have confused ‘westwards’ and ‘eastwards’ in places throughout the text. Make sure that your descriptions
are accurate and consistent.
> You’re absolutely right, four errors have been corrected.
5 – L85 westward movement eastward movement;
– L86 westwards eastwards;
– L109 westwards eastwards;
– L110 west east
There are quite a few occasions where you describe details of the synoptic or mesoscale evolution without referring
10 to figures. It is fine to do this on a few occasions (adding "not shown"), but not too much, or the reader will get
confused.
> Parts of the article which were not related to figures have been shortened or deleted, and "not shown" has been added in
sentences not referring to figures.
Some of the more technical information could be included in an Appendices section at the end of the paper, rather
15 than in the main text (would help to streamline the text). The first paragraph in Section 4 is a good example (on
REF_SP).
> Technical information about Meso-NH configuration have been moved to an appendix. The paragraph in Section 4 has been
substantially shortened.
Generally, there is too much description of results, and not enough interpretation and putting your results into
20 wider context.
> By shortening the descriptive parts of the article, adding more diverse and recent references to put this HPE in a wider
context, and responding to the various referees’ comments, we hope to have improved the quality of the article and addressed
this point.
When explaining to the reader why this study is important (Introduction), you should discuss the topic of interac-
25 tions between tropical cyclones and the midlatitude flow, and how they can impact upon predictability. Papers by
Christian Grams and Florian Pantillon provide good examples of this type of work. This type of discussion will
help to link the specifics of this event that you’re discussing with larger-scale issues of interest in the meteorology
community.
> Thanks for the references. Sentences have been added or modified in the introduction and conclusion based on the information
30 of articles written by Christian Grams and Florian Pantillon:
In the introduction:
Transitioning hurricanes over the North Atlantic are known to disturb the midlatitude flow close or downstream of them,
causing or modifying the location and intensity of high-impact weather such as HPEs (Grams and Blumer, 2015; Pantillon
et al., 2015). As hurricanes can supply large amounts of moisture and because the moisture structure in the lower troposphere
35 was shown to play a key role in the timing and location of precipitation of previous HPEs (Lee et al., 2018), it is of interest to
quantify the amount of moisture supplied by Leslie to the convective system.
In the conclusion:
Future work could quantify Leslie’s contribution in the cyclogenesis mechanisms of this Mediterranean low and more generally
the role of ex-tropical cyclones in disturbing weather of the Mediterranean basin. Accurately track and represent the life
40 cycle of Mediterranean lows seems crucial to better forecast HPEs.direct contribution in the formation of the Mediterranean
low and its associated cold front CF2 but also the remote impact of Leslie’s extratropical transition in a similar way as
Grams and Blumer (2015) or Pantillon et al. (2015): it could help to understand how accurately these systems need to be
tracked to improve HPE forecasts.
8Specific comments
Avoid vague language (a few replacements are suggested)
– convective activity -> convection
– synoptic situation
5 – seem to be maintained -> maintained
– density departures
– thermal signature
– more reflectivities are observed
– precipitating activities -> precipitation
10 > Vague language has been replaced in several parts of the manuscript:
L3: The synoptic situation was perturbed by the former hurricane Leslie, involved has been replaced by At synoptic scale,
the former hurricane Leslie was involved
L14: seem to be maintained has been replaced by are maintained
L44: density departures between air masses that cause the most buoyant air parcels to ascend has been replaced by buoyancy
15 differences between air masses
L109: Its precipitating activity has been replaced by Precipitation along CF1
L110: thermal signature has been replaced by thermal gradient
L138: more reflectivities are observed has been replaced by an extended region of reflectivity >12 dBZ is observed
Some occurrences of "synoptic situation" have been kept when its meaning of "meteorological situation at synoptic-scale"
20 appeared useful.
Standard and personal weather stations –please elaborate
> The sentence has been reformulated: with near-surface analyses comprising standard and including crowd-sourced observa-
tions of personal weather stations.
You introduce the concept of the stationarity of the cold front (L11) without any prior discussion –seems a bit
25 rushed
> It referred to L4: "At mesoscale, convective cells focused west of a cold front". However, to be consistent with literature
(e.g., Santurette and Joly, 2002), a cold front that become stationary is a quasi-stationary front. Thus, L4 has been modified:
At mesoscale, convective cells focused west of a quasi-stationary cold frontdecaying cold front, that became quasi-stationary,
L15 to 17: ‘the location of the exceptional precipitation appears to be driven primarily by the location of the
30 quasi-stationary cold front...’ seems like an obvious statement to make. Would like more insight here.
> This front is, before the event, a decaying cold front along which precipitation decreased and almost stopped. Then during
the event, it becomes active due to the increasing advection of conditionally unstable air by the low-level jet that strengthens at
the beginning of the event. More details have been added in the abstract to express the specificity of this quasi-stationary front:
At mesoscale, convective cells focused west of a decaying cold front [...] Regarding lifting mechanisms, the advection of
35 conditionally unstable air by a low-level jet towards the quasi-stationary front, confined to altitudes below 2 km, reactivated
convection along and downwind of the front.
Which dataset did Ricard et al. (2012) use for their climatology of heavy precipitation events over the northwest
Mediterranean?
9> To answer, the sentence L27 has been expanded: Ricard et al. (2012) built a climatology of HPE environments over the
north-western Mediterranean area based on 3D-Var ALADIN mesoscale analyses of a 5 yr period (2002–2006).
‘Mediterranean Sea supplied up to 60% of the total air parcels moisture (Duffourg and Ducrocq, 2013; Duffourg
et al. 2018), modulating the intensity of convective precipitation.’ How did the authors calculate this value (60%)?
5 More information on the method is needed here, even if brief.
> This value was calculated by water budgets by Duffourg and Ducrocq (2013). Also, Duffourg et al. (2018) estimated with
backward trajectories that 50 % of the moisture supply of the 14 October 2012 HPE originated from evaporation over the
Mediterranean sea. Because the method varies between both articles, the last reference has been removed.
The sentence L37 has been modified: The Mediterranean Sea supplies moisture – up to 60 % of the total air parcels moisture in
10 previous HPEs according to water budgets of Duffourg and Ducrocq (2013) (Duffourg and Ducrocq., 2013; Duffourg et al., 2018).
L46: don’t start a new sentence with ‘this’. Always refer directly to the part of the previous sentence that you’re
referencing (i.e. ‘This combination of factors...’).
> You’re right, it has been corrected. Other sentences L301-302 and L530-531 have also been corrected.
L52: need a sentence to tell the reader that you’re introducing your case study here. Currently, you just start
15 talking and the transition from the topic in the previous paragraph is not smooth enough.
> The following sentence has been added: Among these mechanisms, those at the origin of the HPE of 14 and 15 October
2018, on which this article focuses, are studied.
Paragraph on the event itself reads well (L52-62); you summarise the key points nicely.
> Thank you!
20 L68-69: ‘Because of the heavy rain observed in the area, evaporative cooling processes may have played a role
in the stationarity of the cold front.’ Not sure I follow this argument. Evaporative cooling would be expected in
conjunction with the rainfall, but why are you hypothesising that this cooling could play an important role in the
movement of the front? You need to make this point more confidently here, and with more detail.
> This point has been detailed: Because of the heavy convective rain observed west of this front, evaporative cooling may have
25 additionally cooled the west side of the front. This additional cold air may have caused a dynamic feedback that contributed to
the stationarity of the front. Similar dynamic feedback was described by Davolio et al. (2016) over north-eastern Italy: in cases
of upstream events, a cold-air layer formation preceded the convection onset and evaporation and sublimation of precipitation
beneath the convective system were able to additionally cool this cold-air layer, which influenced the propagation of this
cold-air mass.
30 L69-71: link between evaporative cooling and conditionally unstable air? Are you hypothesising that evaporative
cooling occurred in the mid troposphere and destabilised the profile? Need to make these details clearer.
> You’re right, the sentence L69-71 was unclear so it has been reworded. Establishing a link between evaporative cooling and
conditionally unstable air was not the goal of the sentence. Consequently, the goal of the article is to address the questions
raised by Caumont et al. (2021): what are the roles of (i) the moisture provided by Leslie, (ii) the Pyrenees relief and (iii) the
35 evaporative cooling in the physical processes that led to the location and intensity of the observed rainfall?
L84-87: where is the evidence that the interaction between both lows seems to have strongly slowed the westward
movement of the mid-level cut-off low? Or, do you mean eastward movement? This would make more sense.
> Indeed, there was an error, we meant eastward. Because it is only speculative, this paragraph has been modified:
10– L85 westward movement eastward movement;
– L86 westwards eastwards.
L88-92: which figure are you referring to in this discussion? Make the connection clearer and add detail to figure
if necessary.
5 > There was no figure, (not shown) has been added.
L103-104: “A potential vorticity at upper levels is observed upstream of the low.” Where is the evidence for this
feature? Need to relate all statements to figures, or add ‘(not shown)’.
> There was indeed no figure. This part has been removed in order to shorten the manuscript as recommended.
L104: “It may have helped to deepen it...”. A reference or two here on the interaction between surface cyclones
10 and upper-level PV anomalies would be beneficial. Something like Hoskins et al. (1985), or a classic paper along
those lines.
> This part has been removed in order to shorten the section as recommended.
Be as precise as possible in your discussion of figures. For example, in Figure 4 you plot the 925 hPa water vapour
mixing ratio and geopotential height. In the accompanying text, make sure that you refer to the diagnostics in the
15 figure (“925 hPa wind”), rather than using more vague descriptions (“near-surface wind”).
> You’re right, here because the 925 hPa wind was not shown in Figure 4, we have added (not shown) and have replaced
near-surface by between the surface and 925 hPa.
Do the authors have any theory on why precipitation within the western band is overestimated by the model, or
why the model overestimates precipitation over orography?
20 > Within the western band and over orography of the eastern Pyrenees, Fig. B shows large departures between quantitative
precipitation estimate (QPE) and simulation. However, during that case, because of a radar failure mentioned in the article
but also the bad coverage of eastern Pyrenees by the French radar network, QPEs, even if they include rain gauge data, likely
underestimate rainfall in these two mountainous areas. Thus, even if direct comparisons of the REF simulation with several
rain gauges show overestimations, it is hard to give an explanation as the amplitude of the overestimations away of rain gauges
25 is not known with certainty.
Add latitude and longitude labels and tickmarks to Figures 2 to 6
> Labels and tickmarks have been added.
Overlay the position of key features such as CF1 and CF2 on the relevant figures. It would make the connection
between text and figures much stronger.
30 > It has been done on the relevant figures.
How do Leslie’s remnants contribute to the formation of the cold front CF2, behind which a Mediterranean low
deepened rapidly?
> In the article, we indicate that thermodynamic anomalies associated to Leslie’s remnants evolve in what is identified by
meteorologists as a cold front on the analyses but the physical mechanisms at stake are not studied and the answer to this
35 question has been mentioned in the conclusion as a future work.
11Mark the Albera Massif on Figure 5. Also mark the Aude and Pyrénées-Orientales departments. You refer to these
features, but the reader won’t necessarily know where they are (without referring back to earlier figures). The
convective lines that you mark on Figure 5 are not easy to see. The eastern line in Figs. 5a to c is fine, but the other
two lines are much more difficult to pick out. Is there another way that you could annotate these figure panels?
5 > In Figure 5, the color range has been modified to better highlight the lines. We have not found a better way than arrows
to make clear the direction of propagation of the cells. "A", "P", CF1 and CF2 have been added to respectively indicate the
locations of the Albera Massif, the Eastern slopes of the Pyrenees, CF1 and CF2. We have not added the Aude and Pyrénées-
Orientales departments as the figure is quite busy and as they are shown in Fig. 1.
L229: do you mean downstream? Upstream suggests the windward (not lee) side of the ridges.
10 > Our sentence was unclear: we meant that bands were generated upstream of the ridges, propagated, and then were enhanced
downstream. If we quote Cosma et al. (2002): "The bands are generated upstream of these ridges and enhanced on the lee side
by convergence created by deflection around the obstacle and penetration of the flow into the valleys". Our sentence has been
clarified, and the reference to the upstream generation has been removed:
Similar convective band generation was observed in the south-eastern flank of the Massif Central by Miniscloux et al. (2001)
15 and Cosma et al. (2002) upstream of small-scale topography ridges, with an enhancement of these bands : rainfall bands were
enhanced on the lee side of small-scale topography the ridges.
L243-255: when justifying your investigation of evaporative cooling, it’s not immediately clear how evaporative
cooling near the surface could modify the location of CF1 or change its stationarity. Could you describe how this
could occur (maybe add a reference)?
20 > This part has been modified, and a reference has been added in the introduction (see the answer of L68-69).
L248-255: in the NOCOOL simulation, did you turn evaporation off completely in the child domain, or just set
the temperature tendency from evaporation to zero? Assuming the second – it wouldn’t make a difference to your
results, but it’s best to be as precise as possible when discussing the changes you made to the model output.
> You’re right, a sentence is added in the paper: In NOCOOL, negative temperature tendency from evaporation of raindrops is
25 set to zero.
L277-286: you discuss the evolution of precipitation in your model simulation relative to observations, but don’t
show any of the plots required to do so (Figure 6 presents accumulated rainfall but gives no indication of how the
structure of the rainfall evolves during the 24-h period).
> You’re right, the paragraph has been significantly shortened and (not shown) has been added.
30 Figure 8: why have you used virtual potential temperature rather than potential temperature to diagnose the
position of the front? Would be interesting to know what the pure temperature difference across the front looks like
(potential temperature) as well as the moisture difference (virtual potential temperature). Don’t change anything
in the manuscript, it’s just something to think about in future.
> We used virtual potential temperature because it takes into account the density effects of water vapour. In this case, virtual
35 potential temperature and potential temperature gradients are quite similar because relative humidity is between 90 and 100 %
at screen level between 23:00 and 04:00 UTC on each side of the front.
Figure 10: the idea is good, but it’s difficult to pick out the difference between the observations and the REF
simulation, because as the reader you are drawn to the filled contours (REF winds) and it’s hard to see the
differences between the wind vectors in black and red. Given that the text accompanying this figure makes a
40 similar point to that with Figure 9, I would recommend removing the figure. You could still make your point
about the longer stationary period in the REF simulation (relative to observations) likely explaining some of the
over-estimation in accumulated rainfall.
12> You’re right, the figure has been removed.
L345-346: how does the Lagrangian trajectory tool of Gheusi and Stein (2002) differ from newer tools such as
LAGRANTO?
To answer, the following sentence has been added: It is based on the technique of Schär and Wernli (1993) in which three
5 Eulerian passive tracers are initialised with the initial grid point position and are advected online by the resolved and subgrid-
scale wind; a review of existing Lagrangian trajectory tools is given by Miltenberger et al. (2013).
Discussion of Figure 11 ( L355): make it clearer in the figure panels and in the text that the trajectories in (b)
correspond to the transect (A -> D), etc. The reader will get confused otherwise. You have done this in your
discussion of Figure 13 please apply the same method to the discussion of Figure 11.
10 > The transects have been indicated in the text as recommended.
Nice illustration of lifting along the cold front in Fig. 11c. Overlay the position of the cold fronts (CF1 and CF2)
in Figures 11 and 12, and on Figures 14 and 15.
> The position of the cold fronts has been overlaid.
L387-389: the claim that the trough over the Aude department may locally increase wind shear inland, based on
15 Fig. 10a, is not based up strongly by the evidence.
> You’re right, this claim has been removed.
Do you need Figure 13? The results are similar to those in Figure 11, and you could just include a sentence to tell
the reader that trajectories ending at 0400 UTC 15th October are qualitatively similar to those ending at 0000
UTC 15th October.
20 > Figure 13 has been deleted, and a sentence has been added: Similar backward trajectories are simulated at the end of this first
part, e.g. at 04:00 UTC 15 October (not shown).
L417-418: be careful when describing the motion of cold air ‘as a density current’; you don’t have enough evidence
to make that specific claim. Instead you say something like ‘in a similar manner to a density current’ to be less
specific.
25 L418-420: not sure what you mean by equilibrium in this discussion. You need to be more specific here and
describe the important physical processes. Also, language like ‘...tends to show that...’ is too vague and should be
avoided.
> "As a density current" has been replaced by "in a similar manner to a density current". The expression "tends to show that"
has been removed. Here equilibrium referred to the fact that the propagation of the cold air located west of the quasi-stationary
30 front towards east appears countered by the low-level jet blowing perpendicularly to it.
This part has been rewritten: When wind speed decreased along CF1, the cold air west of CF1 started flowing eastwards,
towards the Mediterranean Sea, as a density current, spreading out circularly over the sea. This cold air rapidly flowing as soon
as the LLJ stops tends to show that an equilibrium maintaining CF1 quasi-stationary was reached between CF1 and the LLJ.
Then, the equilibrium progressively broke from south to north by the advance of CF2. When wind speed abruptly decreases
35 along CF1, CF1 stationarity breaks and the cold air west of CF1 immediately starts flowing eastwards in a similar manner to a
density current, and later spreads out circularly over the Mediterranean Sea (not shown). It indicates that, during the HPE, the
propagation of the cold air located west of CF1 is countered by the LLJ blowing perpendicularly to it, also in a similar manner
as the propagation of a cold pool can be countered by the environmental wind (Miglietta and Rotunno, 2014).
L465: replace “probably” with “likely”
13> The modification has been made.
L486-490: I don’t follow the argument. You say that backward trajectory analysis demonstrates that an increasing
number of low-level moist air parcels that have not crossed the Albera Massif are found inside convective cells on
the lee side of the mountain (i.e. originating on the lee side of the mountain, rather than further S-SE?). You then
5 follow on from that point and say the supply of conditionally unstable air parcels (from the S-SE) along the line is
continuous. Have I misunderstood, or do these two sentences contradict each other?
> The sentences were unclear. Parcels that do not cross the Albera Massif (which is at the S-SE) are carried by the south-eastern
LLJ and originate from the Mediterranean Sea, not from the lee side of the mountain. This part has been rewritten:
Because of the slight directional vertical wind shear simulated in the lower part of the troposphere (see wind direction
10 in Figs. 17a,c), the LLJ continuously supplies conditionally unstable air parcels to the convective cells formed from their
southeastern flank while these cells are advected by the south-southeastern mid-level wind. Backward trajectories starting
from their updrafts (not shown) show that once convective cells are on the lee side of the mountain, as they are advected
north-northwestwards, an increasing number of low-level moist air parcels that have not crossed the Albera Massif are found
inside the cells. Thus, the supply of conditionally unstable air parcels along the line is continuous and possibly explains the
15 maintenance of the convective cells long after they are formed.
once convective cells are on the lee side of the mountain, as they are advected by the south–south-eastern mid-level wind, the
south-eastern LLJ supplies conditionally unstable air parcels that do not cross the Albera Massif to the cells from their south-
eastern flank. Backward trajectories starting from their updraughts (not shown) indicate that the number of low-level moist
air parcels that do not cross the Albera Massif found inside the cells increases as they are advected. This supply mechanism
20 possibly explains the maintenance of the convective cells long after they are formed.
I like the final paragraph of Section 5, in which you summarise the role of the Albera Massif. Follow-up question:
is the topography of the Albera Massif only likely to play an important role when the wind direction is exactly as
in this event? If the wind direction was slightly different, would you expect a different region of orography to play
a more important role?
25 > Thank you!
Considering a Mediterranean air mass having a conditional instability similar to this case, if the wind direction was slightly
different and we are talking about the role on rainfall, we expect that the Albera Massif could still play an important role: Fig. 9
of Ducrocq et al. (2008) shows that the Albera Massif was a source of lifting in the 1999 Aude HPE (see the parcel n°1) while
the 500 hPa wind direction (Fig. 18 of Nuissier et al., 2008) was slightly further south than in 2018 (with also differences in
30 wind speed). Depending on the amplitude of wind direction changes, we indeed expect (i) a different region of orography to
play a more important role (ii) different interactions with other reliefs: e.g. if the mid-level wind had an easterly direction,
convective cells would be advected from the Albera Massif towards the highest reliefs of the Pyrenees (iii) different wind
shear between the ground and mid-levels, wind shear that may not be as favourable as in this 2018 case to the maintenance of
convective cells downstream of the Albera Massif.
35 Figure 19: confusing that the direction of the vertical cross section (A -> B) in panels (c) and (d) is reversed from
that in the virtual potential temperature plots in (a) and (b). It would make sense to reverse the orientation of the
x-axis in (c) and (d).
> You’re right, the orientation of the cross-section has been reversed in Fig. 19 and corresponding changes in the text have
been made.
40 L530: replace “This probably” with “This difference possibly”
> The modification has been made.
Figure 20: change the colour scale so that you can more easily distinguish between values around 60 to 80% and
those nearer 90% and above.
14> The colour scale has been changed.
The summary paragraph from L588-595 is well-written and nicely set out. However, I don’t think the statement
that Leslie’s remnants are involved in the formation of the cold front CF2 is backed up strongly enough by your
analysis. Modify the text to include more evidence supporting this statement, or remove it from the manuscript.
5 > Thanks! You’re right, the fact that Leslie’s remnants are involved in the formation of the cold front CF2 has been moved to
future work.
Technical corrections
Model domain notation. Use parent + child rather than father / mother.
> You’re right, father L226 has been replaced by parent.
10 L88: replace with “a small jet branch circumvented the cut-off low to the south”
> It has been replaced.
L100: “participated”? Not sure of its meaning here.
> It has been replaced by "contributed".
L138: “more reflectivities are observed”. Change to something like “an extended region of reflectivity > 12 dBZ
15 is observed...”
> Done, more reflectivities are observed has been replaced by an extended region of reflectivity >12 dBZ is observed
Figure 11: equivalent potential temperature above the surface is normally shown in K, not in °C.
> The modification has been made.
L452: replace “couples” with “couplets”
20 > The modification has been made.
Figure 15 is referenced in the text before Figure 14. Switch the order of the figures, or change the text.
> The order of figures has been switched.
Brackets need editing in some of your time interval labels in Table 2
> Hyphens have been replaced by commas to match standard interval notations. The first seven intervals are voluntarily right-
25 open as well as the last one is closed.
L484-485: “...slightly directional vertical wind shear...” do you mean that there is only a slight change in wind
direction with height? Replace “slightly” with “slight” if so.
> You’re right, it has been corrected.
L597-598: “Accurately tracking and representing the life cycle...”
30 > It has been corrected.
15References
Bell, S., D. Cornford, and L. Bastin, The state of automated amateur weather observations, Weather, 68(2), 36–41,
https://doi.org/10.1002/wea.1980, 2013.
Caumont, O., M. Mandement, F. Bouttier, J. Eeckman, C. Lebeaupin Brossier, A. Lovat, O. Nuissier, and O. Laurantin, The heavy precipita-
5 tion event of 14–15 october 2018 in the aude catchment: a meteorological study based on operational numerical weather prediction systems
and standard and personal observations, Natural Hazards and Earth System Sciences, 21(3), 1135–1157, https://doi.org/10.5194/nhess-
21-1135-2021, 2021.
Chapman, L., and S. J. Bell, High-Resolution Monitoring of Weather Impacts on Infrastructure Networks Using the Internet of Things,
Bulletin of the American Meteorological Society, 99(6), 1147–1154, https://doi.org/10.1175/BAMS-D-17-0214.1, 2018.
10 Chapman, L., C. Bell, and S. Bell, Can the crowdsourcing data paradigm take atmospheric science to a new level? A case study of
the urban heat island of London quantified using Netatmo weather stations, International Journal of Climatology, 37(9), 3597–3605,
https://doi.org/10.1002/joc.4940, 2017.
Chazette, P., et al., A multi-instrument and multi-model assessment of atmospheric moisture variability over the western mediterranean
during hymex, Quarterly Journal of the Royal Meteorological Society, 142(S1), 7–22, https://doi.org/10.1002/qj.2671, 2016.
15 Cosma, S., E. Richard, and F. Miniscloux, The role of small-scale orographic features in the spatial distribution of precipitation, Quarterly
Journal of the Royal Meteorological Society, 128(579), 75–92, https://doi.org/10.1256/00359000260498798, 2002.
Davolio, S., A. Volonté, A. Manzato, A. Pucillo, A. Cicogna, and M. E. Ferrario, Mechanisms producing different precipitation patterns
over north-eastern italy: insights from hymex-sop1 and previous events, Quarterly Journal of the Royal Meteorological Society, 142(S1),
188–205, https://doi.org/10.1002/qj.2731, 2016.
20 Davolio, S., S. D. Fera, S. Laviola, M. M. Miglietta, and V. Levizzani, Heavy precipitation over italy from the mediterranean storm “vaia” in
october 2018: Assessing the role of an atmospheric river, Monthly Weather Review, 148(9), 3571 – 3588, https://doi.org/10.1175/MWR-
D-20-0021.1, 2020.
de Vos, L. W., A. M. Droste, M. J. Zander, A. Overeem, H. Leijnse, B. G. Heusinkveld, G. J. Steeneveld, and R. Uijlenhoet, Hydrometeo-
rological monitoring using opportunistic sensing networks in the Amsterdam metropolitan area, Bulletin of the American Meteorological
25 Society, 101(2), E167–E185, https://doi.org/10.1175/BAMS-D-19-0091.1, 2020.
Di Girolamo, P., C. Flamant, M. Cacciani, E. Richard, V. Ducrocq, D. Summa, D. Stelitano, N. Fourrié, and F. Saïd, Observation of low-level
wind reversals in the gulf of lion area and their impact on the water vapour variability, Quarterly Journal of the Royal Meteorological
Society, 142(S1), 153–172, https://doi.org/10.1002/qj.2767, 2016.
Ducrocq, V., O. Nuissier, D. Ricard, C. Lebeaupin, and T. Thouvenin, A numerical study of three catastrophic precipitating events over
30 southern France. II: Mesoscale triggering and stationarity factors, Quarterly Journal of the Royal Meteorological Society, 134(630), 131–
145, https://doi.org/10.1002/qj.199, 2008.
Ducrocq, V., S. Davolio, R. Ferretti, C. Flamant, V. H. Santaner, N. Kalthoff, E. Richard, and H. Wernli, Introduction to the hymex special
issue on ‘advances in understanding and forecasting of heavy precipitation in the mediterranean through the hymex sop1 field campaign’,
Quarterly Journal of the Royal Meteorological Society, 142(S1), 1–6, https://doi.org/10.1002/qj.2856, 2016.
35 Duffourg, F., and V. Ducrocq, Assessment of the water supply to Mediterranean heavy precipitation: a method based on finely designed water
budgets, Atmospheric Science Letters, 14(3), 133–138, https://doi.org/10.1002/asl2.429, 2013.
Duffourg, F., K.-O. Lee, V. Ducrocq, C. Flamant, P. Chazette, and P. Di Girolamo, Role of moisture patterns in the backbuilding for-
mation of HyMeX IOP13 heavy precipitation systems, Quarterly Journal of the Royal Meteorological Society, 144(710), 291–303,
https://doi.org/10.1002/qj.3201, 2018.
40 Grams, C. M., and S. R. Blumer, European high-impact weather caused by the downstream response to the extratropical transition of north
atlantic hurricane katia (2011), Geophysical Research Letters, 42(20), 8738–8748, https://doi.org/10.1002/2015GL066253, 2015.
Hintz, K. S., C. McNicholas, R. Randriamampianina, H. T. P. Williams, B. Macpherson, M. Mittermaier, J. Onvlee-Hooimeijer, and B. Sz-
intai, Crowd-sourced observations for short-range numerical weather prediction: Report from ewglam/srnwp meeting 2019, Atmospheric
Science Letters, n/a(n/a), e1031, https://doi.org/10.1002/asl.1031, 2021.
45 Khodayar, S., B. Czajka, A. Caldas-Alvarez, S. Helgert, C. Flamant, P. Di Girolamo, O. Bock, and P. Chazette, Multi-scale observations
of atmospheric moisture variability in relation to heavy precipitating systems in the northwestern mediterranean during hymex iop12,
Quarterly Journal of the Royal Meteorological Society, 144(717), 2761–2780, https://doi.org/10.1002/qj.3402, 2018.
Lee, K.-O., C. Flamant, F. Duffourg, V. Ducrocq, and J.-P. Chaboureau, Impact of upstream moisture structure on a back-building con-
vective precipitation system in south-eastern france during hymex iop13, Atmospheric Chemistry and Physics, 18(23), 16,845–16,862,
50 https://doi.org/10.5194/acp-18-16845-2018, 2018.
16Lorenzo-Lacruz, J., A. Amengual, C. Garcia, E. Morán-Tejeda, V. Homar, A. Maimó-Far, A. Hermoso, C. Ramis, and R. Romero, Hydro-
meteorological reconstruction and geomorphological impact assessment of the October 2018 catastrophic flash flood at Sant Llorenç,
Mallorca (Spain), Natural Hazards and Earth System Sciences, 19(11), 2597–2617, https://doi.org/10.5194/nhess-19-2597-2019, 2019.
Mandement, M., and O. Caumont, Contribution of personal weather stations to the observation of deep-convection features near the ground,
5 Natural Hazards and Earth System Sciences, 20(1), 299–322, https://doi.org/10.5194/nhess-20-299-2020, 2020.
McNicholas, C., and C. F. Mass, Smartphone pressure collection and bias correction using machine learning, Journal of Atmospheric and
Oceanic Technology, 35(3), 523–540, https://doi.org/10.1175/JTECH-D-17-0096.1, 2018.
Meier, F., D. Fenner, T. Grassmann, M. Otto, and D. Scherer, Crowdsourcing air temperature from citizen weather stations for urban climate
research, Urban Climate, 19, 170 – 191, https://doi.org/10.1016/j.uclim.2017.01.006, 2017.
10 Miglietta, M. M., and R. Rotunno, Numerical simulations of sheared conditionally unstable flows over a mountain ridge, Journal of the
Atmospheric Sciences, 71(5), 1747–1762, https://doi.org/10.1175/JAS-D-13-0297.1, 2014.
Miltenberger, A. K., S. Pfahl, and H. Wernli, An online trajectory module (version 1.0) for the nonhydrostatic numerical weather prediction
model cosmo, Geoscientific Model Development, 6(6), 1989–2004, https://doi.org/10.5194/gmd-6-1989-2013, 2013.
Miniscloux, F., J. D. Creutin, and S. Anquetin, Geostatistical analysis of orographic rainbands, Journal of Applied Meteorology, 40(11),
15 1835–1854, https://doi.org/10.1175/1520-0450(2001)0402.0.CO;2, 2001.
Muller, C., L. Chapman, S. Johnston, C. Kidd, S. Illingworth, G. Foody, A. Overeem, and R. Leigh, Crowdsourcing for cli-
mate and atmospheric sciences: current status and future potential, International Journal of Climatology, 35(11), 3185–3203,
https://doi.org/10.1002/joc.4210, 2015.
Napoly, A., T. Grassmann, F. Meier, and D. Fenner, Development and application of a statistically-based quality control for crowdsourced
20 air temperature data, Frontiers in Earth Science, 6, 118, https://doi.org/10.3389/feart.2018.00118, 2018.
Nipen, T. N., I. A. Seierstad, C. Lussana, J. Kristiansen, and Ø. Hov, Adopting Citizen Observations in Operational Weather Prediction,
Bulletin of the American Meteorological Society, 101(1), E43–E57, https://doi.org/10.1175/BAMS-D-18-0237.1, 2020.
Nuissier, O., V. Ducrocq, D. Ricard, C. Lebeaupin, and S. Anquetin, A numerical study of three catastrophic precipitating events over
southern France. I: Numerical framework and synoptic ingredients, Quarterly Journal of the Royal Meteorological Society, 134(630),
25 111–130, https://doi.org/10.1002/qj.200, 2008.
Pantillon, F., J.-P. Chaboureau, and E. Richard, Remote impact of north atlantic hurricanes on the mediterranean during episodes of intense
rainfall in autumn 2012, Quarterly Journal of the Royal Meteorological Society, 141(688), 967–978, https://doi.org/10.1002/qj.2419,
2015.
Ricard, D., V. Ducrocq, and L. Auger, A Climatology of the Mesoscale Environment Associated with Heavily Precipitating Events over a
30 Northwestern Mediterranean Area, Journal of Applied Meteorology and Climatology, 51(3), 468–488, https://doi.org/10.1175/JAMC-D-
11-017.1, 2012.
Santurette, P., and A. Joly, ANASYG/PRESYG, Météo-France’s new graphical summary of the synoptic situation, Meteorological Applica-
tions, 9(2), 129–154, https://doi.org/10.1017/S1350482702002013, 2002.
Schär, C., and H. Wernli, Structure and evolution of an isolated semi-geostrophic cyclone, Quarterly Journal of the Royal Meteorological
35 Society, 119(509), 57–90, https://doi.org/10.1002/qj.49711950904, 1993.
Waller, J. A., Editorial: The use of unconventional observations in numerical weather prediction, Meteorological Applications, 27(5), e1948,
https://doi.org/10.1002/met.1948, 2020.
17You can also read