A new method of inferring the size, number density, and charge of mesospheric dust from its in situ collection by the DUSTY probe - Atmos. Meas. Tech
←
→
Page content transcription
If your browser does not render page correctly, please read the page content below
Atmos. Meas. Tech., 12, 1673–1683, 2019
https://doi.org/10.5194/amt-12-1673-2019
© Author(s) 2019. This work is distributed under
the Creative Commons Attribution 4.0 License.

A new method of inferring the size, number density, and charge of
mesospheric dust from its in situ collection by the DUSTY probe
Ove Havnes1 , Tarjei Antonsen1 , Gerd Baumgarten2 , Thomas W. Hartquist3 , Alexander Biebricher4 ,
Åshild Fredriksen1 , Martin Friedrich5 , and Jonas Hedin6
1 Institute
          of Physics and Technology, Arctic University of Norway, Tromsø, Norway
2 Leibniz-Instituteof Atmospheric Physics, Rostock University, Kühlungsborn, Germany
3 School of Physics and Astronomy, University of Leeds, Leeds LS2 9JT, UK
4 Norwegian Center for Space-related Education, 8480 Andenes, Norway
5 Graz University of Technology, 8010 Graz, Austria
6 Department of Meteorology, Stockholm University, 10691 Stockholm, Sweden

Correspondence: Ove Havnes (ove.havnes@uit.no)

Received: 6 July 2018 – Discussion started: 3 September 2018
Revised: 11 February 2019 – Accepted: 27 February 2019 – Published: 15 March 2019

Abstract. We present a new method of analyzing measure-          1   Introduction
ments of mesospheric dust made with DUSTY rocket-borne
Faraday cup probes. It can yield the variation in fundamental    The Earth’s mesosphere has for a long time been the least
dust parameters through a mesospheric cloud with an alti-        known part of the Earth’s atmosphere, and it probably still is.
tude resolution down to 10 cm or less if plasma probes give      One reason for this is its inaccessibility to direct in situ ob-
the plasma density variations with similar height resolution.    servations – it being too high for balloons and planes and too
A DUSTY probe was the first probe that unambiguously de-         low for satellites. Its main cloud phenomena, the noctilucent
tected charged dust and aerosol particles in the Earth’s meso-   clouds (NLCs), which occur in its polar regions, were first
sphere. DUSTY excluded the ambient plasma by various bi-         observed in 1885 (Jesse, 1885; Backhouse, 1885; Symons,
ased grids, which however allowed dust particles with radii      1888; Gadsden and Schröder, 1989). They are the highest-
above a few nanometers to enter, and it measured the flux        altitude clouds in the Earth’s atmosphere. It now appears that
of charged dust particles. The flux measurements directly        the NLC occurrence frequency is increasing with time and
yielded the total ambient dust charge density.                   that the NLCs spread further away from the poles with time
   We extend the analysis of DUSTY data by using the im-         (DeLand et al., 2007; Lübken et al., 2018), possibly due to
pact currents on its main grid and the bottom plate as before,   changes in the composition of trace elements, like water va-
together with a dust charging model and a secondary charge       por, in the mesosphere region. As such, one reason for the
production model, to allow the determination of fundamental      interest to understand the mesosphere is that it may be an
parameters, such as dust radius, charge number, and total dust   indicator of climatic changes in the troposphere and strato-
density. We demonstrate the utility of the new analysis tech-    sphere (Thomas, 1996). Another reason is that the meso-
nique by considering observations made with the DUSTY            sphere is the transition zone between outer space and the
probes during the MAXIDUSTY rocket campaign in June–             lower part of the atmosphere, where energetic particle pre-
July 2016 and comparing the results with those of other in-      cipitation, meteors, and UV radiation normally deposit most
struments (lidar and photometer) also used in the campaign.      of their energy. Disturbed magnetosphere conditions, with
In the present version we have used monodisperse dust size       high energy particle precipitation, can create large numbers
distributions.                                                   of reactive NOx molecules, which, when transported down-
                                                                 wards, react with and reduce the ozone content (Reddman
                                                                 et al., 2013). Also, there is an influx of meteorites into the
                                                                 Earth’s atmosphere, the total mass of which has been claimed

Published by Copernicus Publications on behalf of the European Geosciences Union.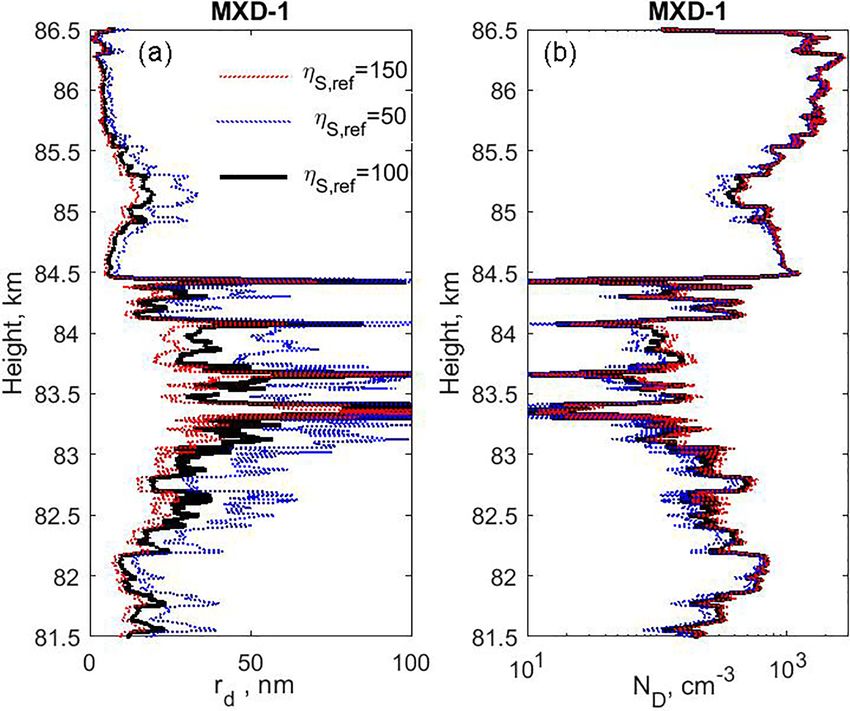
1674                                    O. Havnes et al.: Mesospheric dust from its in situ collection by the DUSTY probe

to be from 4 to 300 t day−1 (Plane, 2012; Asmus et al., 2015;
Carrillo-Sánchez et al., 2016). Many of the meteorites evap-
orate as they are heated due to air friction when they enter
the atmosphere, and the evaporated material recondenses and
creates nanometer-sized particles, the meteoric smoke parti-
cles (MSPs) (Rosinski and Snow, 1961; Hunten et al., 1980;
Hervig et al., 2017). The MSPs are thought to be crucial in
creating NLCs, where they probably act as condensation sites
for water vapor to form the larger icy NLC particles, but ho-
mogeneous condensation may also be part of the cause of this
(Turco et al., 1982; Rapp and Thomas, 2006). In the growth        Figure 1. The design of the DUSTY probe used in the
process the icy NLC particles, growing by water vapor con-        MAXIDUSTY campaign. The fractional coverage of the different
                                                                  grids, relative to the total probe cross section, are σ0 = σ1 = 0.046
densing on them, also capture MSPs, so that NLC particles
                                                                  and σ2 = 0.235. The electric potentials of all the grids and the bot-
will have MSPs embedded in them (Havnes and Naesheim,             tom plate are relative to the payload potential 8P . The currents are
2007; Havnes et al., 2009; Hervig et al., 2012, 2017). It also    measured on G1, G2, and BP but not on G0.
appears that the MSPs, when transported downwards, can in-
fluence the cloud formation in the stratosphere and possibly
also the troposphere (Ogurtsov and Raspopov, 2011).
   In order to understand the mesosphere it is crucial to un-     spectrometer (Knappmiller et al., 2008; Amyx et al., 2008;
derstand the evolution and role of various types of dust parti-   Robertson et al., 2009, 2014). The MUDD (Multiple Dust
cles in it, such as the icy NLCs and polar mesospheric sum-       Detector) finds the mass distribution of the collision frag-
mer echo (PMSE) particles, and MSPs that are probably also        ments of the icy NLC particles and relates this to the mass
present in the winter mesosphere to create the weak radar         distribution of embedded MSP (Havnes et al., 2014; Anton-
PMWE (polar mesospheric winter echo) clouds (Czechovsky           sen and Havnes, 2015; Antonsen et al., 2017).
et al., 1979; Zeller et al., 2006; Latteck and Strelnikova,          In spite of the progress made with rocket instrumenta-
2015). The progress in ground-based instrumentation and           tion, there is a lack of high-time-resolution and high-space-
observing techniques during the last few decades has been         resolution instruments to measure parameters such as dust
impressive. For example, lidars now routinely observe in          size, number density, and charge. In the present paper we
full daylight to determine NLC particle sizes and densities       consider the principles of the much used DUSTY impact
(Baumgarten et al., 2007), and they also measure the metal-       probe (Havnes et al., 1996a) and how its performance can
lic content in the mesosphere (Huang et al., 2015) and meso-      be improved. The DUSTY probe, the principle of which is
spheric temperatures (Höffner and Lautenbach, 2009). The          shown in Fig. 1, is equipped with three grids, G0, G1, and
powerful new mesosphere–stratosphere–troposphere (MST)            G2. The grid G1 prevents ambient plasma from reaching G2
radar MAARSY with its large increase in sensitivity has pro-      and the bottom plate BP but allows dust particles to enter and
foundly changed our knowledge of PMSE occurrence rates            collide with the grids and the BP. The potentials of the grids
and the altitude ranges in which they can be found (Latteck       are given in Fig. 1. The observed currents to the probe were
and Strelnikova, 2015). Satellites have identified MSP cloud      originally used to find only the dust charge density of the
layers by observing along them (Hervig et al., 2009) and have     ambient dust cloud, but in the present paper we will show
also confirmed earlier predictions (Havnes and Næsheim,           how to extend the analysis of the DUSTY probe currents
2007; Havnes et al., 2009; Kassa et al., 2012) that MSPs are      to allow it to also determine other dust parameters. The ex-
embedded in the icy NLC and PMSE particles with 0.01 to           tension of the original method of analysis is based on ear-
3 % by volume (Hervig et al., 2012).                              lier works, which have demonstrated the importance of sec-
   One of the obvious advantages of the ground-based instru-      ondary charge and secondary current production in glancing
mentation and satellites is that they can observe the meso-       dust impacts on rocket probes and payload bodies (Havnes
spheric clouds continuously. However, they have a limited         and Næsheim, 2007; Havnes et al., 2009; Kassa et al., 2012).
space resolution (ca. 100 m and upwards) and time resolu-            In Sect. 2 we extend the earlier analysis method for the
tion (seconds and upwards). Rocket instrumentation, how-          DUSTY impact probe and now use the currents to G2 and BP
ever, hand, although presenting only a snapshot of the con-       to find not only the dust charge density as before but also the
ditions along its trajectory, observes with a time resolution     total dust density, the dust radius, and the mean dust charge.
typically of ∼ 10−3 to 10−4 s, corresponding to a spatial res-    In Sect. 3 we show the values for dust density and dust ra-
olution of ∼ 0.1 to 1 m. Various rocket probes are developed      dius from this new method, used for the observations by the
to observe the plasma conditions (Friedrich and Rapp, 2009),      DUSTY probe on the payload MXD-1, which was launched
the dust charge density (Havnes et al., 1996a), and the total     on 30 June 2016 at 09:43:18 UT in the MAXIDUSTY rocket
density of small dust (MSP) using a flashing technique (Rapp      campaign (Havnes et al., 2019). In Sect. 4 we compare the
and Strelnikova, 2009) while MASS is a coarse dust mass           DUSTY results with those from the RMR lidar at Andøya

Atmos. Meas. Tech., 12, 1673–1683, 2019                                              www.atmos-meas-tech.net/12/1673/2019/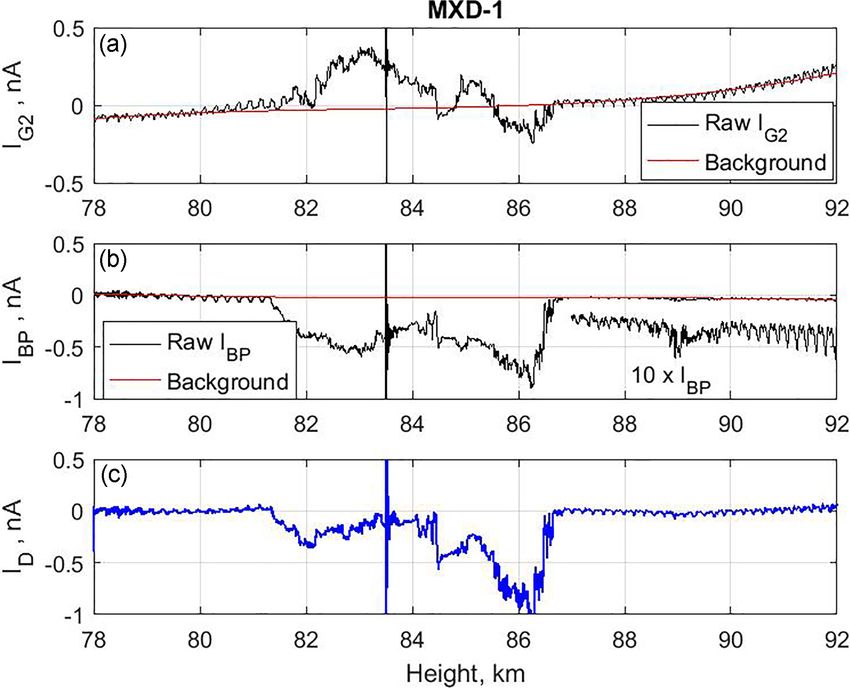
O. Havnes et al.: Mesospheric dust from its in situ collection by the DUSTY probe                                                 1675

(von Cossart et al., 1999; von Zahn et al., 2000; Baumgarten
et al., 2007) and the onboard MISU photometer (Gumbel et
al., 2001; Hedin et al., 2008; Megner et al., 2009) and con-
clude the paper in Sect. 5.

2   The extended analysis of dust observations made
    with DUSTY type Faraday cup probes

The DUSTY probe (Havnes et al., 1996a; Havnes and
Næsheim, 2007), the design of which is shown in Fig. 1,
has grids G0, G1, and G2 and a solid bottom impact plate
BP. The probe must point forward along the payload axis.
The dust impact currents to G1, G2, and BP are all registered
but not the current to G0, which is at the payload potential
8P . The registered currents are IG1 , IG2 , and IBP . The cur-
rent IG1 will not be used in the analysis. It is the grid that
is most influenced by effects like payload charging and the
plasma environment and as such not directly connected to            Figure 2. The ratio of the currents to G2 and BP in panel (a)
the measurements of dust. G0 and G1 are made of thin cylin-         compared to the current ID in panel (b). The large disturbance at
drical wires and they each cover only 4.6 % of the opening          ∼ 83.5 km in altitude is caused by a squib being fired to open for
                                                                    another experiment on the payload. The values of R, at and out-
cross section of DUSTY. G2 is made of thicker wires to in-
                                                                    side the borders of the cloud, at 81.36 and 86.85 km in height, are
crease the secondary charging effect. It covers 23.5 % of the
                                                                    to be neglected since the dust density there is low or zero and R is
DUSTY cross section.                                                therefore dominated by noise and uncertainties in their background
   The dust current into the probe in front of G2 is desig-         level.
nated ID and is part of the expressions for the total current
IG2 measured on G2,
                                                                    and G1. The current ITotal into the probe just above G0 can be
IG2 = σ2 ID + IS ,                                           (1)    expressed as ITotal = ID (1−σ0 )−2 = 1.1×ID , which directly
                                                                    gives us the observed ambient dust charge density 6(NZ ZD )
and for IBP measured on the BP.                                     from the relationship
                                                                                        X
IBP = (1 − σ2 ) ID − IS                                      (2)    ITotal = π Rp2 VR e  (NZ ZD ).                             (4)
The current to G2 is made up of σ2 ID , which is the part of        Here Rp is the probe radius, and e = 1.6 × 10⁻¹⁹ C. The
ID that hits G2 and deposits its charge, plus the secondary         number density of dust particles with charge number ZD is
current IS , which is produced by glancing dust impacts on          NZ and the rocket P  velocity is VR . We should note that the
G2, which rubs off electrons from it. If this last process is ef-   dust charge density (NZ ZD ), which can be extracted from
fective it can lead to the total current IG2 becoming positive      Eq. (4) is independent of the model for secondary production
even if the impacting dust particles are charged negatively.        of charge since this cancels in Eq. (3).
The current IBP to the bottom plate is made up of the direct           Some information on the expected size of the dust par-
hits on to BP by the dust that was not hitting G2 and minus         ticles, and the role of secondary charge production, can be
the secondary current IS . The electrons that are rubbed off        found from examining the ratio
from G2, producing a positive current IS to G2, will be de-
posited on BP and create a negative current -IS there. We can            IG2      σG2 ID + IS
                                                                    R=       =                    .                                 (5)
eliminate IS to find ID by                                               IBP   (1 − σG2 ) ID − IS
                                                                                                                         σG2
ID = IG2 + IBP .                                             (3)    This ratio R should have values between R = 1−σ        G2
                                                                                                                              = 0.31
                                                                    when the secondary charging current IS → 0 and R = −1 for
The two upper grids G0 and G1 are made of thin wires and            IS  ID . In Fig. 2 we show R and ID as functions of altitude.
each cover only 4.6 % of the DUSTY cross section (Fig. 1).          It is reassuring that R, even though it varies significantly with
Many of the small negatively charged fragments produced             altitude, stays so well within the above limits. This has been
on them by impacts will be stopped by air friction and probe        shown to also be the case in several earlier launches of the
internal electric fields (Antonsen et al., 2017). We therefore      DUSTY probe (Havnes and Næsheim, 2007; Havnes et al.,
neglected a possible contribution of their secondary produc-        2009).
tion to the currents to G2 and BP. However, they will together          We see from Fig. 2a that the ratio R is dominated by sec-
stop ∼ 9.2 % of the incoming dust current from passing G0           ondary charging effects in the middle of the NLC cloud sys-

www.atmos-meas-tech.net/12/1673/2019/                                                  Atmos. Meas. Tech., 12, 1673–1683, 2019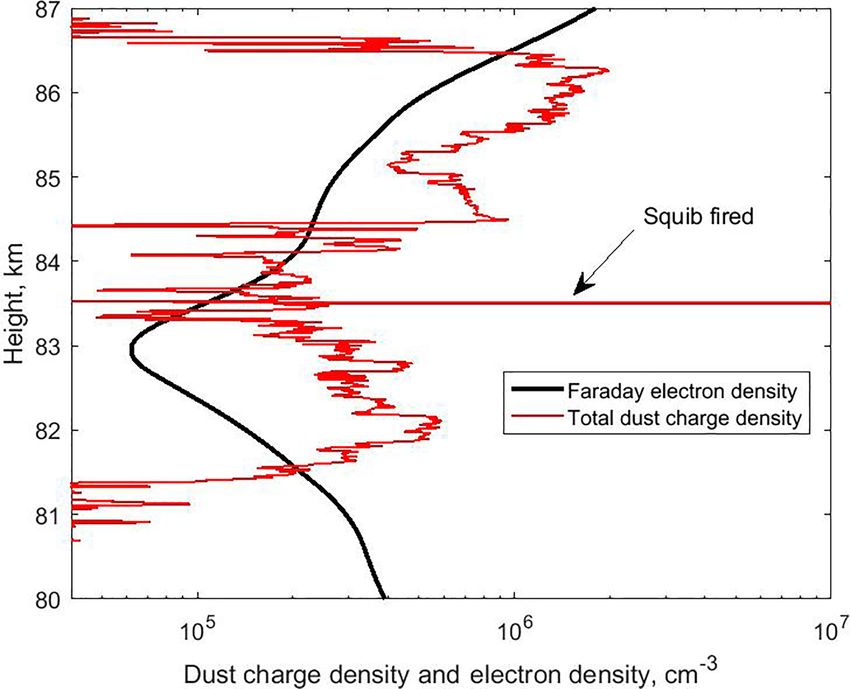
1676                                     O. Havnes et al.: Mesospheric dust from its in situ collection by the DUSTY probe

tem at ∼ 82.5 to ∼ 84.4 km, while at the upper edge around         NLC or PMSE icy particle can contain up to 10 to 30 MSPs
86 km secondary charging is not very significant. This is in       if the MSP sizes are in the range of 0.7 to 1 nm.
accordance with a scenario in which small cloud particles              The secondary production, the number of charged frag-
normally can be expected to be found in the upper parts of         ments produced by one impacting NLC or PMSE particle of
the clouds (Robertson et al., 2009), from where they sink          radius rd , varies with the cross section of the impacting par-
and grow, to reach maximum sizes in the middle regions of          ticle as
the clouds. In the lower parts, melting should lead to a re-
duction of the icy dust particle sizes and a release of embed-     ηS (rd ) = ηS,ref (rd /rd,ref )2 .                         (6)
ded MSPs. Laboratory studies of impacts of small ice par-          Havnes and Næsheim (2007) found that for a reference icy
ticles below a diameter of ∼ 14 nm, at impact velocities of        dust particle, of radius rd,ref = 50 nm a number of ηS,ref = 50
∼ 1400 m s−1 , indicate that the secondary production is pro-      to 100 negative unit charges would be released. With 3 %
portional to the cross section of the impacting ice particle       MSP volume filling factor (Hervig et al., 2012) this corre-
(Tomsic, 2001). Since the charge on a dust particle at given       sponds to that ∼ 1 % of the embedded MSPs become charged
plasma conditions is roughly proportional to its radius, and       fragments, if we set the embedded MSP radius to 1 nm.
since the cross section is proportional to the square of the ra-      We can now express the secondary current IS by using
dius, a significant secondary current (R < 0) indicates large      Eq. (6) and with knowledge of how large the fraction of
particles, while small secondary production (R > 0) indicates      the grid wires that contribute to the secondary charge pro-
small dust particles. We will later show that this is what we      duction is. In the modeling by Havnes and Næsheim (2007)
get for the dust size from the extended method.                    they found that secondary charges are produced on a fraction
   The secondary charging, or the rubbing-off effect by im-        σ2,sec ∼ 0.28 of the G2 grid diameter, where the total area of
pacting dust on surfaces, is strongly dependent on the impact      G2 in MXD-1 covers a fraction σ2 = 0.235 of the total probe
angle θi , the angle between the surface normal and the di-        cross section σP = π RP2 . The probe radius is RP = 0.04 m.
rection to the impacting particle. The impact angle θi will be     From this we can express the secondary charge current as
zero for impacts at the top of a grid wire and 90◦ for a glanc-
ing impact at the extreme side of a wire. In experiments with      IS = eND VR Asec ηS (rd ).                                 (7)
ice particles (Tomsic, 2001) the maximum of the secondary
production probably was at an impact angle θi of ∼ 80◦ ,           Here ND = 6NZ , the total dust number density, and Asec =
the highest impact angle used in the experiments, or slightly      σ2,sec σ2 σP is the effective area of the probe for secondary
above. It should be reduced to 0 at 90◦ . Little secondary         charge production. This is only ∼ 7 % of the total probe cross
charge production took place below θi ∼ 65 to 70◦ . This           section σP . The observed secondary charge current IS is also
means that of the dust particles impacting on the cylindri-        found from Eqs. (1) and (2) as
cal grid wires, only a fraction will rub off electrons from the    IS = (1 − σ2 )IG2 − σ2 IBP .                               (8)
grid. Havnes and Næsheim (2007) analyzed, in detail, the ro-
tational effect on the currents to the grids of a DUSTY probe,     Inserting Eq. (6) into Eq. (7) we can solve Eqs. (7) and (8)
launched in the summer of 1994 (Havnes et al., 1996a). They        for the dust radius.
found that a substantial secondary charge production was
                                                                       rd 2 (1 − σ2 ) IG2 − σ2 IBP

needed to model the payload rotational effects on the grid                    =                                             (9)
impact currents. The effect of secondary charging has since          rd,ref        Asec ηS,ref eND VR
been mapped in several other rocket flights (Havnes et al.,        Fixing the values for ηS,ref and rd,ref , the only unknown pa-
2009, 2014; Kassa et al., 2012; Antonsen and Havnes, 2015;         rameter on the right-hand side is the total dust number den-
Antonsen et al., 2017). One result of the analysis of the sec-     sity ND . If this is also known, we can find the dust radius
ondary impact effects of NLC particles on the main grids of        from Eq. (9). However, the value of ND is not directly avail-
DUSTY-type probes was that it had to be much more effi-            able but can be found in an iteration process that includes a
cient than what has been found for impact of ice particles in      charging model for the dust. One should be aware that our
laboratory experiments. A probable reason for this difference      charging model, in which we use monodisperse dust sizes at
is most likely connected to the fact that pure laboratory ice      each height, will most likely result in the inferred (average)
particles below ca 7 nm have a tendency to stick to the impact     dust radius rd being larger than the true average size for a
surface and evaporate (Tomsic, 2001). Conversely, the NLC          distribution of dust sizes. We will address this in more detail
and PMSE icy particles, containing a substantial number of         in the discussion.
embedded MSPs (Hervig et al., 2012; Havnes and Næsheim,               The charging model computes the equilibrium charge dis-
2007), will partly fragment on impact and MSPs that are re-        tribution of the ambient dust particles. The electron density
leased will not evaporate but survive to carry away rubbed-        ne (Fig. 9) is measured by various probes on the payload. We
off electrons. With a MSP volume filling factor of up to 3 %       require charge neutrality and find the ion density ni from
in a NLC or PMSE particle (Hervig et al., 2012), even a 7 nm                  X
                                                                   ni − ne +      NZ ZD = 0.                                 (10)

Atmos. Meas. Tech., 12, 1673–1683, 2019                                                  www.atmos-meas-tech.net/12/1673/2019/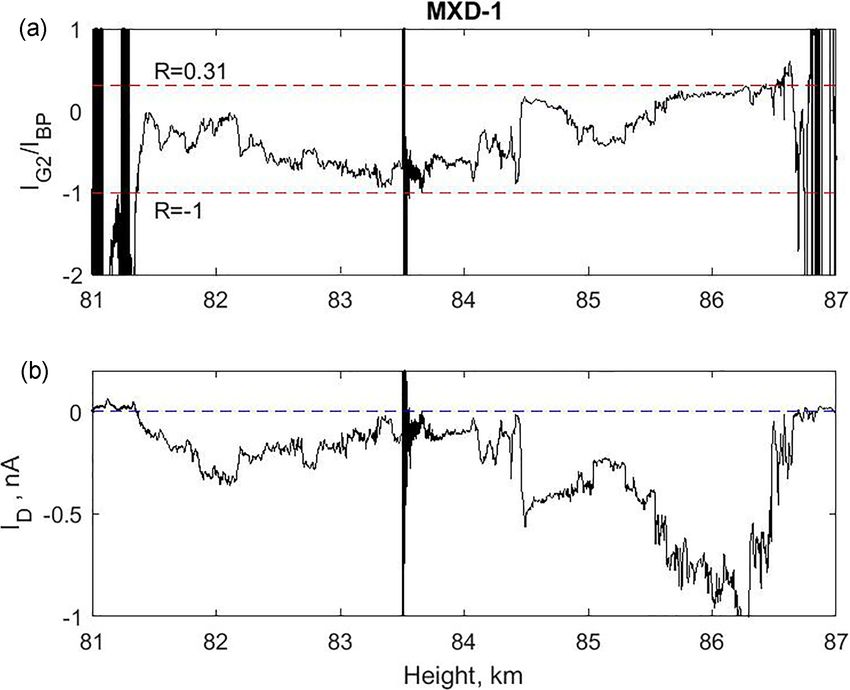
O. Havnes et al.: Mesospheric dust from its in situ collection by the DUSTY probe                                                   1677

The plasma temperature is equal to the neutral temperature
and we will use a temperature of 150 K. For our equilibrium
charging model we require that the rate at which dust parti-
cles of charge Z are given the charge number (Z − 1) by an
electron colliding with it and sticking to it is equal to the rate
by which dust with charge number (Z − 1) is given charge
number Z by ions colliding and sticking to it:

NZ Je (Z) = NZ−1 Ji (Z − 1).                                 (11)

Here Je (Z) and Ji (Z) are the rates at which charged parti-
cles (electrons or ions) arrive at the surface of a dust particle
with charge number Z and stick to it. We have used the ex-
pressions for Je and Ji from Draine and Sutin (1987), which
include the short range polarization forces, and refer to that
paper for the full expressions.
    The iteration procedure to extract values for dust radius
rd , dust total density ND , and also the dust charge distri-
bution NZ , together with other relevant parameters depen-           Figure 3. The smoothed currents IG2 and IBP and the assumed
dent on rd and ND , starts with a guess for the average dust         background currents are shown in panels (a) and (b). In panel (c)
                                                                     we show the ID current based on the currents IG2 and IBP , cor-
charge number Zav . A good guess is normally Zav = −1.
                                                                     rected for background. The “event” at ∼ 83.5 km is due to a squib
This will give
            P an initial value for P the total dust number den-
                                                                     being fired to open another instrument on the payload. In panel (b)
sity ND = (NZ ZD )/Zav . Here (NZ ZD ) is the observed               we have also plotted a current 10 × IBP to emphasize that there is
dust charge density found from Eq. (4). From this value of           a clear but weak dust structure at least spanning the altitude region
ND we calculate a value for the dust radius from Eq. (9).            from ∼ 88.5 to ∼ 89.9 km.
These approximations to ND and rd are now used in the
charging model, together with known values for the plasma
parameters, to calculate a new total dust number density and
                                                                     and may be affected by the airstream around the payload and
a new average dust charge number, which is used to find a
                                                                     by the payload rotation.
new value for rd . This process is repeatedly run through the
                                                                        In Fig. 4 we show the inferred values for dust radius rd
charging code until it converges to a solution.
                                                                     and ND for three values of the secondary charge efficiency
                                                                     ηS,ref = 50, 100, and 150. The large noise signals around
3   Measurements by the DUSTY probe on                               ∼ 83.5 km in Figs. 2 and 3, which were caused by a squib
    MAXIDUSTY-1, analyzed with the extended method                   being fired, have been removed. The other four narrow and
                                                                     strong features in the middle of the cloud region (∼ 83.3
We now use the observations by the DUSTY probe on MXD-               to ∼ 84.5 km) indicate the presence of dust layers, or “dust
1 and the new extended method to find the basic dust param-          voids”, with much larger dust sizes than just outside these
eters: radius rd , total density ND , and average dust charge        layers.
number Zav throughout the observed NLC and PMSE clouds.                 In our calculations we have focused on the value ηS,ref =
The electron data are taken from the results by the onboard          100 and find uncertainties in rd and ND based on changes
Faraday instrument (Friedrich and Rapp, 2009). In Fig. 3 we          in secondary production efficiency, as shown in Fig. 4. The
show smoothed raw currents IG2 and IBP and the adopted               results are in best accordance with the lidar results for high
background that will be subtracted from the raw currents             values of ηS,ref .
to give the net currents. The curves show that the main                 The dust sizes just outside the narrow layers range from
cloud system extends from ∼ 81.3 to ∼ 86.8 km with a clear           ∼ 10 to ∼ 40 nm for ηS,ref > 100. The values for rd in these
but weak additional dust cloud layer between ∼ 88.5 and              four narrow layers with large dust particles are probably con-
∼ 89.9 km, which is also shown in Fig. 3b, multiplied by a           siderably more uncertain than in most other parts of the NLC
factor of 10. We are unable to say if this consists of icy dust      and PMSE cloud. The reason for this is that these four layers
particles or MSPs. We see indications that a weak structure          (voids) have a very low dust density ND , much lower than
also extends below 81.3 km, possibly down to ∼ 80 km. This           in the regions just outside the layers. We can see this from
is apparent mainly in Fig. 3a in which there is a weak IG2 in        Figs. 2 and 3 in which the current ID is very low within the
this interval and the payload rotation effect is different above     four layers and therefore the dust density ND will also be low.
and below 80 km, possibly indicating the presence of small           This is directly evident from Fig. 4, which shows both rd and
MSPs in the size range of up to several nanometers. They             ND . The narrow layers with the large increase in dust sizes
may have been released by melting of the larger icy particles        rd also have low dust densities, for which ND can be down

www.atmos-meas-tech.net/12/1673/2019/                                                   Atmos. Meas. Tech., 12, 1673–1683, 2019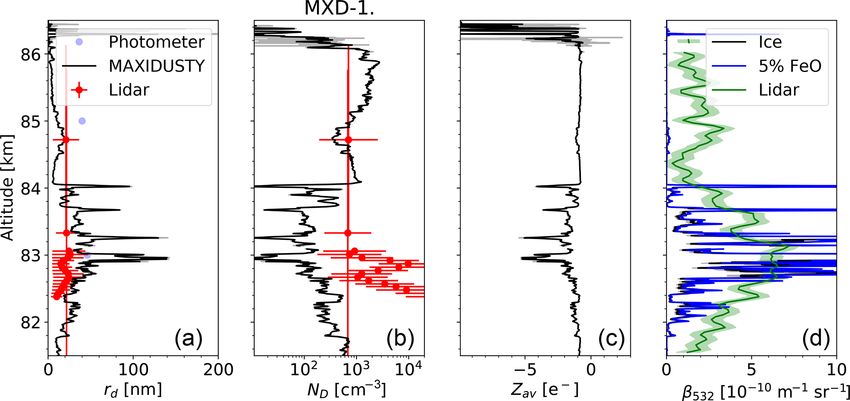
1678 O. Havnes et al.: Mesospheric dust from its in situ collection by the DUSTY probe
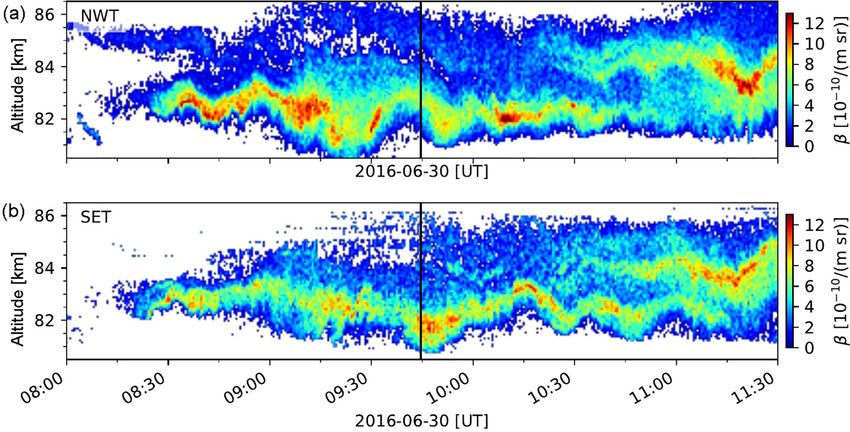
to the payload trajectory where the separation of the lidar
and rocket measurements was less than 2 km. The second li-
dar performed measurements above the lidar station at about
18 km separated from MXD-1 measurements. At both loca-
tions a double layer was observed and both layers show up
and downward motion indicating small-scale perturbations
of the atmosphere. The size of the particles is calculated
from the signal of three wavelengths assuming a distribution
of needle- and plate-like particles of multiple sizes (Baum-
garten et al., 2007). The size values given here are radii of a
volume-equivalent sphere and give the mode of a Gaussian
distribution of particle sizes.
The side-looking MISU NLC photometer on board the
payload also detected a two-layer NLC with an altitude pro-
file very similar to the one in Fig. 5 at the time of the rocket
measurement. Comparing the angle dependence of the scat-
tering of sunlight on the NLC particles to theoretical Mie
scattering phase functions, one can find an effective opti-
Figure 4. The inferred dust radius rd and dust density ND within cal scattering radius, rEff , of the particles in the NLC us-
the main cloud for the three values of the secondary charge effi- ing a monodisperse size distribution. This method is biased
ciency as given in panel (a). We have applied a moderate sliding towards the largest particles due to the very strong depen-
mean smoothing over 100 data points, changing the altitude resolu-
dence of scattering on dust radius. Below the layer, measur-
tion from 0.1 m in the observed data points to 10 m. We have also
ing the entire vertical extent of the NLC, the effective ra-
removed the signals in the altitude region of 83.5 to 83.55 km, which
is dominated by strong noise from the squib firing, shown in Figs. 2 dius rEff = 46 (±4) nm. As we ascend through the NLC, the
and 3. retrieved particle radius decreases with increasing altitude
and the effective optical scattering radius in the top layer is
40(±8) nm.
to ∼ 10 cm−3 . At such low values for the dust density, the The two extended layers in Fig. 5, centered on ∼ 83 and ∼
dust radius rd computed by Eq. (9) can be much affected by 85 km, also coincide with two layers at the same altitudes at
noise fluctuations in the signals, payload rotational effects, which layers were detected with DUSTY. For DUSTY each
and uncertainties in the assumed background currents. This of the two layers is characterized by containing large dust
will lead to relatively large uncertainties in ND and therefore particles of low number density. This demonstrates again the
also in rd when computed with Eq. (9). The narrow layers or strong dependence of scattering of light on the dust radius,
voids in NLC and PMSE clouds will probably still exist (see increasing very rapidly with size so that layers of low density
also Havnes et al., 1996b) and contain large dust particles but but containing large dust particles can dominate the scatter-
their peak values may be questionable. ing.
In Fig. 6 we show the DUSTY results, for one set of sec-
ondary charging parameters, dust radius rd , total dust number
4 Comparison of the extended DUSTY method results density ND , and average dust charge number Zav . We also
with lidar and photometer results show RMR lidar results for 5 min centered on the MXD-1
measurements (09:44:36 UT) as well as the photometer mea-
As a test on the values of rd and ND found by the extended surements. The average dust particle size indicated by the li-
method, we compare with corresponding values found from dar measurements through the layer is 22 nm with a standard
the ALOMAR RMR lidar observations (von Zahn et al., deviation of 5 nm. The average width of the Gaussian size
2000; Baumgarten et al., 2007) and the onboard MISU pho- distribution is 8 nm. In the last panel we show the RMR lidar
tometer (Gumbel et al., 2001; Hedin et al., 2008; Megner et observations of NLC brightness for 30 s around 09:44:36 UT
al., 2009). compared with two model lidar profiles computed for dust
The ALOMAR RMR lidar is a twin-lidar system with parameters inferred from the DUSTY observations and for
two power lasers simultaneously emitting at the 1064, 532, the assumptions that the particles are pure ice or ice contam-
and 355 nm wavelengths and with two receiving telescopes inated with 5 % FeO, which is the upper limit used by Hervig
each with a 1.8 m primary mirror. The lidar can be op- et al. (2012). We find it surprising that the two cases are
erated all year and under daylight conditions. During the practically identical. The refractive index for mixture with
MAXIDUSTY-1 launch, one beam was pointed along the FeO was calculated using the effective medium approxima-
predicted payload trajectory at 85 km and one in the verti- tion (Garnett, 1904). We have excluded the data in the alti-
cal direction. In Fig. 5 we show the RMR observations close
Atmos. Meas. Tech., 12, 1673–1683, 2019 www.atmos-meas-tech.net/12/1673/2019/O. Havnes et al.: Mesospheric dust from its in situ collection by the DUSTY probe 1679 Figure 5. Backscatter coefficient (532 nm) measured by the RMR lidar along the payload trajectory of MXD-1 (a) and about 18 km to the southeast of the trajectory (b). The time of the rocket penetrating through the NLC layer is marked by the vertical black line. Figure 6. Panels (a)–(c) show results for rd , ND , and Zav for an assumed value of ηS,ref = 100. RMR lidar results are marked by red dots while the two blue dots at 83 and 85 km are for the MISU photometer. Panel (d) shows the observed lidar altitude profile in which the black curve shows model results computed based on the MAXIDUSTY data of panels 1 and 2 and the assumption of pure ice particles, and the blue curve shows results based on the assumption that the ice particles contain 5 % FeO. The green shaded area indicates the measurement uncertainty. tude region from ∼ 83.5 to ∼ 83.7 km that were affected by Hervig et al., 2012). The highest dust number density, close the squib event. to 2 × 103 cm−3 , is found in this region. In the middle of the The variations in the DUSTY results for rd , ND , and Zav cloud the dust sizes, outside the narrow dust voids, have in- seem qualitatively reasonable. At the top of the cloud above creased to a maximum value of around 40 nm and a number ∼ 84 km, we find the smallest dust particles with sizes rd density of around 102 cm−3 . The lidar and DUSTY values generally below ∼ 20 nm, sometimes down to a few nanome- for the dust radius agree well at one point, at ∼ 83.3 km, but ters. The one measurement by the lidar in this height re- the dust number density ND found by DUSTY is a factor gion is taken at the height at which the dust particles in this of roughly ∼ 2 to ∼ 4 lower than the lidar values. The dust layer have their maximum size. The lidar and DUSTY re- radius becomes smaller further down into the bottom parts sults for the dust radius and dust number density agree very of the cloud with values of rd down to ∼ 20 nm and num- well. The MISU photometer indicates larger dust particles ber densities up to ∼ 6 × 102 cm−3 . The dust radius rd from than DUSTY. The dust particles in this upper layer have DUSTY is roughly a factor of 2 larger than the corresponding presumably been created recently and now grow by depo- lidar radius while the dust number density ND from DUSTY sition of water vapor that freezes out on their surface. They can be lower by a factor of 10 or more. also contain embedded MSPs (Havnes and Næsheim, 2007; www.atmos-meas-tech.net/12/1673/2019/ Atmos. Meas. Tech., 12, 1673–1683, 2019
1680                                     O. Havnes et al.: Mesospheric dust from its in situ collection by the DUSTY probe

                                                                   related to the true dust size distribution weighted by the in-
                                                                   dividual charges and also their ability to produce secondary
                                                                   charges. Since the dust charges in general increase with the
                                                                   dust size, and the secondary production is proportional to the
                                                                   cross section of the dust particle, an average of the weighted
                                                                   dust number density observed by DUSTY should normally
                                                                   lead to larger values for the monodisperse dust size than for a
                                                                   simple average of the unweighted true dust size distribution.
                                                                   The lidar analysis is based on the assumption of a Gaussian
                                                                   size distribution. The MISU photometer values are closer to
                                                                   the DUSTY values. Also, the lidar total dust densities in the
                                                                   same altitude region are in general more than an order of
                                                                   magnitude larger than what DUSTY finds.
                                                                      We should bear in mind that some of the differences may
                                                                   result from the lidar and DUSTY probe sampling very dif-
                                                                   ferent volumes. The sounding volumes are separated hori-
                                                                   zontally by about 2 km and differ in size. With an altitude
Figure 7. Electron density measured with the Faraday instrument,   resolution of 475 m and integration time of 300 s the lidar
and the total dust charge density as observed by DUSTY, on MXD-    samples a volume of about 105 m3 while DUSTY, with some
1.                                                                 smoothing of the data, samples 0.5 m3 (5 × 10⁻⁴ m3 with un-
                                                                   smoothed data). These differences may be important, taking
                                                                   into account small-scale dynamics (Baumgarten and Fritts,
   The average dust charge number is close to Zav = −1 in          2014; Fritts et al., 2017). The time evolution shown in Fig. 5
the lower and upper parts of the cloud while in the middle         indicates that such small-scale variations were indeed likely
part it is around Zav ∼ −2 to −3. That the comparatively           during the time of the measurement.
large grains in the middle part do not have larger negative           For DUSTY we could lower the computed rd and increase
charge numbers is due to a paucity of electrons, which is          the ND by increasing the secondary efficiency ηS,ref in Eq. (9)
demonstrated by the electron bite-out from ∼ 82 to 84 km,          from its “accepted” values between 50 and 100. This may re-
shown inPFig. 7. In this figure we also show the dust charge       quire that the embedded MSPs occupy an exceptionally large
density (NZ ZD ) and note that the dust particles are the          volume of the icy NLC and PMSE particles. However, we see
dominant negative charge carriers in practically the whole         from Fig. 6d that the lidar profile, computed on the basis of
extent of the cloud.                                               the DUSTY results for a ηS,ref = 100, compares reasonably
                                                                   with the observed lidar profile while an increase in ηS,ref to
                                                                   150 will lead to the computed DUSTY lidar profile becom-
5   Discussion and conclusion                                      ing very weak compared the observed one. The best fit of
                                                                   the model DUSTY lidar profile to the observed results is ob-
The extended method with its unsurpassed altitude resolution       tained for a value of ηS,ref of around 70 to 80.
gives, in our opinion, reasonable results that compare well           The values of rd , ND , and Zav from the DUSTY data will
with the RMR lidar and MISU photometer results (Fig. 6). It        also be affected by the electron density within the dust cloud.
is noteworthy that the parameters for the secondary charging       This can be critical if the dust density is large enough to cre-
model in the present work have been taken from earlier mod-        ate an electron bite-out with locally large reductions in the
eling not aimed at finding rd , ND , and Zav but to demonstrate    electron density. In such cases the dust charges can be re-
that secondary charging was essential in reproducing the cur-      duced significantly compared to those that would occur if no
rents to BP and G2 and their variation with payload rotation       bite-out were present. In Fig. 7 we see a significant electron
(Havnes and Næsheim, 2007; Havnes et al., 2009; Kassa et           bite-out with a minimum electron density of 60 cm−3 at an
al., 2012).                                                        altitude of 83 km. At such low electron densities the Faraday
   If we compare the various results in Fig. 6, in which           method to determine the electron density is uncertain. We
DUSTY results are based on ηS,ref = 100, there are some sig-       examine the consequences of reducing the electron density
nificant differences between DUSTY results and the RMR             within the bite-out compared to the Faraday results shown in
lidar or MISU photometer results. The first is that the RMR        Fig. 7. Arbitrarily reducing the electron density by a factor
lidar in the region at and slightly below 83 km finds parti-       of 10 will lead to a reduction of rd by a factor of ∼ 2 and an
cles of half of or less than the size that DUSTY finds. This       increase in ND by a factor of ∼ 3 within the bite-out.
is probably to some degree influenced by the analysis of the          The charge model we have used does not include the pho-
DUSTY data being based on a monodisperse dust size dis-            todetachment effect (Havnes and Kassa, 2009; Rapp, 2009)
tribution at a specific height. The monodisperse values are        and it does not include any photoelectric effect. Inclusion of

Atmos. Meas. Tech., 12, 1673–1683, 2019                                              www.atmos-meas-tech.net/12/1673/2019/
O. Havnes et al.: Mesospheric dust from its in situ collection by the DUSTY probe 1681
a photodetachment effect will have some – but not serious – Author contributions. OH, AB, TA, and TWH extended the theory
effect on dust particles less than ∼ 5 nm. It will lead to a mod- for analyzing the rocket data. OH and TA analyzed the rocket data.
erate increase in dust number density and a decrease in the GB collected and analyzed the lidar data. TA and ÅF tested rocket
dust radius. In our model, using values of the photodetach- instruments. MF analyzed the Faraday data and provided the elec-
ment effect taken from Havnes and Kassa (2009), we obtain tron density data. JH collected the photometer data and analyzed
them. OH prepared the paper with contributions from all co-authors.
a moderate reduction of the dust radius rd in the altitude re-
gion above ∼ 85.5 km.
Another uncertainty, caused by the design of the DUSTY
Competing interests. The authors declare that they have no conflict
probe, is that small dust particles (less than ∼ 2 nm at an al-
of interest.
titude of ∼ 85 km), which may be carrying a non-negligible
part of the charge density, will be swept away from the probe
by the airstream around the payload and its probes (Horányi Special issue statement. This article is part of the special issue
et al., 1999; Hedin et al., 2007). Observations by the MASS “Layered phenomena in the mesopause region (ACP/AMT inter-
instrument (Robertson et al., 2009, 2014; Knappmiller, 2008) journal SI)”. It is a result of the LPMR workshop 2017 (LPMR-
indicate that considerable numbers of small charged dust par- 2017), Kühlungsborn, Germany, 18–22 September 2017.
ticles, possibly MSPs, have a tendency to be present in the
upper layers of NLC and PMSE clouds, together with larger
NLC and PMSE cloud particles. We cannot exclude that this Acknowledgements. The rocket campaign and the construction
is also the case for the clouds observed by MXD-1. To evalu- of the rocket instrumentation was supported by grants from the
ate the consequences of small charged particles potentially Norwegian Space Centre (VIT.04.14.7; VIT.02.14.1; VIT.03.15.7;
not being registered by DUSTY, we will need a charging VIT.03.16.7), the Research Council of Norway (240065), and the
model with more than one dust size. Such models should also Arctic University of Norway.
improve the comparison to lidar measurements, as these take
Edited by: Bernd Funke
the effect of different sizes into account and show that the en- Reviewed by: three anonymous referees
semble of particles often has a width of the size distribution
of about half the mode radius (Baumgarten et al., 2010).
We find that the development of the new extended method
to analyze the DUSTY measurements has given this probe a References
power that is astounding considering its simplicity. It can in Amyx, K., Sternovsky, Z., Knappmiller, S., Robertson, S., Horányi,
principle be used to measure the radius, total number density, M., and Gumbel, J.: In-situ measurement of smoke particles in
charge density, and charge of icy and non-icy dust particles the wintertime polar mesosphere between 80 and 85 km altitude,
– with an unsurpassed altitude resolution down to scales of J. Atmos. Sol.-Terr. Phy., 70, 61–70, 2008.
10 cm or smaller if the plasma probes on the payload have Antonsen, T. and Havnes, O.: On the detection of mesospheric me-
the same or better height resolution. This will also open up teoric smoke particles embedded in noctilucent cloud particles
for a mapping of the distribution of dust size, dust density, with rocket-borne dust probes, Rev. Sci. Instrum., 86, 033305,
and dust charges within small-scale dust structures (Havnes https://doi.org/10.1063/1.4914394, 2015.
et al., 1996b). To achieve the best foundation for the extended Antonsen, T., Havnes, O., and Mann, I.: Estimates of the
Size Distribution of Meteoric Smoke Particles From Rocket-
method and future use of DUSTY-like probes, we plan to re-
Borne Impact Probes, J. Geophys. Res, 122, 12353–12365,
fine the analysis with a more complete charging model and
https://doi.org/10.1002/2017JD027220, 2017.
to map the effects of changes in the various parameters in- Asmus, H., Robertson, S., Dickson, S., Friedrich, M., and
volved in the method. A comparison with the RMR lidar and Megner, L.: Charge balance for the mesosphere with mete-
MISU photometer observations during the MXD-1 flight will oric dust particles, J. Atmos. Sol.-Terr. Phy., 127, 137–149,
continue to be essential in refining the method. This may also https://doi.org/10.1016/j.jastp.2014.07.010, 2015.
lead to a fine-tuning of the construction of the DUSTY probe Backhouse, T. W.: The luminous cirrus cloud of June and July, Me-
for which the basic structure should be retained though modi- teorol. Mag., 20, 133, 1885.
fications of G2 might be advantageous. For future campaigns Baumgarten, G. and Fritts, D. C.: Quantifying Kelvin-Helmholtz
we intend to improve the collocation of the measurement vol- instability dynamics observed in Noctilucent Clouds: 1. meth-
umes and use the high-resolution DUSTY measurements to ods and observations, J. Geophys. Res., 119, 9324–9337,
https://doi.org/10.1002/2014JD021832, 2014.
derive the actual size distribution within the lidar sounding
Baumgarten, G., Fiedler, J., and von Cossart, G.: The size of noc-
volume.
tilucent cloud particles above ALOMAR (69N, 16E): Optical
modeling and method description, Adv. Space Res., 40, 772–784,
2007.
Data availability. Replication data are available through the UiT Baumgarten, G., Fiedler, J., and Rapp, M.: On microphysical pro-
Open Research Repository at https://doi.org/10.18710/LEMXBU cesses of noctilucent clouds (NLC): observations and model-
(Havnes et al., 2019). ing of mean and width of the particle size-distribution, At-
www.atmos-meas-tech.net/12/1673/2019/ Atmos. Meas. Tech., 12, 1673–1683, 20191682 O. Havnes et al.: Mesospheric dust from its in situ collection by the DUSTY probe mos. Chem. Phys., 10, 6661–6668, https://doi.org/10.5194/acp- Replication data for: A new method of inferring the size, number 10-6661-2010, 2010. density, and charge of mesospheric dust from its in situ collection Carrillo-Sánchez, J. D., Nesvorný, D., Pokorný, P., Janches, by the DUSTY probe, Dataverse NO, UiT open Research Data D., and Plane, J. M. C.: Sources of cosmic dust in the Repository, https://doi.org/10.18710/LEMXBU, 2019. Earth’s atmosphere, Geophys. Res. Lett., 43, 11979–11986, Hedin, J., Gumbel, J., and Rapp, M.: On the efficiency of rocket- https://doi.org/10.1002/2016GL071697, 2016. borne particle detection in the mesosphere, Atmos. Chem. Phys., Czechowsky, P., Rüster, R., and Schmidt, G.: Variations of meso- 7, 3701–3711, https://doi.org/10.5194/acp-7-3701-2007, 2007. spheric structures in different seasons, Geophys. Res. Lett., 6, Hedin, J., Gumbel, J., Khaplanov, M., Witt, G., and Stegman, J.: 459–462, 1979. Optical studies of noctilucent clouds in the extreme ultraviolet, DeLand, M. T., Shettle, E. P., Thomas, G. E., and Olivero, J. J.: Ann. Geophys., 26, 1109–1119, https://doi.org/10.5194/angeo- Latitude-dependent long-term variations in polar mesospheric 26-1109-2008, 2008. clouds from SBUV version 3 PMC data, J. Geophys. Res., 112, Hervig, M. E., Gordley, L. L., Deaver, L. E., Siskind, D. E., D10315, https://doi.org/10.1029/2006JD007857, 2007. Stevens, M. H., Russell III, J. M., Bailey, S. M., Megner, L., and Draine, B. T. and Sutin, B.: Collisional charging of interstellar Bardeen, C. G.: First satellite observations of meteoric smoke grains, Astrophys. J., 320, 803–817, 1987. in the middle atmosphere, Geophys. Res. Lett., 36, L18805, Friedrich, M. and Rapp, M.: News from the Lower Ionosphere: A https://doi.org/10.1029/2009GL039737, 2009. Review of Recent Developments, Surv. Geophys., 30, 525–559, Hervig, M. E., Deaver, L. E., Bardeen, C. G., Russel III, J. M., Bai- https://doi.org/10.1007/s10712-009-9074-2, 2009. ley, S. M., and Gordley, L. L.: The content and composition of Fritts, D. C., Wang, L., Baumgarten, G., Miller, A. D., Geller, meteoric smoke in mesospheric ice particles from SOFIE obser- M. A., Jones, G., Limon, M. Chapman, D., Didier, J., Kjell- vations, J. Atmos. Sol.-Terr. Phy., 84–85, 1–6, 2012. strand, C. B., Araujo, D., Hillbrand, S., Korotkov, A., Tucker, Hervig, M. E., Bardeen, C. G., Siskind, D. E., Mills, M. J., and G., and Vinokurov, J.: High-resolution observations and mod- Stockwell, R.: Meteoric smoke and H2 SO4 aerosols in the up- eling of turbulence sources, structures, and intensities in the per stratosphere and mesosphere, Geophys. Res. Lett., 44, 1150– upper mesosphere, J. Atmos. Sol.-Terr. Phy., 162, 57–78, 1157, https://doi.org/10.1002/2016GL072049, 2017. https://doi.org/10.1016/j.jastp.2016.11.006, 2017. Hunten, D. M., Turco, R. P., and Toon, O. B.: Smoke and dust par- Gadsden, M. and Schröder, W.: Noctilucent Clouds, Springer- ticles of meteoric origin in the mesosphere and stratosphere, J. Verlag, New York, 1989. Atmos. Sci., 37, 1342–1357, 1980. Garnett, J. C. M.: Colours in metal glasses and in metallic films, Horányi, M., Gumbel, J., Witt, G., and Robertson, S.: Simulation of Philos. T. Roy. Soc. A, 203, 385–420, 1904. rocket-borne particle measurements in the mesosphere, Geophys. Gumbel, J., Stegman, J., Murtagh, D. P., and Witt, G.: Scattering Res. Lett., 26, 1537–1540, 1999. phase functions and particle sizes in noctilucent clouds, Geo- Huang, W., Chu, X., Gardner, C. S., Carrillo-Sánchez, J. D., Feng, phys. Res. Lett., 28, 1415–1418, 2001. W., Plane, J. M. C., and Nesvorný, D.: Measurements of the verti- Havnes, O. and Næsheim, L. I.: On the secondary charg- cal fluxes of atomic Fe and Na at the mesopause: Implications for ing effects and structure of mesospheric dust particles im- the velocity of cosmic dust entering the atmosphere, Geophys. pacting on rocket probes, Ann. Geophys., 25, 623–637, Res. Lett., 42, 169–175, https://doi.org/10.1002/2014GL062390, https://doi.org/10.5194/angeo-25-623-2007, 2007. 2015. Havnes, O. and Kassa, M.: On the sizes and observable effects Höffner, J. and Lautenbach, J.: Daylight measurements of of dust particles in polar mesospheric winter echoes, J. Geo- mesopause temperature and vertical wind with the mobile scan- phys. Res., 114, D09209, https://doi.org/10.1029/2008JD011276 ning iron lidar, Opt. Lett., 34, 1351–1353, 2009. 2009. Jesse, O.: Auffallende Abenderscheinungen am Himmel, Meteorol. Havnes, O., Trøim, J., Blix, T., Mortensen, W., Næsheim, L. I., Z., 2, 311–312, 1885. Thrane, E., and Tønnesen, T.: First detection of charged dust par- Kassa, M., Rapp, M., Hartquist, T. W., and Havnes, O.: ticles in the Earth’s mesosphere, J. Geophys. Res., 101, 10839– Secondary charging effects due to icy dust particle im- 10847, 1996a. pacts on rocket payloads, Ann. Geophys., 30, 433–439, Havnes, O., Næsheim, L. I., Hartquist, T. W., Morfill, G. E., Me- https://doi.org/10.5194/angeo-30-433-2012, 2012. landsø, F., Schleicher, B., Trøim, J., Blix, T., and Thrane, E.: Knappmiller, S., Robertson, S., Sternovsky, Z., and Friedrich, Meter-scale variations of the charge carried by mesospheric dust, M.: A Rocket-Borne Mass Analyzer for Charged Aerosol Par- Planet. Space Sci., 44, 1191–1194, 1996b. ticles in the Mesosphere, Rev. Sci. Instrum., 79, 104502, Havnes, O., Surdal, L. H., and Philbrick, C. R.: Mesospheric dust https://doi.org/10.1063/1.2999580, 2008. and its secondary effects as observed by the ESPRIT payload, Latteck, R. and Strelnikova, I.: Extended observations of Ann. Geophys., 27, 1119–1128, https://doi.org/10.5194/angeo- polar mesospheric winter echoes over Andøya (69◦ ) us- 27-1119-2009, 2009. ing MAARSY, J. Geophys. Res.-Atmos., 120, 8216–8225, Havnes, O., Gumbel, J., Antonsen, T, Hedin, J., and La- https://doi.org/10.1002/2015JD023291, 2015. Hoz, C.: On the size distribution of collision fragments Lübken, F.-J., Berger, U., and Baumgarten, G.: On the of NLC dust particles and their relevance to meteoric anthropogenic impact on long-term evolution of noc- smokeparticles, J. Atmos. Sol.-Terr. Phy., 118, 190–198, tilucent clouds, Geophys. Res. Lett., 45, 6681–6689, https://doi.org/10.1016/j.jastp.2014.03.008, 2014. https://doi.org/10.1029/2018GL077719, 2018. Havnes, O., Antonsen, T., Baumgarten, G., Hartquist, T., Megner, L., Khaplanov, M., Baumgarten, G., Gumbel, J., Stegman, Biebricher, A., Fredriksen, Å., Friedrich, M., and Hedin, J.: J., Strelnikov, B., and Robertson, S.: Large mesospheric ice parti- Atmos. Meas. Tech., 12, 1673–1683, 2019 www.atmos-meas-tech.net/12/1673/2019/
O. Havnes et al.: Mesospheric dust from its in situ collection by the DUSTY probe                                                       1683

   cles at exceptionally high altitudes, Ann. Geophys., 27, 943–951,     Robertson, S., Dickson, S., Horányi, M., Sternovsky, Z., Friedrich,
   https://doi.org/10.5194/angeo-27-943-2009, 2009.                        M., Janches, D., Megner, L., and Williams, B.: Detection of me-
Ogurtsov, M. G. and Raspopov, O. M.: Possible impact of interplan-         teoric smoke particles in the mesosphere by a rocket-borne mass
   etary and interstellardust fluxes on the Earth’s climate, Geomagn.      spectrometer, J. Atmos. Sol.-Terr. Phy., 118, 161–179, 2014.
   Aeron., 51, 275–283, 2011.                                            Rosinski, J. and Snow, R. H.: Secondary particulate matter from
Plane, J. M. C.: Cosmic dust in the Earth’s atmosphere, Chem. Soc.         meteor vapors, J. Meteorol., 18, 736–745, 1961.
   Rev., 41, 6507–6518, 2012.                                            Symons, G. J. (Ed.): The Eruption of Krakatoa and Subsequent Phe-
Rapp, M.: Charging of mesospheric aerosol particles: the                   nomena (Report of the Krakatoa Committee of the Royal Soci-
   role of photodetachment and photoionization from meteoric               ety) London, Publisher Trübner & co, London, 1888.
   smoke and ice particles, Ann. Geophys., 27, 2417–2422,                Thomas, G.: Is the polar mesosphere the miner’s ca-
   https://doi.org/10.5194/angeo-27-2417-2009, 2009.                       nary of global change?, Adv. Space Res., 18, 149–158,
Rapp, M. and Strelnikova, I.: Measurements of meteor smoke parti-          https://doi.org/10.1016/0273-1177(95)00855-9, 1996.
   cles during the ECOMA-2006 campaign; 1. Particle detection by         Tomsic, A.: Collisions between water clusters and surfaces, PhD
   active photoionization, J. Atmos. Sol.-Terr. Phy., 71, 477–485,         thesis, Gothenburg University, 2001.
   2009.                                                                 Turco, R., Toon, O., Whitten, R., Keesee, R., and Hollenbach, D.:
Rapp, M. and Thomas, G. E.: Modeling the microphysics of meso-             Noctilucent clouds: Simulation studies of their genesis, proper-
   spheric ice particles: Assessment of current capabilities and basic     ties and global influences, Planet. Space Sci., 30, 1147–1181,
   sensitivities, J. Atmos. Sol.-Terr. Phy., 68, 715–744, 2006.            https://doi.org/10.1016/0032-0633(82)90126-X, 1982.
Reddmann, T., Funke, B., Konopka, P., Stiller, G., Versick, S.,          von Cossart, G., Fiedler, J., and von Zahn, U.: Size distributions of
   and Vogel, B.: The Influence of Energetic Particles on the              NLC particles as determined from 3-color observations of NLC
   Chemistry of the Middle Atmosphere, in: Climate and Weather             by ground-based lidar, Geophys. Res. Lett. 26, 1513–1516, 1999.
   of the Sun-Earth System (CAWSES), edited by: Lübken,                  von Zahn, U., von Cossart, G., Fiedler, J., Fricke, K. H., Nelke,
   F.-J., Springer Atmospheric Sciences, Dordrecht, 247–273,               G., Baumgarten, G., Rees, D., Hauchecorne, A., and Adolf-
   https://doi.org/10.1007/978-94-007-4348-9_15, 2013.                     sen, K.: The ALOMAR Rayleigh/Mie/Raman lidar: objectives,
Robertson, S., Horányi, M., Knappmiller, S., Sternovsky, Z., Holz-         configuration, and performance, Ann. Geophys., 18, 815–833,
   worth, R., Shimogawa, M., Friedrich, M., Torkar, K., Gumbel,            https://doi.org/10.1007/s00585-000-0815-2, 2000.
   J., Megner, L., Baumgarten, G., Latteck, R., Rapp, M., Hoppe,         Zeller, O., Zecha, M., Bremer, J., Latteck,R., and Singer, W.:
   U.-P., and Hervig, M. E.: Mass analysis of charged aerosol par-         Mean characteristics of mesospheric winter echoes at mid-
   ticles in NLC and PMSE during the ECOMA/MASS campaign,                  and high-latitudes, J. Atmos. Sol.-Terr. Phy., 68, 1087–1104,
   Ann. Geophys., 27, 1213–1232, https://doi.org/10.5194/angeo-            https://doi.org/10.1016/j.jastp.2006.02.015, 2006.
   27-1213-2009, 2009.

www.atmos-meas-tech.net/12/1673/2019/                                                       Atmos. Meas. Tech., 12, 1673–1683, 2019
You can also read