Negligible influence of livestock contaminants and sampling system on ammonia measurements with cavity ring-down spectroscopy - Atmos. Meas. Tech
←
→
Page content transcription
If your browser does not render page correctly, please read the page content below
Atmos. Meas. Tech., 12, 2837–2850, 2019
https://doi.org/10.5194/amt-12-2837-2019
© Author(s) 2019. This work is distributed under
the Creative Commons Attribution 4.0 License.

Negligible influence of livestock contaminants and sampling system
on ammonia measurements with cavity ring-down spectroscopy
Jesper Nørlem Kamp1,2 , Albarune Chowdhury1 , Anders Peter S. Adamsen1,a , and Anders Feilberg1
1 Department of Engineering, Aarhus University, 8000 Aarhus, Denmark
2 ArcticResearch Centre, Aarhus University, 8000 Aarhus, Denmark
a now at: APSA, 8800 Viborg, Denmark

Correspondence: Anders Feilberg (af@eng.au.dk)

Received: 25 October 2018 – Discussion started: 29 November 2018
Revised: 12 April 2019 – Accepted: 1 May 2019 – Published: 17 May 2019

Abstract. Emission of ammonia (NH3 ) is a ubiquitous prob-         1   Introduction
lem due to the adverse effects of NH3 on the environment
and human health. The agricultural sector accounts for nearly      Ammonia (NH3 ) is an important atmospheric pollutant with
all NH3 emissions in Europe. Hence, technologies for the           several adverse effects: deposition of NH3 can lead to eu-
abatement of NH3 emissions from this sector have been in           trophication and acidification, which has negative effects on
strong demand in recent years. In order to document emis-          biodiversity (Sheppard et al., 2011). NH3 is a precursor of
sions and evaluate abatement technologies, there is a strong       atmospheric aerosols thereby influencing the global radia-
need for reliable NH3 measurement methods. Photoacoustic           tion budget as well as having a negative influence on human
spectroscopy (PAS) is often used to measure NH3 concen-            health (Aneja et al., 2001; Baek et al., 2004). In addition,
trations, but recent research shows interference from com-         microbial oxidation of NH3 results in secondary production
pounds typically present in livestock production and during        of nitrous oxide (N2 O) and nitric oxide (NO) (Zhu et al.,
agricultural activities. In this work, the performance of cavity   2013). N2 O is a very potent greenhouse gas (GHG) and NO
ring-down spectroscopy (CRDS) from Picarro, as an alterna-         is involved in atmospheric reactions producing tropospheric
tive to PAS, has been tested with respect to method valida-        ozone (Aneja et al., 2001).
tion under laboratory and field conditions. Potential interfer-       Agricultural activities, mainly manure application and
ences of 10 volatile organic compounds (VOCs) on CRDS              management, account for around 94 % of NH3 emissions in
NH3 measurement were tested with simultaneous VOC anal-            Europe (Nielsen et al., 2017). Reliable measurements in the
ysis performed by proton-transfer-reaction mass spectrome-         agricultural sector are highly important to give accurate esti-
try (PTR-MS). Both laboratory and field calibrations show          mates of NH3 emissions in order to reduce emissions, for ex-
excellent linearity over a large dynamic range of NH3 con-         ample, by validation of technological improvements within
centrations. The analyzer shows a small humidity effect of up      the agricultural sector.
to a few ppb in the extreme case of a nearly water-saturated          The ventilation air from animal production facilities con-
air stream. Apart from the negligible humidity dependency,         tains a variety of chemical compounds, relatively high wa-
no interferences of the tested VOCs were observed. Overall,        ter content and high densities of particulate matter. This in-
the CRDS system performs satisfactory and is well suited for       cludes a great number of volatile organic compounds (VOCs)
measurements of NH3 emissions from livestock production.           that are emitted in agricultural buildings from, e.g., silage,
                                                                   manure and the animals themselves (Feilberg et al., 2010;
                                                                   Hafner et al., 2013; Hansen et al., 2012; Ngwabie et al., 2008;
                                                                   Shaw et al., 2007; Yuan et al., 2017). Several NH3 analyzers
                                                                   are sensitive to water vapor and other gasses (Bobrutzki et
                                                                   al., 2010; Huszár et al., 2008; Ni and Heber, 2008; Rom and
                                                                   Zhang, 2010; Rosenstock et al., 2013). Such interferences

Published by Copernicus Publications on behalf of the European Geosciences Union.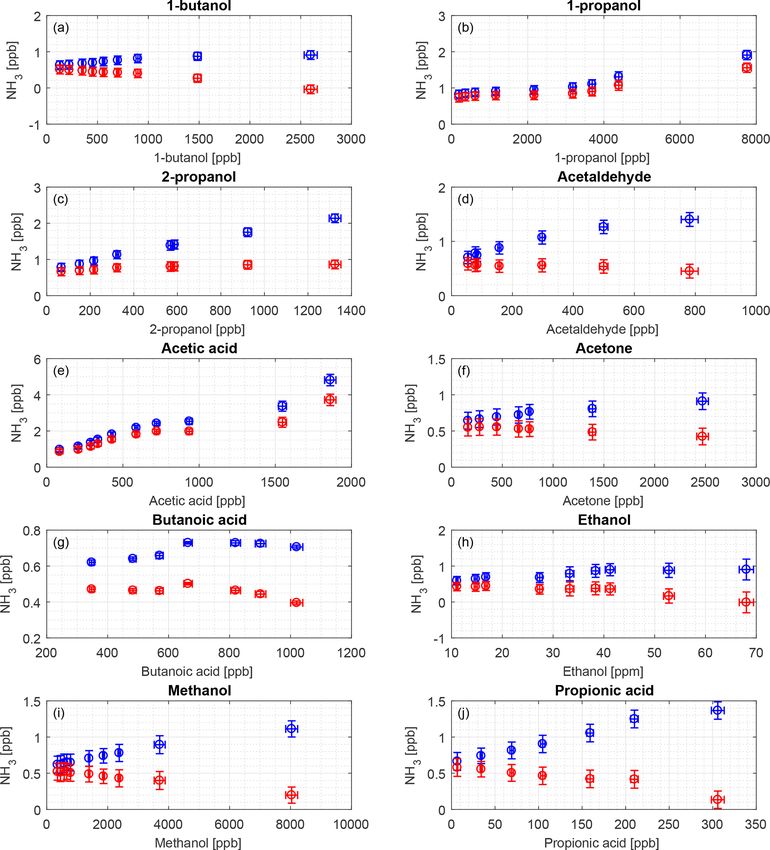
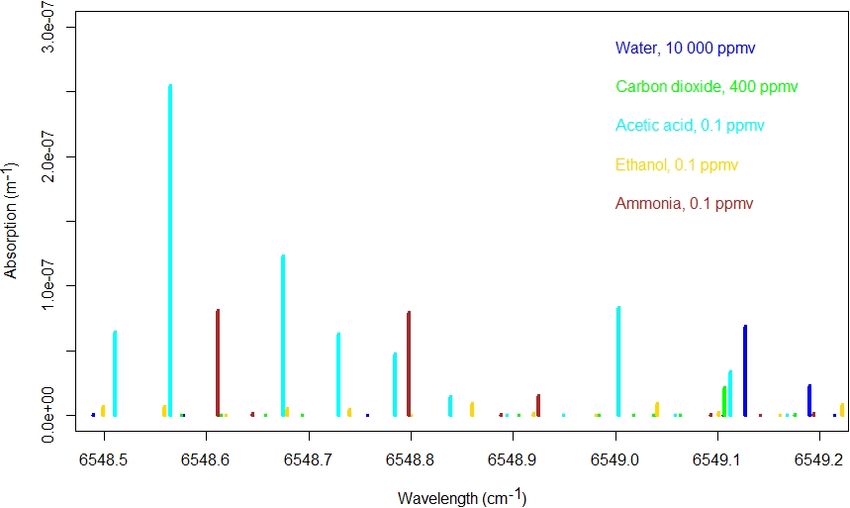
2838                                 J. N. Kamp et al.: Negligible influence of livestock contaminants and sampling system

Figure 1. Simulated absorption spectrum from the HITRAN database for 1 % H2 O (blue), 400 ppm CO2 (green), 100 ppb acetic acid, 100 ppb
ethanol, and 100 ppb NH3 at 45 ◦ C and 187 mbar.

can introduce errors depending on the instrument used. Fur-           at 11 points in a dairy cow barn. The cycle time for a typi-
thermore, it is challenging to measure NH3 concentrations             cal setup in a barn would therefore be on the order of 3–5 h,
correctly due to its high water solubility and polarity, which        which makes it impossible to monitor temporal variations
causes adsorption on surfaces in the sampling system and              with only 4–8 measurements per measurement point per day.
within the instrument (Rom and Zhang, 2010; Shah et al.,              Thus, the response time is a key parameter for equipment
2006; Vaittinen et al., 2014). This “sticky nature” of NH3            measuring at multiple points as done in livestock buildings.
causes delays in the measurements, giving longer response                 In a few recent studies, cavity ring-down spectroscopy
times (Rom and Zhang, 2010; Shah et al., 2006; Vaittinen              (CRDS) has been used to measure ammonia concentrations
et al., 2014). It is an additional challenge to measure NH3           (Maasikmets et al., 2015; Sintermann et al., 2011) in agri-
in livestock buildings, where dust and particles provide large        cultural settings. The CRDS provides measurements in real
surface areas for adsorption in particulate filters used to pro-      time with high sensitivity, high selectivity and a fast response
tect measuring instruments.                                           time. The CRDS analyzer maintains high linearity, precision
   In many agricultural emission studies, photoacoustic spec-         and accuracy over changing environmental conditions with-
troscopy (PAS) (Poissant et al., 2005; Rom and Zhang, 2010;           out the need for frequent calibration. The work of Martin et
Saha et al., 2010; Wu et al., 2012; Zhang et al., 2005; Zong          al. (2016) led to an improvement of water vapor interference
et al., 2014) has been used, but findings by Rosenstock et            calculations on Picarro’s CRDS for NH3 measurements. The
al. (2013) and Liu et al. (2019) show high interference on            scaling factor error they discovered is approximately 2 % of
NH3 measurements from a variety of organic compounds in-              the absolute water concentration.
cluding carboxylic acids and alcohols. Hassouna et al. (2013)             Bobrutzki et al. (2010) conducted a field intercompari-
reported nonconstant bias in the results from PAS measure-            son of 11 atmospheric NH3 measurement techniques at con-
ments on NH3 and N2 O caused by organic compounds of-                 centrations up to 120 ppb including cavity ring-down spec-
ten present at agricultural sites, which makes the PAS mea-           troscopy (CRDS), and the results show a good overall agree-
surements unreliable in an agricultural setting. Another issue        ment between the instruments on an hourly basis (R 2 >0.84).
with PAS measurements is the long response time of up to                  Our aim is to demonstrate the performance of the CRDS
25 min (Rom and Zhang, 2010), which lowers the time reso-             analyzer for measurements of NH3 gas concentration un-
lution of emission measurements under dynamic conditions.             der laboratory and field conditions. This includes iden-
NH3 is underestimated by approximately 14 % and 2 % af-               tification and quantification of potential interferences by
ter 12.5 and 25 min, respectively (Rom and Zhang, 2010).              compounds present in livestock buildings by using proton-
Typical measurements in cattle barns take place at multiple           transfer-reaction mass spectrometry (PTR-MS) to document
points. For example, Rong et al. (2014) measured at 7 points          VOC concentrations in laboratory tests.
in a dairy cow building and Ngwabie et al. (2009) measured

Atmos. Meas. Tech., 12, 2837–2850, 2019                                                 www.atmos-meas-tech.net/12/2837/2019/
J. N. Kamp et al.: Negligible influence of livestock contaminants and sampling system                                               2839

Figure 2. (a) Calibration curve of the CRDS from 0.20 to 16.8 ppm NH3 conducted under laboratory conditions; (b) calibration curve limited
to 0 to 2 ppm. Symbols represent measured values, error bars the standard deviation and the line is the fitted regression model.

   Due to the major concerns regarding measurements of                 Chemie GmbH, Steinheim, Germany), 0.7 mM acetalde-
NH3 with PAS (Hassouna et al., 2013; Liu et al., 2019; Zhao            hyde (Sigma-Aldrich), 4 mM propionic acid (Alfa Ae-
et al., 2012), it is pertinent that any influence of VOC on            sar GmbH & Co KG, Karlsruhe, Germany), 0.8 mM ace-
CRDS is thoroughly documented, which to our knowledge                  tone (Merck), 10 mM methanol (VWR), 2.2 mM 1-butanol
has not been done previously. The absorptions lines of, for            (Merck), 69 mM ethanol (CCS Healthcare AB, Borlänge,
example, acetic acid and methanol found in the HITRAN                  Sweden) and 44 mM butanoic acid (Alfa Aesar). Deionized
database (Gordon et al., 2017) are in the same range as the            water dissolved the chemicals to the desired concentrations.
ammonia lines used for measurements in the CRDS; see                      We used the following gasses during the experiments:
Fig. 1. This highlights the importance of the current study            101 ppm NH3 (±10 %) in N2 O calibration gas (AGA A/S,
as the absorption by VOCs in principle may cause similar in-           Copenhagen, Denmark), pure (99.99 %) CO2 (AGA), pure
terference, as reported by Rosenstock et al. (2013) and Liu et         (99.99 %) CH4 (AGA), and as compressed zero air passed
al. (2019) for PAS.                                                    through a bed of silica gel and charcoal to remove water,
   This study aims to validate CRDS for measurements in                ozone, hydrocarbons and other common contaminants. Mass
the agricultural industry, thus we test for interference with          flow controllers (MFCs) from the EL-FLOW (Bronkhorst
a number of compounds typically present in pig houses and              High-Tech B.V., Ruurlo, Netherlands) series regulated all gas
cattle farms for which NH3 concentration and emission mea-             flows with an accuracy of ±5 %.
surements are routinely carried out. Laboratory tests include
determination of the response parameters linearity, response           2.2   Instrumentation
time, influence of particulate filters and chemical interfer-
ence. Field tests include determination of the response pa-
                                                                       The operational principle of CRDS relies on ring down time
rameters linearity, response time and particulate filter effect.
                                                                       laser light. An air sample enters a cavity at low pressure
                                                                       (18.665 kPa, 140 Torr) and laser light is pulsed into the cav-
2     Materials and methods                                            ity, where almost all light is reflected by mirrors, which gives
                                                                       an effective path length of kilometers. A small fraction of
2.1    Chemicals, reagents and gasses                                  the light penetrates the mirrors to reach the detector and the
                                                                       intensity of the light is proportional to the concentration of
We used the following chemicals during the experi-                     target gas, as the target gas will absorb light. The G2103
ments: 70 mM acetic acid (VWR int. S.A.S., Fontenay-                   analyzer measures absorption from 6548.5 to 6549.2 cm−1
sous-Bois, France), 27 mM 1-propanol (Merck KGaA,                      (Martin et al., 2016), and Fig. 1 shows the absorption of some
Darmstadt, Germany), 1.3 mM 2-propanol (Sigma-Aldrich                  selected compounds in this range obtained from the HITRAN

www.atmos-meas-tech.net/12/2837/2019/                                                     Atmos. Meas. Tech., 12, 2837–2850, 2019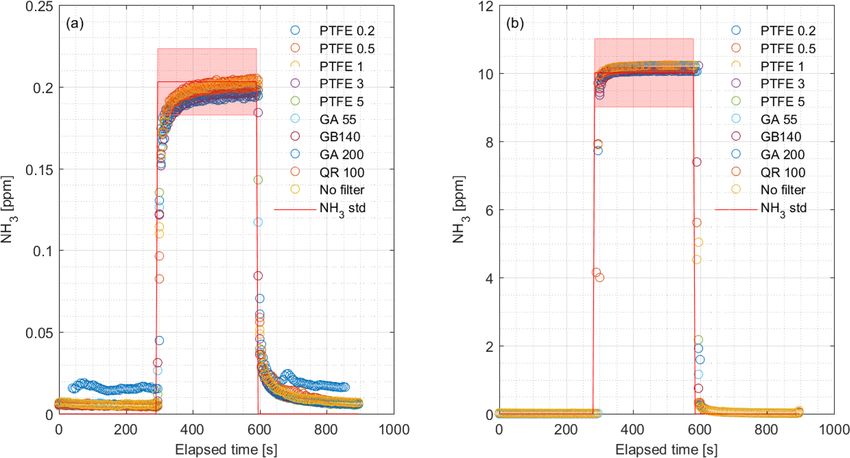
2840                                  J. N. Kamp et al.: Negligible influence of livestock contaminants and sampling system

Figure 3. (a) Rise time and (b) fall time for the CRDS measurements normalized to final concentrations during laboratory testing of the
response to a step change to 1.02 (blue) and 10.01 ppm (green). The results show NH3 to 1.02 ppm with rise time (1/e) = 8.1 s and fall time
(1/e) = 3.2 s and 10.01 ppm with rise time = 3.6 s and fall time = 4.8 s. The red lines and areas represent the NH3 standard gas concentra-
tion with 10 % accuracy, the blue markers show the normalized concentration from 1.02 ppm and the green markers show the normalized
concentration from 10.01 ppm.

Figure 4. The response to a step change in NH3 at (a) 0.203 and (b) 10.01 ppm with and without external inlet filters during laboratory
testing. The red line and area represent the NH3 standard gas concentration with 10 % accuracy. See the legend abbreviations in Table 1.

2016 database (Gordon et al., 2017). The computed absorp-               CA, USA) to measure the NH3 concentration continuously,
tion lines in Fig. 1 correspond to 1 % H2 O, 400 ppm CO2 ,              this CRDS analyzer has not incorporated the upgraded wa-
100 ppb acetic acid, 100 ppb ethanol and 100 ppb ammonia                ter correction. A high-sensitivity PTR-MS (Ionicon Ana-
at 45 ◦ C and 140 Torr. Line broadening is not taken into ac-           lytik, Innsbruck, Austria) measured concentrations of differ-
count.                                                                  ent VOCs for the interference tests. The drift tube setting
   For the determination of interference, we used a Picarro             was 600 V, 2.1–2.2 mbar and 60 ◦ C, which yield an E/N of
NH3 /H2 O analyzer model G2103 (Picarro Inc., Santa Clara,              approximately 130 Td. Fragmentation of alcohols is normal

Atmos. Meas. Tech., 12, 2837–2850, 2019                                                    www.atmos-meas-tech.net/12/2837/2019/
J. N. Kamp et al.: Negligible influence of livestock contaminants and sampling system                                                  2841

Table 1. Specifications of tested particulate filters with abbreviations.

                    Filter material       Pore size (µm)   Thickness (mm)     Diameter (mm)      Porosity (%)   Filter code
                    PTFE∗                           0.2               0.08                 25             74    PTFE 0.2
                    PTFE∗                           0.5               0.08                 25             78    PTFE 0.5
                    PTFE∗                           1.0               0.08                 25             79    PTFE 1.0
                    PTFE∗                           3.0               0.08                 25             83    PTFE 3.0
                    PTFE∗                           5.0               0.08                 25              –    PTFE 5.0
                    Glass fiber                     0.6               0.21                 25              –    GA 55
                    Glass fiber                     0.4               0.56                 25              –    GB 140
                    Glass fiber                     0.8               0.74                 25              –    GA 200
                    Quartz fiber                      –               0.38                 25              –    QR 100
                  ∗ Polytetrafluoroethylene.

                                                                             2.3   Linearity, calibration and filter effect

                                                                             We used a flow dilution system with zero air and NH3 cali-
                                                                             bration gas (101 ppm) to test the linearity of the CRDS mea-
                                                                             surements. NH3 gas concentrations for the calibration were
                                                                             in the range from 0.20 to 16.8 ppm in the laboratory and
                                                                             from 0.27 to 20.0 ppm under field conditions. We performed
                                                                             the calibrations in the laboratory without external filters. In-
                                                                             troduction of all gasses in the field was through a multi-
                                                                             position rotary valve (MPV, Cheminert low-pressure valve,
                                                                             model C25, VICI AG International, Schenkon, Switzerland)
                                                                             for 6 min while the CRDS was in normal sampling mode.
                                                                             We performed a single point calibration in the field to test
                                                                             the system integrity and analyzer response time by introduc-
                                                                             ing 7.8 ppm NH3 calibration gas directly into the sampling
                                                                             lines that were manually removed from their position. The
                                                                             response time for all experiments was found by fitting an
                                                                             exponential function to the step changes, which gave the e-
                                                                             folding time. We tested the PTFE filters in the laboratory for
Figure 5. The CRDS signals of NH3 (ppb) in zero air at different             NH3 signals by connecting filters used for 2 weeks to a clean
concentrations of water vapor, ranging from 6 % to 99 % relative             air supply under heating to maximum 75 ◦ C. Monitoring of
humidity (RH) at 22 ◦ C under laboratory conditions. Symbols rep-            the NH3 signals continued until the concentration went be-
resent measured values and the line is the fitted linear regression          low 5 ppb; see Table 1 for abbreviations and specifications of
model.                                                                       the used filters.
                                                                                We performed laboratory tests on the response time by
                                                                             switching between ambient air and 1.02 ppm NH3 with the
in PTR-MS and we use the fragmentation of alcohols as de-                    MPV without external filters attached. We also tested re-
scribed by Brown et al. (2010) to calculate the final concen-                sponse time to a step change in NH3 concentration with dif-
tration with all fragments taken into consideration.                         ferent external particulate filters attached. The concentrations
   One stream of clean air passed through the headspace air                  were 0.203 and 10.01 ppm NH3 with filters of different pore
over an aqueous solution containing a single compound. An-                   sizes made of PTFE, glass fiber and quartz. Table 1 shows
other stream diluted the outflow from the headspace. We                      the specifications of the filters.
changed the airflows to get different concentrations of the
compound in the gas phase. The CRDS and PTR-MS re-                           2.4   Field testing
ceived the diluted air streams.
                                                                             We conducted field tests in a cattle barn with natural ven-
                                                                             tilation located in central Jutland outside Viborg, Denmark.
                                                                             The cattle barn is 9 m high, 60 m long and 36 m wide and
                                                                             naturally ventilated. We measured NH3 concentrations in the
                                                                             cattle building with the CRDS combined with a 10 port (P1-

www.atmos-meas-tech.net/12/2837/2019/                                                           Atmos. Meas. Tech., 12, 2837–2850, 2019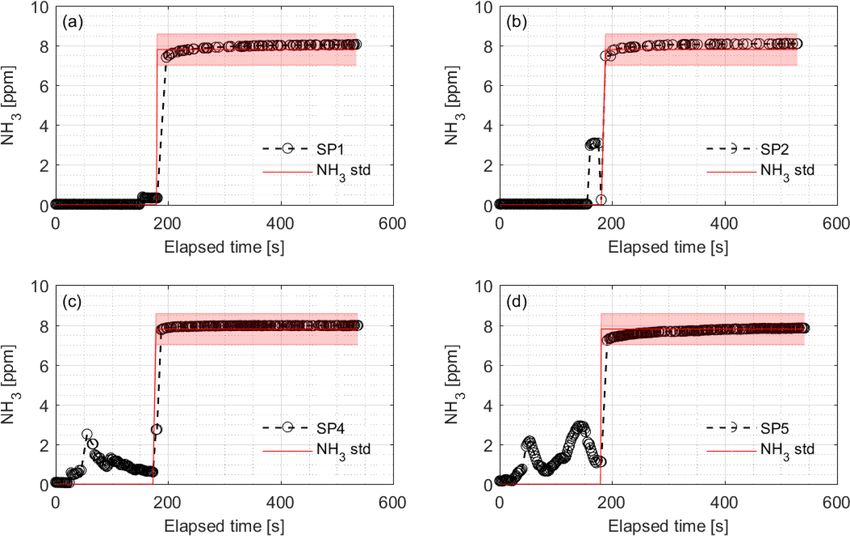
2842 J. N. Kamp et al.: Negligible influence of livestock contaminants and sampling system
Figure 6. The CRDS signals of NH3 in zero air response to various concentrations of (a) CO2 (480–5848 ppm) and (b) CH4 (2.42–350 ppm)
under laboratory conditions. Symbols represent measured values and vertical and horizontal bars the standard deviation of the measurements.
P10) MPV (C25-61800, VICI Valco Inst. Co. Inc., Texas, Table 2. Limit of detection and limit of quantification from a 1 h
USA). Measurements were set up according to Rong et stable measurements on zero air.
al. (2014) and Wu et al. (2012). We considered the divi-
N Mean SD LOD (3 × SD) LOQ (10 × SD)
sion into three 20 m sections inside the cattle barn to be
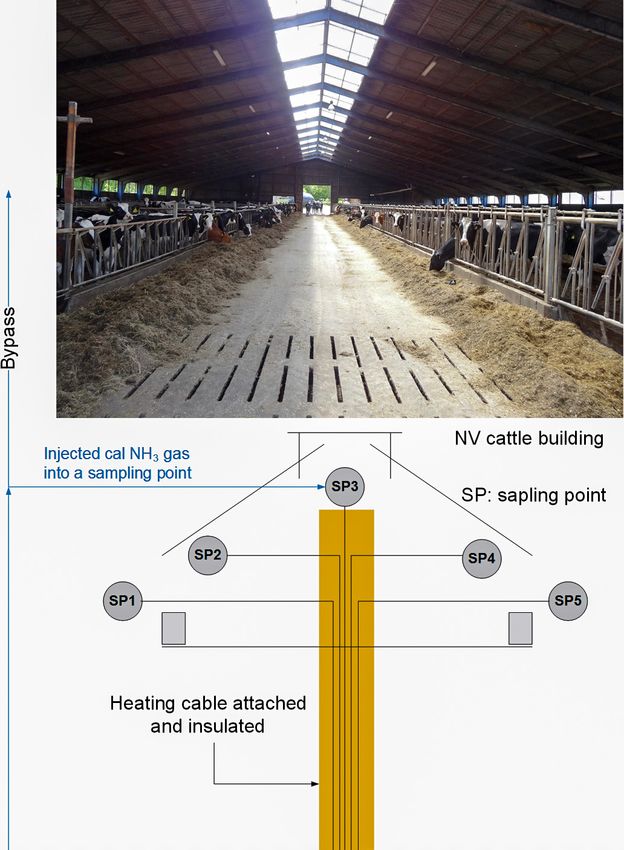
representative of the animal-occupied zone of the barn. We H2 O [%] 2065 0.082 0.0019 0.006 0.019
NH3 [ppb] 2065 0.636 0.115 0.345 1.151
sampled NH3 concentrations from the three sections using
PTFE tubes (inner diameter 6 mm, 20 m long) with 20 uni-
formly distributed sampling openings. The sampling points
from 6.3 % to 98.6 %. The response to the change in humid-
(SP) SP2, SP3 and SP4 were inside the building, with SP2
ity is linear (R 2 = 0.83) with NH3 measurements from 1.3 to
and SP4 on each of the end walls adjacent to the windows,
4.6 ppb over the given RH range.
i.e., sidewall openings, placed 2.5 m above the floor. SP3
was just below the ridge opening in the middle of the build-
ing, placed 9 m above the floor. SP1 and SP5 were outside 3 Results
background measurements from two single points placed 5 m
from the building sidewalls at 2.5 m height. The sample tubes 3.1 Laboratory tests
were between 5 and 50 m long with heating cables attached
to avoid condensation inside the tubing. The length of the The CRDS had a highly linear response (R 2 = 0.99998) to
sampling lines was approximately 5, 15, 35, 45 and 50 m for NH3 concentrations over the dynamic range 0.20–16.8 ppm
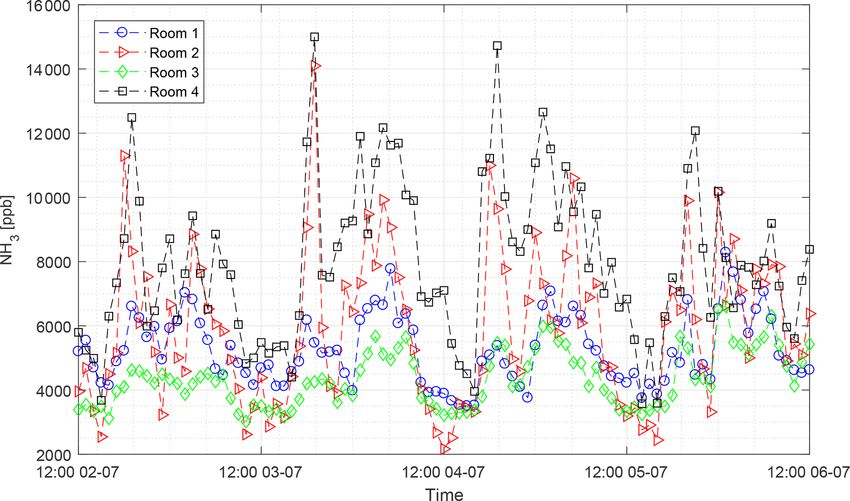
SP1, SP2, SP3, SP4 and SP5, respectively. See Fig. A1 in the (Fig. 2). This range is chosen from the expected concentra-
Appendix. Each sampling line had a secondary suction pump tion in a livestock facility as seen in Figs. A2 and A3, which
(flow rate of 6–7 L min−1 ) with a PTFE membrane to gener- show the hourly mean concentration of NH3 in four rooms
ate a constant flow through the lines. A PTFE filter (0.20 µm with finisher pigs and a dairy cattle barn, respectively. The
pore size) removed airborne particulate matter from the sam- maximum concentration can exceed 15 ppm in the pig houses
ple air before the sampling ports of the MPV. Replacement and 3 ppm in the cattle barn. The NH3 standard calibration
of filters was done at least fortnightly. Measurement lasted gas used for all calibrations had an accuracy of ±10 % stated
6 min for each sampling port with automatic switching; i.e., by the manufacturer. The measured NH3 concentrations in
a measurement cycle was 30 min. Fig. 2 are averages of several hundred measurements and the
We used pure deionized water to produce a range of differ- standard deviations are indicators of stability. Figure 3a and b
ent humidity levels. Figure 5 shows the effects of the humid- shows the result of a step change in concentration from clean
ity on the NH3 signal from relative humidity (RH) ranging air to 1.02 and 10.01 ppm, respectively, and back to clean air.
The rise time to the final concentration level minus 1/e was
Atmos. Meas. Tech., 12, 2837–2850, 2019 www.atmos-meas-tech.net/12/2837/2019/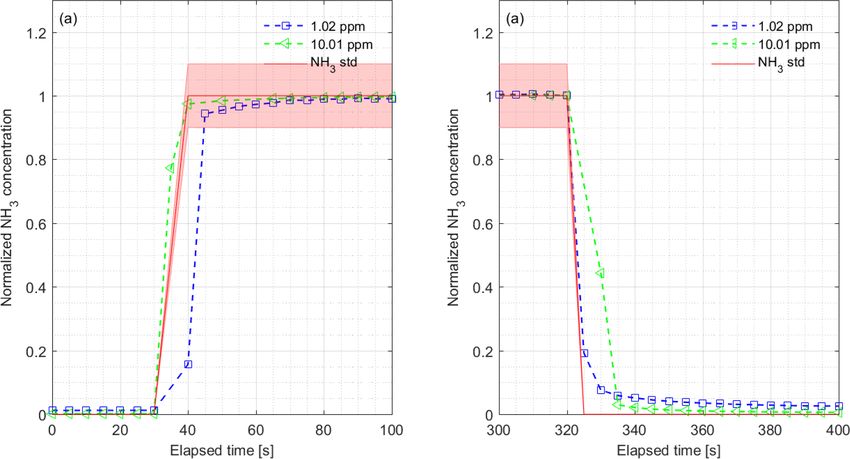
J. N. Kamp et al.: Negligible influence of livestock contaminants and sampling system                                                2843

Figure 7. Interference of different organic compounds on the CRDS NH3 measurement. Blue markers indicate the original data and red
markers indicate water-corrected data from the regression shown in Fig. 5. The compounds are (a) 1-butanol, (b) 1-propanol, (c) 2-propanol,
(d) acetaldehyde, (e) acetic acid, (f) acetone, (g) butanoic acid, (h) ethanol, (i) methanol, and (j) propionic acid.

8.1 and 3.6 s and the fall time to 1/e of the final concentration       limit of detection (LOD) of 0.35 ppb for three standard devi-
level was 3.2 and 4.8 s for 1.02 and 10 ppm, respectively. Fur-         ations and a limit of quantification (LOQ) of 1.15 ppb for 10
thermore, Fig. 4 shows response times to step changes to two            standard deviations; see Table 2.
concentrations (0.203 and 10.01 ppm) with different types of               Figure 6 shows the CRDS signals from CO2 and CH4
external particulate filters. The response times varied for the         with random fluctuations in the low ppb level being ob-
different filter types, with an average rise and fall time of 8.1       served. There are no apparent interferences from these two
and 6.3 s (for 0.203 ppm) and 3.1 and 3.7 s (for 10.01 ppm),            compounds. All measured NH3 concentrations for both com-
respectively (Fig. 4). Across all filter types, the response time       pounds are below the LOQ.
was fastest for changes to the highest concentration except                Figure 7 shows the interferences of 10 different VOCs with
the fall time for three filters; see details in Table A2.               VOC concentration as a function of NH3 concentration cor-
   Measurements on zero air over an hour gave a standard de-            rected for water contribution and the uncorrected concen-
viation on the NH3 concentration of 0.115 ppb. This gives a             tration as well. This correction was due to a clear pattern

www.atmos-meas-tech.net/12/2837/2019/                                                      Atmos. Meas. Tech., 12, 2837–2850, 2019
2844 J. N. Kamp et al.: Negligible influence of livestock contaminants and sampling system
4 Discussion
The CRDS analyzer had a linear response during both labo-
ratory tests and field validation (Figs. 2 and 8) in the range
from approximately 0.2 to 20 ppm; NH3 concentrations in
livestock buildings are normally within this range (Heber et
al., 2006; Koerkamp et al., 1998) as seen in Figs. A1 and A2.
This is in agreement with the manufacturer specifications that
guarantee the range from 0 to 500 ppb and an operational and
optional expanded range up to 10 and 50 ppm, respectively
(Picarro, 2017). The field calibrations show excellent agree-
ment with the standard gas concentrations. The standard gas
had an uncertainty of ±10 %, according to the data sheet
from the manufacturer. This may well explain the small off-
set (< 4 %) from the obtained concentrations seen in Fig. 9,
but the system causes minor variations, as the bias is con-
sidered constant. The LOD (0.35 ppb) found in the present
study is comparable to the manufacturer’s specifications for
1 s integration time, as seen in Table 2. The performance of
a single point field calibration showed very good agreement
Figure 8. Calibration curve of the CRDS from 0.27 to 20.04 ppm with the expected concentrations, as seen in Fig. 9. The po-
NH3 conducted under field conditions. Symbols represent measured tential bias from the zero air might also influence the other
values and the line is the fitted linear regression model.
laboratory experiments, which can explain some of the varia-
tions we see in, for example, filter response (Fig. 4) or water
dependency (Fig. 5).
for increased water vapor with VOC concentration as wa-
It is a requirement to have fast responding analyzers to un-
ter is introduced with the VOCs, and NH3 concentration in-
derstand the dynamic behavior and diurnal variations in NH3
creased with increased water vapor for all compounds. The
concentrations in animal buildings. Ni and Heber (2008) sug-
observed interferences were in the range from 0.5 to 5 ppb
gest a response time of less than 2 min to capture temporal
NH3 equivalents at VOC concentrations from 6 to 8000 ppb.
NH3 concentration variations. The CRDS shows sufficiently
These VOC concentrations range from levels comparable to
low response times under laboratory (Fig. 3 and Table A2)
field conditions up to levels 1–2 orders of magnitude higher
and field conditions (Fig. 9). These times are also comparable
than maximum field conditions.
to < 30 s for responses to 3 ppm, as reported by the manufac-
3.2 Field tests turer (Picarro, 2017). Furthermore, there are no clear changes
in response time without the use of an external particulate
In the field, the CRDS also has a highly linear response matter filter. The tested filters vary by < 10 s in response time
(R 2 = 0.9995) in the concentration range 0.27–20.04 ppm; with a tendency towards shorter response times at higher con-
see Fig. 8. Figure 9 shows the results of a single point field centrations. The manufacturer reports rise- and fall times of
calibration of the system integrity and response time to a sud- approximately 16 s, which is at a minimum twice as much
den change to 7.8 ppm with response times varying from 6 to as the present results, Table A2 and Fig. 2. The response
25 s. The calibration gas used in the measurements shown in to a change from 0 to 1.02 ppm gave response times of 8.1
Figs. 8 and 9 had an uncertainty of ±10 %. and 3.2 s for the rise and fall time, respectively. A change
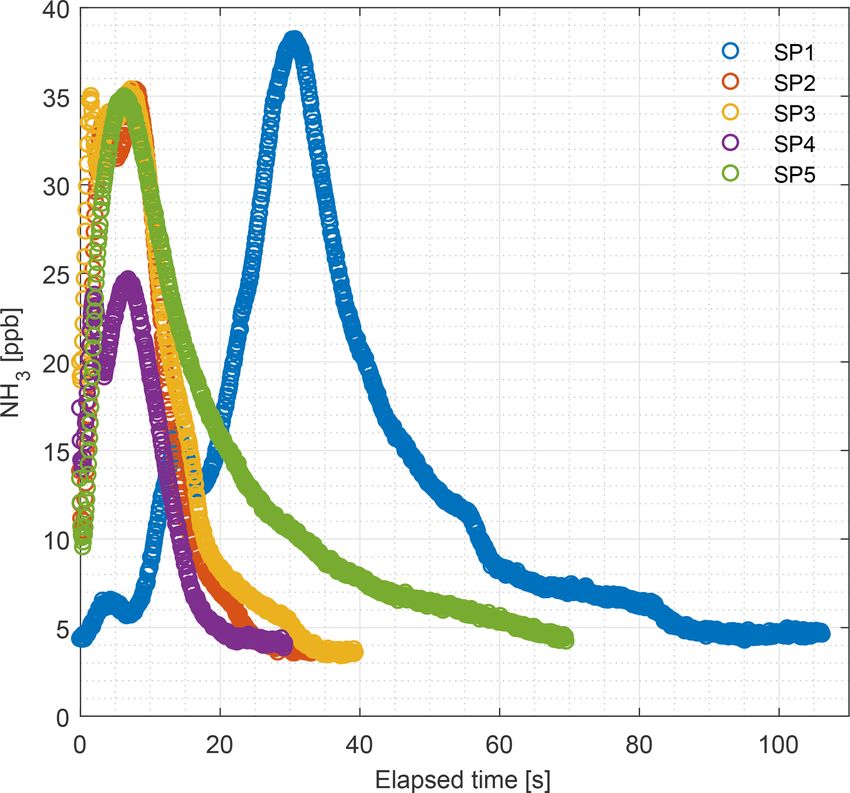
Figure 10 shows the ammonia concentrations released from 0 to 10.02 gave response times of 3.6 and 4.8 s for
from external particulate filters that have been exposed to the rise and fall time, respectively (Fig. 3). The rise times
ammonia in a livestock house for 2 weeks. Vacuum pumps with external particulate filters connected were 7.3, 3.0, 8.4
applied a gas flow rate of minimum 6 L min−1 through the and 5.9 s, for SP1, SP2, SP4 and SP5, respectively. Response
filter over the 2-week period, thus a minimum volume of times are, in general, faster for higher concentration differ-
120 m3 of air went through each filter. The preexposed filters ences (see Fig. 4), which is ascribed to faster surface satu-
were flushed with zero air and ammonia release was moni- ration. The observed concentrations of NH3 released from
tored by CRDS. The concentration maximum varied between particulate filters exposed to air from a livestock house for
25 and 38 ppb. The peak values are comparable to typical am- 2 weeks (Fig. 10) suggest that adsorption of NH3 to the filter
bient laboratory concentrations ranging from 14 to 37 ppb; material, surfaces and walls is negligible. The levels released
see Table A1. over 1 min (< 50 ppb) should be compared to a filter expo-
sure of ammonia of > 100 ppb (ranging in to low ppm levels)
over 2 weeks. These results indicate that the use of external
Atmos. Meas. Tech., 12, 2837–2850, 2019 www.atmos-meas-tech.net/12/2837/2019/J. N. Kamp et al.: Negligible influence of livestock contaminants and sampling system 2845
Figure 9. Calibration of the NH3 sampling and measurement system and associated response times of the CRDS during field testing.
Introduction of 7.8 ppm NH3 gas was at (a) SP1, (b) SP2, (c) SP4 and (d) SP5 while monitoring the NH3 concentration at the outlet port
connected to the analyzer. SP denotes sampling point. The rise times were 7.3, 3.0, 8.4 and 5.9 s for SP1, SP2, SP4 and SP5, respectively.
The red line and area represent the NH3 standard concentration with uncertainty.
filters gives satisfying response times and no problems with of 100 pbb and very humid air, a water vapor interference of
adsorption of NH3 on the filter material. up to 5 % of the NH3 signal may be present, but under normal
CO2 and CH4 are present in the atmosphere in relatively conditions this is negligible.
high concentrations compared to other trace gasses, and ani- The 10 tested compounds are normally present in sub-ppm
mals produce CO2 and CH4 , thus elevated concentrations are levels in agricultural environments (Copeland et al., 2012;
normal in animal houses. Over a large concentration range, Yuan et al., 2017). As seen in Fig. 1, acetic acid and methanol
we observed little scatter and no interference of CO2 and have absorption lines in the wavelength area used for the Pi-
CH4 on NH3 measurements, as seen in Fig. 6. The mean con- carro CRDS measurements. A concentration range that cov-
centrations of both compounds are below the LOQ. ers a large dynamic area and exceeds the normal maximum
For the interference of single VOCs, it was expected that concentration in livestock buildings was used to obtain the
the different dilutions prepared from clean dry air mixed with potential maximum interference, and we only observed very
humid headspace air over a VOC solution gave a correlation small water-induced interferences. Figure 7 shows the con-
between water vapor and VOC concentration. This was also tribution from the single VOCs that were either corrected for
the case for all 10 volatile compounds. Martin et al. (2016) water or uncorrected, and, as can be seen, the interferences
observe an interference from water vapor on NH3 measure- are insignificant in general. Overall, the difference between
ments due to spectral line broadening, which the manufac- high and low concentration for a single VOC was approx-
turer corrects for in all models produced after the publica- imately 1–2 ppb NH3 (Fig. 7), except for acetic acid with a
tion of that work. Our Picarro analyzer from December 2014 difference of nearly 4 ppb. It should be noted that the water to
does not make this extra correction, and we thus expected VOC relation differs for the different compounds. With wa-
a small water dependency for NH3 , which is seen in Fig. 5. ter correction applied, only 1-propanol and acetic acid have
Figure 5 shows the humidity effect on the CRDS signal gen- increasing tendencies, where NH3 concentration increases
erated from pure deionized water and reveals a small depen- about 0.8 ppb for an increase of 7.5 ppm of 1-propanol and
dency for water vapor, which the improvements suggested by 2.9 ppb for an increase of nearly 1.8 ppm of acetic acid.
Martin et al. (2016) potentially remove. Nonetheless, our re- Acetic acid, 2-propanol and propionic acids were the only
sults show up to 4.5 ppb NH3 for a nearly water-saturated air compounds with absolute humidity above 1 % as we used
stream with an absolute H2 O concentration of approximately higher flow rates over the headspace to obtain the targeted
1.1 %. Thus, in the extreme case of low NH3 concentrations concentrations. The very moist sample of acetic acid had a
www.atmos-meas-tech.net/12/2837/2019/ Atmos. Meas. Tech., 12, 2837–2850, 20192846 J. N. Kamp et al.: Negligible influence of livestock contaminants and sampling system
The results of this study clearly demonstrate the advan-
tage of CRDS with only few and small interferences, whereas
the performance of the photoacoustic analyzers under simi-
lar circumstances studied by Liu et al. (2019) showed much
more interference from non-NH3 species.
Our tests of the Picarro CRDS showed great linearity dur-
ing both laboratory and fieldwork. The response times with
respect to concentration changes were sufficiently low to
measure temporal variations in NH3 concentrations in live-
stock emissions. Examinations of external particulate filters
lead to no clear recommendations for filter material, but
all filters gave acceptable response times and only small
amounts of NH3 adsorption compared to background levels.
Potential interferences were tested for 10 VOCs in known
concentrations and the compounds gave negligible interfer-
ence on CRDS NH3 measurements.
Code and data availability. The data in the study are available
Figure 10. Levels of NH3 concentration in the 2-week-old external upon request to the corresponding author (af@eng.au.dk).
particulate filters (PTFE, 0.20 µm pore size) measured by the CRDS
in the laboratory. Filters collected from the field were installed be-
fore each sampling port. SP denotes sampling point.
corrected maximum of 3.7 ppb NH3 , which is very low com-
pared to, for example, concentrations in animal buildings,
which typically range from < 1 to 20 ppm but can, in extreme
cases, reach up to 50 ppm (Heber et al., 2006; Koerkamp et
al., 1998). Thus, errors of a few ppb, introduced by humid-
ity effects, would have a small impact on the results. For the
given setup, the interferences from water vapor were in the
same order of magnitude as the LOQ of 1.15 ppb. For more
than half of the VOCs, the NH3 concentration falls below the
LOQ for all or most measurement. This demonstrates a very
low interference from the investigated VOCs.
Atmos. Meas. Tech., 12, 2837–2850, 2019 www.atmos-meas-tech.net/12/2837/2019/J. N. Kamp et al.: Negligible influence of livestock contaminants and sampling system 2847
Appendix A
Table A1. Measured concentrations of NH3 , CO2 and CH4 in lab-
oratory zero air (CV denotes coefficient of variation).
Gas Concentration Mean CV (%) Measurement
duration (h)
NH3 ppb 1 43 19
CO2 ppm 480 5 19
CH4 ppm 2.4 10 19
Table A2. The rise (1/e response time) and fall (1/e response time)
times (s) of the CRDS analyzer for measurements of NH3 concen-
trations (0.203 and 10.01 ppm) with or without external inlet partic-
ulate filters during laboratory testing. For filters detail see Table 1.
Filter code 0.203 ppm NH3 10.01 ppm NH3
Rise (s) Fall (s) Rise (s) Fall (s)
No filter 7.3 4.7 3.3 4.9
PTFE 0.2 4.8 7.1 2.0 2.7
PTFE 0.5 8.0 5.3 6.0 1.5
PTFE 1.0 6.9 4.9 1.8 5.3
PTFE 3.0 6.3 4.5 2.1 1.4
PTFE 5.0 5.3 9.5 1.2 3.2
GA 55 12.4 8.5 1.8 2.3
GB 140 12.7 7.0 3.3 7.0 Figure A1. Schematic of the sampling point inside the cattle build-
GA 200 9.3 5.6 3.3 3.0 ing. SP1 and SP5 were placed outside for background measurement
QR 100 8.0 5.5 5.9 5.7 at 2.5 m height. SP2 and SP4 were on the walls at 2.5 m height. SP3
Min 4.8 4.5 1.2 1.4 was placed below the ridge at 9 m height. The lines were approx-
Max 12.7 9.5 6.0 7.0 imately 5, 15, 35, 45 and 50 m for SP1, SP2, SP3, SP4 and SP5,
Mean 8.1 6.3 3.1 3.7 respectively.
www.atmos-meas-tech.net/12/2837/2019/ Atmos. Meas. Tech., 12, 2837–2850, 20192848 J. N. Kamp et al.: Negligible influence of livestock contaminants and sampling system Figure A2. Hourly mean concentrations of NH3 from four different rooms with finisher pigs. Figure A3. Hourly mean concentrations of NH3 from a dairy cattle barn, unpublished data. Atmos. Meas. Tech., 12, 2837–2850, 2019 www.atmos-meas-tech.net/12/2837/2019/
J. N. Kamp et al.: Negligible influence of livestock contaminants and sampling system                                                  2849

Author contributions. JK and AC performed the experiments, anal-           Mass Spectrometry, Environ. Sci. Technol., 44, 5894–5900,
ysis and drafted the initial manuscript. The work was conceptual-          https://doi.org/10.1021/es100483s, 2010.
ized and validated by AF, AC and JK with input from APA on the           Gordon, I. E., Rothman, L. S., Hill, C., Kochanov, R. V, Tan, Y.,
methodology. All authors have contributed and edited the paper dur-        Bernath, P. F., Birk, M., Boudon, V., Campargue, A., Chance,
ing the review.                                                            K. V, Drouin, B. J., Flaud, J., Gamache, R. R., Hodges, J.
                                                                           T., Jacquemart, D., Perevalov, V. I., Perrin, A., Shine, K. P.,
                                                                           Smith, M. H., Tennyson, J., Toon, G. C., Tran, H., Tyuterev,
Competing interests. The authors declare that they have no conflict        V. G., Barbe, A., Császár, A. G., Devi, V. M., Furtenbacher,
of interest.                                                               T., Harrison, J. J., Hartmann, J., Jolly, A., Johnson, T. J., Kar-
                                                                           man, T., Kleiner, I., Kyuberis, A. A., Loos, J., Lyulin, O.
                                                                           M., Massie, S. T., Mikhailenko, S. N., Moazzen-ahmadi, N.,
Acknowledgements. The authors thank laboratory technician                  Müller, H. S. P., Naumenko, O. V, Nikitin, A. V, Polyan-
Heidi Grønbæk Christiansen and technician Peter Storegård Nielsen          sky, O. L., Auwera, J. Vander, Wagner, G., Wilzewski, J.,
for their valuable help during the experimental part of the study. The     Wcis, P., Yu, S., and Zak, E. J.: Journal of Quantitative Spec-
authors thank the Danish Milk Levy Foundation for funding this re-         troscopy & Radiative Transfer The HITRAN2016 molecular
search.                                                                    spectroscopic database, J. Quant. Spectrosc. Ra., 203, 3–69,
                                                                           https://doi.org/10.1016/j.jqsrt.2017.06.038, 2017.
                                                                         Hafner, S. D., Howard, C., Muck, R. E., Franco, R. B., Montes,
                                                                           F., Green, P. G., Mitloehner, F., Trabue, S. L., and Rotz, C.
Financial support. This research has been supported by the Danish
                                                                           A.: Emission of volatile organic compounds from silage: Com-
Milk Levy Foundation.
                                                                           pounds, sources, and implications, Atmos. Environ., 77, 827–
                                                                           839, https://doi.org/10.1016/j.atmosenv.2013.04.076, 2013.
                                                                         Hansen, M. J., Liu, D., Guldberg, L. B., and Feilberg, A.: Ap-
Review statement. This paper was edited by Folkert Boersma and             plication of proton-transfer-reaction mass spectrometry to the
reviewed by two anonymous referees.                                        assessment of odorant removal in a biological air cleaner
                                                                           for pig production, J. Agr. Food Chem., 60, 2599–2606,
                                                                           https://doi.org/10.1021/jf300182c, 2012.
                                                                         Hassouna, M., Robin, P., Charpiot, A., Edouard, N., and Méda,
                                                                           B.: Infrared photoacoustic spectroscopy in animal houses: Ef-
References                                                                 fect of non-compensated interferences on ammonia, nitrous ox-
                                                                           ide and methane air concentrations, Biosyst. Eng., 114, 318–326,
Aneja, V. P., Roelle, P. A., Murray, G. C., Southerland, J., Eris-         https://doi.org/10.1016/j.biosystemseng.2012.12.011, 2013.
  man, J. W., Fowler, D., Asman, W. A. H., and Patni, N.: At-            Heber, A. J., Ni, J.-Q., Lim, T. T., Tao, P.-C., Schmidt,
  mospheric nitrogen compounds II: emissions, transport, transfor-         A. M., Koziel, J. A., Beasley, D. B., Hoff, S. J., Nico-
  mation, deposition and assessment, Atmos. Environ., 35, 1903–            lai, R. E., Jacobson, L. D., and Zhang, Y.: Quality As-
  1911, https://doi.org/10.1016/S1352-2310(00)00543-4, 2001.               sured Measurements of Animal Building Emissions: Gas Con-
Baek, B. H., Aneja, V. P., and Tong, Q.: Chemical coupling between         centrations, J. Air Waste Manage. Assoc., 56, 1472–1483,
  ammonia, acid gases, and fine particles, Environ. Pollut., 129,          https://doi.org/10.1080/10473289.2006.10465680, 2006.
  89–98, https://doi.org/10.1016/j.envpol.2003.09.022, 2004.             Huszár, H., Pogány, A., Bozóki, Z., Mohácsi, Á., Horváth,
Bobrutzki, K. von, Braban, C. F., Famulari, D., Jones, S. K., Black-       L., and Szabó, G.: Ammonia monitoring at ppb level
  all, T., Smith, T. E. L., Blom, M., Coe, H., Gallagher, M., Gha-         using photoacoustic spectroscopy for environmental ap-
  laieny, M., McGillen, M. R., Percival, C. J., Whitehead, J. D., El-      plication, Sensors Actuat. B-Chem., 134, 1027–1033,
  lis, R., Murphy, J., Mohacsi, A., Pogany, A., Junninen, H., Ranta-       https://doi.org/10.1016/j.snb.2008.05.013, 2008.
  nen, S., Sutton, M. A., and Nemitz, E.: Field inter-comparison of      Koerkamp, P. W. G. G., Metz, J. H. M., Uenk, G. H., Phillips,
  eleven atmospheric ammonia measurement techniques, Atmos.                V. R., Holden, M. R., Sneath, R. W., Short, J. L., White,
  Meas. Tech., 3, 91–112, https://doi.org/10.5194/amt-3-91-2010,           R. P. P., Hartung, J., Seedorf, J., Schröder, M., Linkert, K.
  2010.                                                                    H., Pedersen, S., Takai, H., Johnsen, J. O., and Wathes, C.
Brown, P., Watts, P., Märk, T. D., and Mayhew, C. A.: Pro-                 M.: Concentrations and Emissions of Ammonia in Livestock
  ton transfer reaction mass spectrometry investigations on                Buildings in Northern Europe, J. Agr. Eng. Res., 70, 79–95,
  the effects of reduced electric field and reagent ion inter-             https://doi.org/10.1006/jaer.1998.0275, 1998.
  nal energy on product ion branching ratios for a series of             Liu, D., Rong, L., Kamp, J., Kong, X., Adamsen, A. P., Chowd-
  saturated alcohols, Int. J. Mass Spectrom., 294, 103–111,                hury, A., and Feilberg, A.: Photoacoustic measurement may
  https://doi.org/10.1016/j.ijms.2010.05.028, 2010.                        significantly overestimate NH3 emissions from cattle houses
Copeland, N., Cape, J. N., and Heal, M. R.: Volatile organic               due to VOC interferences, Atmos. Meas. Tech. Discuss.,
  compound emissions from Miscanthus and short rotation cop-               https://doi.org/10.5194/amt-2018-412, in review, 2019.
  pice willow bioenergy crops, Atmos. Environ., 60, 327–335,             Maasikmets, M., Teinemaa, E., Kaasik, A., and Kimmel, V.: Mea-
  https://doi.org/10.1016/j.atmosenv.2012.06.065, 2012.                    surement and analysis of ammonia, hydrogen sulphide and odour
Feilberg, A., Liu, D., Adamsen, A. P. S., Hansen, M. J.,                   emissions from the cattle farming in Estonia, Biosyst. Eng., 139,
  and Jonassen, K. E. N.: Odorant Emissions from Intensive
  Pig Production Measured by Online Proton-Transfer-Reaction

www.atmos-meas-tech.net/12/2837/2019/                                                       Atmos. Meas. Tech., 12, 2837–2850, 2019
2850 J. N. Kamp et al.: Negligible influence of livestock contaminants and sampling system
48–59, https://doi.org/10.1016/j.biosystemseng.2015.08.002, Shah, S. B., Grabow, G. L., and Westerman, P. W.: Ammonia Ad-
2015. sorption in Five Types of Flexible Tubing Materials, Am. Soc.
Martin, N. A., Ferracci, V., Cassidy, N., and Hoffnagle, J. A.: The Agr. Biol. Eng., 22, 919–923, 2006.
application of a cavity ring-down spectrometer to measurements Shaw, S. L., Mitloehner, F. M., Jackson, W., Depeters, E. J.,
of ambient ammonia using traceable primary standard gas mix- Fadel, J. G., Robinson, P. H., Holzinger, R., and Gold-
tures, Appl. Phys. B, 122, 1–11, https://doi.org/10.1007/s00340- stein, A. H.: Volatile organic compound emissions from dairy
016-6486-9, 2016. cows and their waste as measured by proton-transfer-reaction
Ngwabie, N. M., Schade, G. W., Custer, T. G., Linke, S., and Hinz, mass spectrometry, Environ. Sci. Technol., 41, 1310–1316,
T.: Abundances and Flux Estimates of Volatile Organic Com- https://doi.org/10.1021/es061475e, 2007.
pounds from a Dairy Cowshed in Germany, J. Environ. Qual., Sheppard, L. J., Leith, I. D., Mizunuma, T., Neil Cape, J., Cross-
37, 565–573, https://doi.org/10.2134/jeq2006.0417, 2008. ley, A., Leeson, S., Sutton, M. A., van Dijk, N., and Fowler,
Ngwabie, N. M., Jeppsson, K. H., Nimmermark, S., Swensson, D.: Dry deposition of ammonia gas drives species change faster
C., and Gustafsson, G.: Multi-location measurements of green- than wet deposition of ammonium ions: evidence from a long-
house gases and emission rates of methane and ammonia from a term field manipulation, Glob. Change Biol., 17, 3589–3607,
naturally-ventilated barn for dairy cows, Biosyst. Eng., 103, 68– https://doi.org/10.1111/j.1365-2486.2011.02478.x, 2011.
77, https://doi.org/10.1016/j.biosystemseng.2009.02.004, 2009. Sintermann, J., Ammann, C., Kuhn, U., Spirig, C., Hirschberger,
Ni, J.-Q. and Heber, A. J.: Sampling and Measurement of Ammonia R., Gärtner, A., and Neftel, A.: Determination of field scale
at Animal Facilities, Adv. Agron., 98, 201–269, 2008. ammonia emissions for common slurry spreading practice with
Nielsen, O. K., Plejdrup, M. S., Winther, M., Mikkelsen, M. H., two independent methods, Atmos. Meas. Tech., 4, 1821–1840,
Nielsen, M., Gyldenkærne, S., Fauser, P., Albrektsen, R., Hjel- https://doi.org/10.5194/amt-4-1821-2011, 2011.
gaard, K. H., Bruun, H. G., and Thomsen, M.: Annual Danish Vaittinen, O., Metsälä, M., Persijn, S., Vainio, M., and
Informative Inventory Report to UNECE, Emission inventories Halonen, L.: Adsorption of ammonia on treated stainless
from the base year of the protocols to year 2015, Aarhus Univer- steel and polymer surfaces, Appl. Phys. B, 115, 185–196,
sity, DCE – Danish Centre for Environment and Energy, 2017. https://doi.org/10.1007/s00340-013-5590-3, 2014.
Picarro, I.: NH3 Analyzer for Ambient Air Datasheet, archived by Wu, W., Zhang, G., and Kai, P.: Ammonia and methane emissions
WebCite® , available at: http://www.webcitation.org/70JfzdB0u from two naturally ventilated dairy cattle buildings and the influ-
(last access: 20 June 2018), 2017. ence of climatic factors on ammonia emissions, Atmos. Environ.,
Poissant, L., Pilote, M., Beauvais, C., Constant, P., and Zhang, 61, 232–243, https://doi.org/10.1016/j.atmosenv.2012.07.050,
H. H.: A year of continuous measurements of three at- 2012.
mospheric mercury species (GEM, RGM and Hg p) in Yuan, B., Coggon, M. M., Koss, A. R., Warneke, C., Eilerman, S.,
southern Québec, Canada, Atmos. Environ., 39, 1275–1287, Peischl, J., Aikin, K. C., Ryerson, T. B., and De Gouw, J. A.:
https://doi.org/10.1016/j.atmosenv.2004.11.007, 2005. Emissions of volatile organic compounds (VOCs) from concen-
Rom, H. B. and Zhang, G. Q.: Time delay for aerial Ammonia trated animal feeding operations (CAFOs): Chemical composi-
concentration measurements in livestock buildings, Sensors, 10, tions and separation of sources, Atmos. Chem. Phys., 17, 4945–
4634–4642, https://doi.org/10.3390/s100504634, 2010. 4956, https://doi.org/10.5194/acp-17-4945-2017, 2017.
Rong, L., Liu, D., Pedersen, E. F., and Zhang, G.: Effect of climate Zhang, G., Strøm, J. S., Li, B., Rom, H. B., Mors-
parameters on air exchange rate and ammonia and methane emis- ing, S., Dahl, P., and Wang, C.: Emission of ammo-
sions from a hybrid ventilated dairy cow building, Energy Build., nia and other contaminant gases from naturally venti-
82, 632–643, https://doi.org/10.1016/j.enbuild.2014.07.089, lated dairy cattle buildings, Biosyst. Eng., 92, 355–364,
2014. https://doi.org/10.1016/j.biosystemseng.2005.08.002, 2005.
Rosenstock, T. S., Diaz-Pines, E., Zuazo, P., Jordan, G., Predo- Zhao, Y., Pan, Y., Rutherford, J., and Mitloehner, F. M.: Es-
tova, M., Mutuo, P., Abwanda, S., Thiong’o, M., Buerkert, timation of the interference in Multi-Gas measurements us-
A., Rufino, M. C., Kiese, R., Neufeldt, H., and Butterbach- ing infrared photoacoustic analyzers, Atmosphere, 3, 246–265,
Bahl, K.: Accuracy and precision of photoacoustic spec- https://doi.org/10.3390/atmos3020246, 2012.
troscopy not guaranteed, Glob. Change Biol., 19, 3565–3567, Zhu, X., Burger, M., Doane, T. A., and Horwath, W. R.: Ammo-
https://doi.org/10.1111/gcb.12332, 2013. nia oxidation pathways and nitrifier denitrification are significant
Saha, C. K., Zhang, G., Kai, P., and Bjerg, B.: Effects of a partial sources of N2 O and NO under low oxygen availability, P. Natl.
pit ventilation system on indoor air quality and ammonia emis- Acad. Sci. USA, 110, 6328–6333, 2013.
sion from a fattening pig room, Biosyst. Eng., 105, 279–287, Zong, C., Feng, Y., Zhang, G., and Hansen, M. J.: Effects of differ-
https://doi.org/10.1016/j.biosystemseng.2009.11.006, 2010. ent air inlets on indoor air quality and ammonia emission from
two experimental fattening pig rooms with partial pit ventila-
tion system – Summer condition, Biosyst. Eng., 122, 163–173,
https://doi.org/10.1016/j.biosystemseng.2014.04.005, 2014.
Atmos. Meas. Tech., 12, 2837–2850, 2019 www.atmos-meas-tech.net/12/2837/2019/You can also read