PM2.5 in Indoor Air of a Bakery: Chemical Characterization and Size Distribution - MDPI
←
→
Page content transcription
If your browser does not render page correctly, please read the page content below
atmosphere
Article
PM2.5 in Indoor Air of a Bakery: Chemical
Characterization and Size Distribution
Pierina Ielpo 1, *, Claudia Marcella Placentino 2 , Alessandra Genga 3 , Valeria Ancona 4 ,
Vito Felice Uricchio 4 and Paola Fermo 5
 1   Institute of Atmospheric Sciences and Climate of Italian National Research Council, Lecce division,
     73100 Lecce, Italy
 2   ARPA Puglia, Environmental Protection Regional Agency of Apulia Region, 70126 Bari, Italy;
     marcella.placentino@gmail.com
 3   Dipartimento di Scienze e Tecnologie Biologiche e Ambientali, University of Salento, S.P. Lecce-Monteroni,
     73100 Lecce, Italy; alessandra.genga@unisalento.it
 4   Water Research Institute of National Research Council, viale F. de Blasio 5, 70132 Bari, Italy;
     valeria.ancona@ba.irsa.cnr.it (V.A.); vito.uricchio@ba.irsa.cnr.it (V.F.U.)
 5   Dipartimento di Chimica, Università degli Studi di Milano, via Golgi 19, 20133 Milan, Italy;
     paola.fermo@unimi.it
 *   Correspondence: p.ielpo@isac.cnr.it; Tel.: +39-083-242-2408

 Received: 7 March 2020; Accepted: 17 April 2020; Published: 21 April 2020

 Abstract: In current literature, studies on indoor air quality mostly concern environments such as
 hospitals, schools and homes, and less so on spaces producing food, such as bakeries. However,
 small- and medium-sized bakeries are typical and very common food production spaces, mostly in
 Southern Italy. Considering this, the present study investigated size trends of the aerosol particles
 during bakery working activities and the indoor particulate matter PM2.5 chemical speciation at the
 same time, in order to characterize the aerosol particulate matter emissions. In particular, indoor air
 monitoring was performed using a silent sequential sampler and an optical particle counter monitor
 during 7–19 April 2013. For each daily sampling, four PM2.5 samples were collected. In each sample,
 OC (organic carbon), EC (elemental carbon), LG (levoglucosan) Cl− (chloride), NO2 − (nitrite), NO3 −
 (nitrate), SO4 2− (sulfate), C2 O4 2− (oxalate), Na+ (sodium), NH4 + (ammonium), K+ (potassium), Mg2+
 (magnesium) and Ca2+ (calcium) concentrations were determined. The main sources of particles
 were wood burning, the cleaning of ovens (ash removal) and the baking of bread. While levoglucosan
 was associated with the source wood burning, potassium in this case can be considered as a marker
 of the contribution of the bakery activities. This work represents the second part of indoor research
 activities performed in the bakery. The first part was published in Ielpo et al. (2018).

 Keywords: PM2.5 indoor; bakery; levoglucosan; PM fine fraction

1. Introduction
     There is growing public awareness regarding health due to the risk associated with poor indoor air
quality (IAQ) in home and workplaces as humans typically spend 80–90% of their time indoors [1–6].
     The indoor air pollution (IAP) produced by the domestic combustion of solid fuels is responsible
for up to 4 million deaths annually [7]. Occupational asthma is a work-related respiratory disease
frequently reported in many countries. Baker’s asthma can be caused by immunologic sensitization to
specific work-related allergens and subsequent allergic reactions in the airways [8–11]. The inhalation
of wheat flour following exposure to flour dust is the main cause of the onset of this disease/pathology
in bakery workers [12–16]. In the literature, it is well known that the exposure to wheat flour dust can
determine the occurrence of diseases affecting the respiratory system [17]. Many studies (e.g., [18,19])

Atmosphere 2020, 11, 415; doi:10.3390/atmos11040415                           www.mdpi.com/journal/atmosphere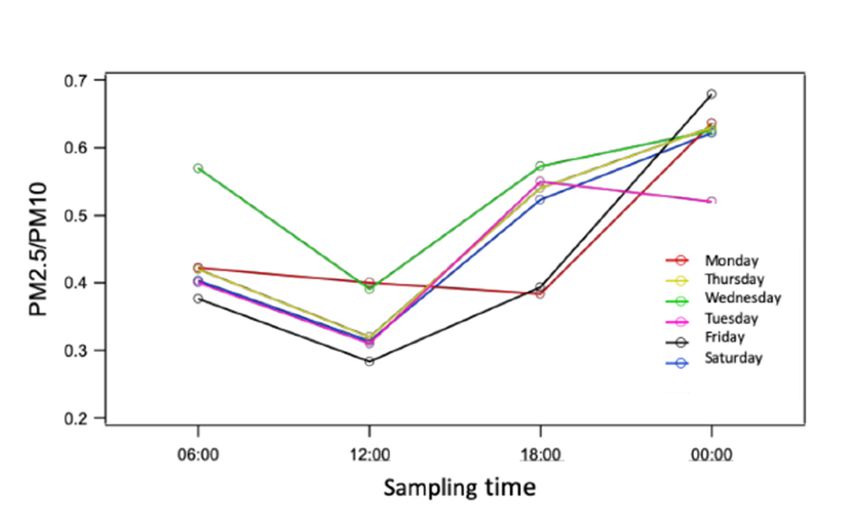
Atmosphere 2020, 11, 415                                                                             2 of 14

have documented that the exposure to flour dust and associated aeroallergen of bakers, pastry makers
and mills workers during the process of flour manipulation has resulted in a variety of respiratory
effects that have been described among bakers, including impairment of pulmonary function and
chronic bronchitis [14]. Less well-known are the various risk factors present in the baking industry [13].
The bakeries, in fact, have always been subjected to frequent food hygiene checks, but investigations to
identify and assess the risk factors occurring during work activities inside bakeries are very rare [20,21].
      In workplaces where grain is handled, there is substantial evidence that workers develop
respiratory symptoms related to high concentrations of dust micro- and macroparticulate fractions
produced by various stages of the industrial process [22–30]. In particular, bioaerosols have been widely
studied in different occupational and nonoccupational settings, such as bakeries and flourmills [31,32].
      Knowing the true extent of the risk factors is an essential requirement in order to set up and adopt
a suitable and effective health protection system. The study of indoor air quality is fundamental to
understand the pollutants and concentrations to which workers are exposed, and this aspect in the
literature is quite unexplored.
      Indoor air pollution deriving from solid fuel (biomass and coal) combustion products is a relevant
public health issue, mainly in the developing world [7]. Several studies of indoor air quality have
identified cooking and in particular cooking using biomass or wood as a heating source as one of the
most significant activities that generates indoor particles [33–37]. In fact, cooking and biomass burning
emissions are among the main sources of particulate matter (PM) [38–40]. Different styles of cooking
generate aerosols with typical mass concentrations, size distribution and chemical compositions, and the
presence of well-known chemical carcinogens, such as PAHs (polycyclic aromatic hydrocarbons). PAHs
are released by incomplete combustion of organic substances [41,42] and regular exposure to these
substances at higher levels can be a modulating factor for the susceptibility of the exposed population
to pulmonary morbidity. The smoke generated during combustion is associated with a variety of
cancers, the most notable being lung cancer [43,44]. It is worth noting that there are still observed risks
to health in people exposed to cooking aerosols when they spend most of their time in environment
characterized by the presence of this aerosol for professional reasons. Bakers are therefore among the
workers categorized as those exposed to high PM concentrations emitted by burning wood.
      In the present work, we investigated the IAQ of an artisan bakery located in the Bari province of
South Italy. In particular, a high-time-resolution study of physical and chemical properties of aerosol
particles (particle number, size distribution and chemical composition) in an artisan bakery of Southern
Italy was carried out to provide a detailed aerosol characterization for better understanding of the
indoor air quality. In this bakery, a wood-fired oven operated. The main species emitted during bakery
operations (carbonaceous fraction, i.e., organic and elemental carbon, levoglucosan and main ions)
were quantified. This work represents the second part of indoor research activities performed in the
bakery. The first part was published by Ielpo et al. (2018) [1] in which a combination of approaches were
used, including analytical chemistry analyses to determine indoor PAHs concentrations, computational
fluid dynamics to reconstruct the air ventilation in response to air temperature gradients within the
working environment and health risk analysis to assess the risk to which the baker and coworkers
were exposed.
      To the best of the authors’ knowledge, no similar datasets are available for such working
environments, at least not in Italy.

2. Experiments

2.1. Sampling Site
     The object of this study is a bakery located in Bari province (South Italy). Details on site location,
climate and planar view of the bakery are shown in Ielpo et al. (2018) [1]. Here, we emphasize that the
bakery has characteristics that are typical for Southern Italian bakeries—it is equipped with two ovens:
a gas oven that is composed of seven levels, with openings of 3.7 m2 per level and a thermal power of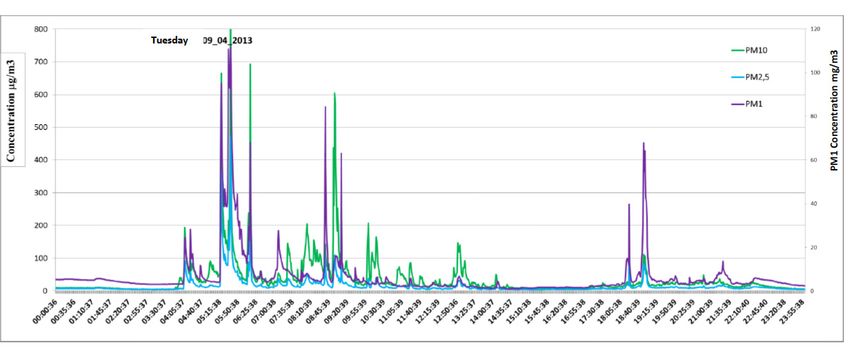
Atmosphere 2020, 11, 415                                                                            3 of 14

80,000 kcal/h, and a wood oven with an opening of 13 m2 and a thermal power of 80,000 kcal/h. In the
wood oven, oaken and olive wood and almond peelings are typically burned.
     In the bakery, working activities start early in the morning, at about 3:30. Generally the first
activity, a few minutes later than 3:30, is the flour housing in the kneading machine, followed by the
ovens switching on around 3:50 until 5:00, for the heating phase. Afterwards, oven cleaning activities
take place with ash removal. At around 5:00, the baking of rolls, sfilatino and rosetta (typical local
breads) and sandwiches in the gas oven starts. It remains switched on until about 7:30. At 6:30,
the wood oven is switched on again until 7:45 in order to obtain the correct temperature for bread
cooking. After oven cleaning and ash removal, at around 8:00, the baking of bigger bread takes place
until about 10:30. During the heating phase, almond peelings are burned every day except for Monday
and Saturday during which oaken wood is used. At 6:30, when the oven is again switched on, olive
wood is used every day except Friday and Saturday during which oaken wood is burned. In the oven
powered by gas, small size bread is cooked. In the wood-powered oven a larger size bread is cooked.
     In the afternoon, the oven powered by gas is switched on around 18:00 for cooking delicatessen
products, with the time changing somewhat from day-to-day according to the daily requirements. In
the bakery, about 150 kg of total flour per day is used, except for days with a major bread request.
     At the end of the day, starting from 20:30 to 22:00, cleaning activities of bakery rooms and ovens
(using an extractor) take place.

2.2. PM2.5 Indoor Sampling
     In the bakery, a monitoring campaign was performed during 7–19 April 2013 in order to collect
PM2.5 indoor samples and particle number concentration trends. In particular, indoor PM2.5 samples
were collected by a sequential air sampler (SILENT Sequential Air Sampler—FAI Instruments S.r.l.,
Roma, Italy) for six hours on quartz fiber filters (prefired 47 mm diameter Pallflex, Pall Corporation,
Port Washington, New York) equipped with sampling heads operating at a flow rate of 10 L/min with
a relative uncertainty of 5% of the measured value. Four PM2.5 samples were collected every day.
     Filters were weighed before and after the particulate sampling with a Genius Sartorius SE2-F
analytical microbalance with a sensitivity of 0.0001 mg (Sartorius, Milan, Italy) and equipped with
an ionizer for electrostatic charge abatement. The relative humidity (RH) and temperature in the
weighing room were 44% ± 7% and 22 ± 3 ◦ C and the samples were kept in these conditions for 48 h
before weighing.
     During the day, PM2.5 sampling intervals were from 3:00 to 9:00 (first sampling interval), from
9:00 to 13:30 (second), from 14:00 to 21:00 (third sampling interval) and from 21:00 to 3:00 (fourth).
These sampling intervals were chosen in order to sample according to the different kind of activities
performed in the bakery. Most of the bakery productions occur during the first and second sampling
interval, together with the lighting of both gas and wood ovens. During the third sampling period,
only a short lighting of the gas oven for the afternoon production and clean activities occurs. The
fourth sampling interval corresponds with the closure hours of the bakery.
     Four PM2.5 samples were collected every day, with a total number of 40 PM2.5 valid samples
(on 7, 14 and 17 April some problems occurred with the sampling system and these filters were not
considered).
     The filters were cut into four pieces for the chemical analyses. On each sample OC (organic
carbon), EC (elemental carbon), LG (levoglucosan) Cl− (chloride), NO2 − (nitrite), NO3 − (nitrate), SO4 2−
(sulfate), C2 O4 2− (oxalate), Na+ (sodium), NH4 + (ammonium), K+ (potassium), Mg2+ (magnesium)
and Ca2+ (calcium) were quantified.

2.3. Particle Size Distribution
    During the indoor monitoring campaign, in addition to the SILENT sampler, an optical particle
counter (OPC) multichannel monitor (FAI Instruments, Rome, Italy) was used in order to obtain
temporal trends of the particulate matter granulometric distribution. This instrument, operating with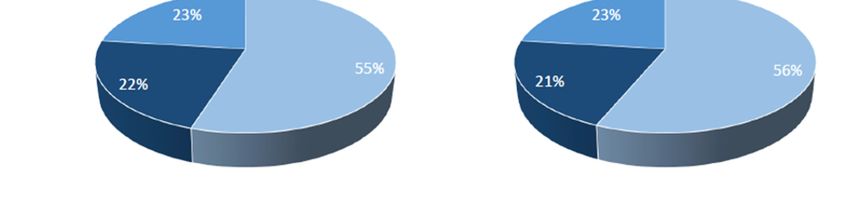
Atmosphere 2020, 11, 415                                                                                                4 of 14

sampling flow of 1 L/min and based on laser scattering and the elliptical mirror principle, collects
particle numerical counts per liter in eight optical channels with thresholds having the following lower
limits: 0.28, 0.4, 0.5, 0.7, 1.1, 2.0, 3.0, 5.0 m, and a time resolution of 1 min.
     The OPC monitor, using particle number concentration collected per each granulometric size,
was able to estimate mass concentration of particulate matter fractions PM10 , PM2.5 and PM1 by a
particular parametric algorithm internal to the instruments. Before starting the campaign, the OPC
was connected by serial communication with a SWAM monitor (a mass sampling device based on the
attenuation method) in simultaneous sampling. In this way, it was possible to transfer PM fraction
mass concentration data measured by SWAM to the OPC. By using the real data of PM fraction mass
concentration, the OPC improves its mass estimations by a self-learning process that updates the
parameters used in the parametric algorithm.
     The OPC monitor and Silent sampler were positioned in a zone of the bakery’s laboratory with
sampling heads at about 160 cm from ground.

2.4. Inorganic Components Analyses
     An ICS-1000 ion chromatograph (Dionex) was used for the water-soluble inorganic constituents
determination (Cl− , NO2 − , NO3 − , SO4 2− , C2 O4 2− , Na+ , NH4 + , K+ , Mg2+ and Ca2+ ). The sample was
dissolved in a total Milli-Q water volume of 10 mL. The setup of the extraction procedure is described
in detail in Fermo et al. (2006) a and Piazzalunga et al. (2013) [45,46]. All reagents were of analytical
grade (Fluka, Milwaukee, WI, USA). Ultrapure water was produced by a Milli-Q system (Millipore,
Bedford, MA, USA). All the ion concentrations determined were higher than the limit of detection
(LOD) for this technique [46].

2.5. Carbonaceous Fraction and Anhydrosugars Analysis
     OC and EC mass concentrations were determined on a punch (1.5 cm2 ) taken from each quartz filter
by thermal optical transmittance (TOT) technique (Sunset Carbon Analyzer, Tigard, Oregon) exploiting
the high-temperature NIOSH (National Institute for Occupational Safety and Health) protocol [47–49].
     The analyses for levoglucosan (LG) were carried out after extraction from the quartz fiber filters,
following the methodology described for the water soluble ions, by High-Performance Anion-Exchange
Chromatography with Pulsed Amperometric Detection (HPAEC–PAD) using an ion chromatograph
Dionex ICS1000 [48,50]. As eluent, NaOH 18 mM was used with a flow rate of 0.5 mL/min. An
amperometric detector (Dionex ED50) equipped with an electrochemical cell was used [46].

3. Results

3.1. PM2.5 Concentrations
    As shown in Table 1, higher PM2.5 mean concentrations were found during the first and second
sampling intervals.

                            Table 1. PM2.5 mean concentrations for each sampling range.

                          Mean                                      Max                  Min
    Sampling                                Standard Dev                                                    Number of
                       Concentration                            Concentration        Concentration
     Range                                     (µg/m3 )                                                      Samples
                         (µg/m3 )                                 (µg/m3 )             (µg/m3 )
     3:00–9:00               110                  16                  140                   79                   10
    9:00–13:30               118                  47                  281                   77                   10
    14:00–21:00               65                   8                   82                   55                   10
    21:00–3:00                67                  11                   89                   54                   10
       The standard deviation values shown in [1] (page 28765) exhibit a misprint. The correct values are shown here.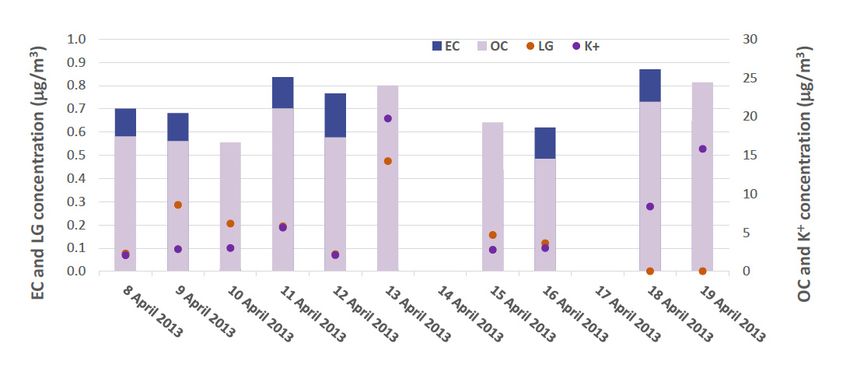
The indoor total mean concentration of PM2.5 for all sampling days was 90 ± 18 g/m3. The
outdoor PM2.5 mean concentration obtained from the closest air quality monitoring station of ARPA
Puglia (Environmental Protection Regional Agency of Apulia) during sampling days in the bakery
was 12 ± 3 g/m3 while the outdoor PM10 mean concentration was 17 ± 4 g/m3. The result that the
indoor PM
Atmosphere mean
2.5 11,
2020, 415 concentration was bigger than outdoor PM2.5 suggests dominant indoor sources
5 of 14
for PM2.5.
The indoor total mean concentration of PM2.5 for all sampling days was 90 ± 18 g/m3 . The
3.2. Optical Particle Counts (OPC): Fine and Coarse Fraction Trends and Tendency of Derived Parameters
outdoor PM2.5 mean concentration obtained from the closest air quality monitoring station of ARPA
PugliaIn(Environmental
Figure 1, PM10Protection
, PM2.5 and PM1 mass
Regional Agency concentration trendssampling
of Apulia) during obtaineddays by in
OPCthe in a typical
bakery was
working
12 ± 3 g/mday 3 are shown.
while the outdoorIt is possible
PM10 mean to observe a light increase
concentration was 17 ± of4all
g/mthe. fractions
3 The result starting
that thefrom
indoor4:00
that
PM reached
2.5 mean higher values
concentration between
was bigger 5:15
than and 6:00.
outdoor Afterwards,
PM 2.5 concentrations
suggests dominant decreased,
indoor sources even
for if
PMsome
2.5 .
peaks were observed at 7:05, 8:45 and 9:10. In the early morning, all the size fractions showed lower
3.2.
peaksOptical
(aboutParticle Counts
200 µg/m 3) at (OPC):
about 4:00Fineand
andlarger
Coarseconcentrations
Fraction Trends andaTendency
with maximum of at
Derived Parameters
more than 700 µg/m3
at about 9:00.1,An
In Figure PManalogous trend was observed considering the particle number per liter for fine
10 , PM2.5 and PM1 mass concentration trends obtained by OPC in a typical working
(0.28–1.10 µm) and coarse (>
day are shown. It is possible to observe 1.10 µm) fractions.
a light increasePMof10 all
peaks were probably
the fractions startingduefromto4:00
thethat
wood oven
reached
cleaning
higher activities,
values between while5:15fine
andfraction peaks were
6:00. Afterwards, due both to decreased,
concentrations the combustion even if processes
some peaks andwerefood
cooking.
observed at 7:05, 8:45 and 9:10. In the early morning, all the size fractions showed lower peaks (about
200 µg/m PM10
3 )and PM1 fractions
at about showed
4:00 and larger a different pattern
concentrations with aduring
maximum the day, suggesting
at more than 700different
µg/m3 at emission
about
sources. During the afternoon, the particle number of fine fraction increased
9:00. An analogous trend was observed considering the particle number per liter for fine (0.28–1.10 µm) again from 18:00, with
an intense peak at about 18:45. This was due to the lighting of the gas
and coarse (>1.10 µm) fractions. PM10 peaks were probably due to the wood oven cleaning activities, oven. Mass concentration
temporal
while patternspeaks
fine fraction shownwere in Figure
due both1 cantobe
theconsidered
combustion similar for all
processes working
and days.
food cooking.
Figure 1. Typical OPC PM10 , PM2.5 and PM1 concentration trend during a working day (09 April 2013)
Figure 1. Typical OPC PM10, PM2.5 and PM1 concentration trend during a working day (09 April 2013)
in the bakery.
in the bakery.
PM10 and PM1 fractions showed a different pattern during the day, suggesting different emission
In Figure 2a, the mean trend for the fine fraction obtained by considering all working days
sources. During the afternoon, the particle number of fine fraction increased again from 18:00, with an
during the whole sampling period is shown. The bakery works from Monday to Saturday. On
intense peak at about 18:45. This was due to the lighting of the gas oven. Mass concentration temporal
Sunday, it is closed. The fine fraction considered here shows the particles with an optical diameter of
patterns shown in Figure 1 can be considered similar for all working days.
less than 1.10 m according to the channel threshold of the OPC, and keeping in mind the mass
In Figure 2a, the mean trend for the fine fraction obtained by considering all working days during
fractions supplied by OPC, as shown in Figure 1. The coarse fraction considered in Figure 2b shows
the whole sampling period is shown. The bakery works from Monday to Saturday. On Sunday, it is
particles with an optical diameter bigger than 1.10 m.
closed. The fine fraction considered here shows the particles with an optical diameter of less than
In Figure 2a, it is possible to observe a small increase in particle number starting from 4:00 that
1.10 m according to the channel threshold of the OPC, and keeping in mind the mass fractions supplied
reached a maximum after 5:00 until 6:00. Afterwards, the particle count decreased even if some peaks
by OPC, as shown in Figure 1. The coarse fraction considered in Figure 2b shows particles with an
were observed around 7:00 and 9:00. During afternoon, particle numbers of the fine fraction increased
optical diameter bigger than 1.10 m.
again from 18:00, with an intense peak at about 18:45.
In Figure 2a, it is possible to observe a small increase in particle number starting from 4:00 that
reached a maximum after 5:00 until 6:00. Afterwards, the particle count decreased even if some peaks
were observed around 7:00 and 9:00. During afternoon, particle numbers of the fine fraction increased
again from 18:00, with an intense peak at about 18:45.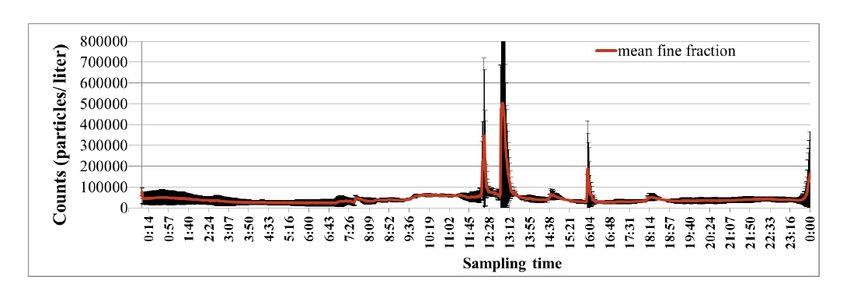
Atmosphere 2020, 11, 415 6 of 14
Atmosphere 2020, 11, x FOR PEER REVIEW 6 of 15
Atmosphere 2020, 11, x FOR PEER REVIEW 6 of 15
Figure 2. (a) Mean fine fraction (0.28–1.10 µm) obtained by considering all bakery working days
Figure2.
Figure
during 2.(a)
the(a) Meanfine
Mean
sampling fine fraction
fraction
period and (0.28–1.10
(0.28–1.10
(b) meanµm) µm)
coarse obtained
obtained by considering
by considering
fraction (>1.10 all considering
all bakery
µm) obtained bakery
workingworking
days days
all during
bakery
during
the the
sampling
working sampling
days period period
duringand
the(b) and (b)
mean
sampling mean
coarse coarse(>1.10
fraction
period. fraction (>1.10
µm) µm) obtained
obtained consideringconsidering
all bakeryall bakery
working
working
days days
during theduring the sampling
sampling period. period.
In Figure 2b, the corresponding coarse fraction mean trend is reported. It is possible to observe
a lightIn Figure
Figure2b,
Inincrease in the
2b, thecorresponding
coarse corresponding
particle countcoarse
coarse fraction
frommean
fraction
starting mean
about trend
4:00.isThe
trend isreported.
countsItreached
reported. Itis is
possible
possible toto
higher observe
observe
values a
at
light increase
approximately in
a light increase5:00 coarse
in coarse particle
to 7:00, particlecount
count
but these starting
starting
values from
werefrom about 4:00.
about 4:00.
considerably The counts
The counts
lower reached
reached
than what higher values
higher values
was observed for theat
at
approximately
approximately 5:00
5:00 to
to 7:00,
7:00, but
but these
these values
values were
were considerably
considerably lower
lower than
than what
what
finer fraction. In this sampling time interval, the peaks reached 30,000 particles counts. In the rest of was
was observed
observed for
for the
the
finer
finer
the fraction.
day,fraction. In this
In
a few peaks thisoccurred
sampling
sampling timeinterval,
time
around interval, theand
the
9:00, 13:00 peaks
peaks reached
reached
18:00, but the 30,000
30,000 particles
peakparticles
value did counts.
counts. InInthethe
not exceeded rest
rest
5000of
of
thethe
day,day,
a a
fewfew peaks
peaks occurred
occurred around
around 9:00,
9:00, 13:0013:00
and and 18:00,
18:00, but but
the the
peak
counts. In the afternoon, at about 17:00, the bakery activities start again, mostly for afternoon peak
valuevalue
did did
not not exceeded
exceeded 5000
5000
counts.counts.
production In theIn the
and saleafternoon,
afternoon, at about
at about
(see discussion 17:00,
17:00,
section thethe
for bakery
bakery
more activitiesstart
activities
details). startagain,
again, mostly
mostly forfor afternoon
afternoon
production
production
In Figure and sale
and3,sale (see
the (see discussion
fine discussion section
fraction meansection for more
for more
during details).
details).days (two Sundays) is shown. The fine
nonworking
In
In Figure
Figure 3,
3, the
the fine
fine fraction
fraction mean
mean during
during
fraction peaks between 12:00 and 13:30 were due to the wood nonworking
nonworking days
days
oven (two
(two Sundays)
on byisisthe
Sundays)
turned shown.
bakerThe
shown. The fine
fine
to cook
fraction
fraction peaks
peaks between
between 12:00
12:00 and
and 13:30
13:30 were
were due
due to
to the
the wood
wood oven
oven turned
turned
lasagne (a typical Italian dish) for her family lunch during the first Sunday of sampling campaign. on
on by
by the
the baker
baker to
to cook
cook
lasagne
lasagne (a (a typical
typical Italian
Italiandish)
dish)for
forher
herfamily
familylunch
lunchduring
duringthe thefirst
firstSunday
Sundayof ofsampling
samplingcampaign.
campaign.
Figure 3. Fine fraction (0.28–1.10 µm) mean obtained for the bakery nonworking days (Sundays) during
Figure 3. Fine fraction (0.28–1.10 µm) mean obtained for the bakery nonworking days (Sundays)
sampling3. period.
Figure sampling
Fine fraction
during period.(0.28–1.10 µm) mean obtained for the bakery nonworking days (Sundays)
during sampling period.
Observing Figure 4, coarse fraction peaks in Sunday morning revealed the presence of the baker
Observing Figure 4, coarse fraction peaks in Sunday morning revealed the presence of the baker
for some light cleaning activities, as he himself reported. In addition, the increase of the coarse fraction
Observing
for some Figure 4, activities,
light cleaning coarse fraction
as hepeaks in Sunday
himself morning
reported. revealed
In addition, thetheincrease
presence
ofofthe
thecoarse
baker
between 11:30 and 13:40 was due to the presence of the baker in the laboratory (see Figure 2b).
for some light cleaning activities, as he himself reported. In addition, the increase of
fraction between 11:30 and 13:40 was due to the presence of the baker in the laboratory (see Figurethe coarse
fraction between 11:30 and 13:40 was due to the presence of the baker in the laboratory (see Figure
2b).
2b).Figure 4. Coarse fraction (>1.10 µm) mean obtained by considering all bakery nonworking days
(Sundays) during sampling period.
Atmosphere 2020, 11, 415 7 of 14
Atmosphere 2020, 11, x FOR PEER REVIEW 7 of 15
In Figure 5, the PM2.5/PM10 mean concentration ratio during all sampling intervals per day is
shown for the first week of sampling. PM2.5 and PM10 mean values were obtained from OPC data
considering the four sampling intervals, that is, 3:00–9:00, 9:00–15:00, 15:00–21:00 and 21:00–3:00. For
brevity, the corresponding trend plot for the second sampling week is not shown because it is similar
to the one for the first week.
Observing Figure 5, the PM2.5/PM10 concentration ratio per sampling time was rather similar for
the six days considered, except for a few cases, such as Wednesday during the first sampling time.
Concerning this, it is needed to keep in mind that major bakery activities were repeated every day,
but during particular days other activities such as taralli or friselle (typical local breads) production
were included.
At the beginning of the working day, PM2.5/PM10 ratio suggests the relevance of fine particulate,
probably due to the oven's functioning and thus to the combustion processes. In the second interval,
the ratio decreased, probably due to the continuous use of flour during morning activities. Flour and
water vapor,
Figure 4. due to their
Coarse fractionsize, contribute
(>1.10 µm) mean to the coarsebyfraction
obtained of PM.
considering all In the second
bakery part of
nonworking the day,
days
Figurethe
after(Sundays)
14:00, 4. Coarse
working fraction
activities (>1.10andµm) mean
flour use obtained
decreased. by This
considering
resulted allinbakery nonworking
decreasing coarse days
particles
during sampling period.
(Sundays)
and thus in theduring sampling
increasing PMperiod.
2.5/PM10 ratio. In the fourth sampling interval (21:00–3:00), when the
bakery was closed,
In Figure 5, thethe
PMPM 2.5 /PM
2.5/PM ratioconcentration
mean
10 10 showed the higher ratio values
duringdue to the fact intervals
all sampling that flourper
andday water
is
vaporInfor
shown Figure
particles 5,were
the first the
weekPM of2.5/PM10 mean concentration ratio during all sampling intervals per day is
deposited,
sampling. while
PMfine
2.5 and particles
PM 10 due
mean to the
values oven’s
were combustion
obtained from stayed
OPC datain
shown for the first week of sampling. PM 2.5 and PM10 mean values were obtained from OPC data
suspension.the four sampling intervals, that is, 3:00–9:00, 9:00–15:00, 15:00–21:00 and 21:00–3:00. For
considering
considering
brevity, the four sampling
the corresponding trendintervals,
plot for thethat is, 3:00–9:00,
second sampling 9:00–15:00, 15:00–21:00
week is not and 21:00–3:00.
shown because For
it is similar
brevity, the corresponding
to the one for the first week. trend plot for the second sampling week is not shown because it is similar
to the one for the first week.
Observing Figure 5, the PM2.5/PM10 concentration ratio per sampling time was rather similar for
the six days considered, except for a few cases, such as Wednesday during the first sampling time.
Concerning this, it is needed to keep in mind that major bakery activities were repeated every day,
but during particular days other activities such as taralli or friselle (typical local breads) production
were included.
At the beginning of the working day, PM2.5/PM10 ratio suggests the relevance of fine particulate,
probably due to the oven's functioning and thus to the combustion processes. In the second interval,
the ratio decreased, probably due to the continuous use of flour during morning activities. Flour and
water vapor, due to their size, contribute to the coarse fraction of PM. In the second part of the day,
after 14:00, the working activities and flour use decreased. This resulted in decreasing coarse particles
and thus in the increasing PM2.5/PM10 ratio. In the fourth sampling interval (21:00–3:00), when the
bakery was closed, the PM2.5/PM10 ratio showed the higher values due to the fact that flour and water
vapor particles were deposited, while fine particles due to the oven’s combustion stayed in
suspension.
Figure 5. PM2.5 /PM10 concentration ratio during all sampling intervals for working days of the first
week of sampling.
Observing Figure 5, the PM2.5 /PM10 concentration ratio per sampling time was rather similar for
the six days considered, except for a few cases, such as Wednesday during the first sampling time.
Concerning this, it is needed to keep in mind that major bakery activities were repeated every day,
but during particular days other activities such as taralli or friselle (typical local breads) production
were included.
At the beginning of the working day, PM2.5 /PM10 ratio suggests the relevance of fine particulate,
probably due to the oven’s functioning and thus to the combustion processes. In the second interval,
the ratio decreased, probably due to the continuous use of flour during morning activities. Flour and
water vapor, due to their size, contribute to the coarse fraction of PM. In the second part of the day,
after 14:00, the working activities and flour use decreased. This resulted in decreasing coarse particles
and thus in the increasing PM2.5 /PM10 ratio. In the fourth sampling interval (21:00–3:00), when the
bakery was closed, the PM2.5 /PM10 ratio showed the higher values due to the fact that flour and water
vapor particles were deposited, while fine particles due to the oven’s combustion stayed in suspension.Atmosphere 2020, 11, x FOR PEER REVIEW 8 of 15
Atmosphere Figure
2020, 11,
5. 415
PM2.5/PM10 concentration ratio during all sampling intervals for working days of the first 8 of 14
week of sampling.
3.3. PM PMChemical
3.3. 2.5 Composition
2.5 Chemical Composition
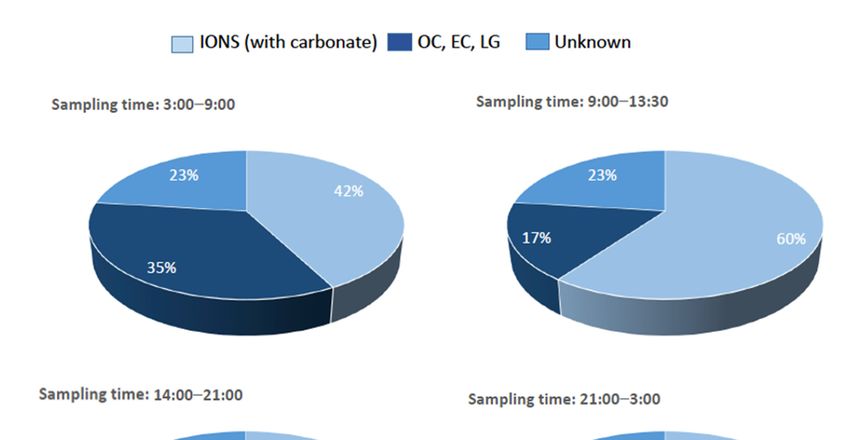
In Figure 6, the percentage chemical composition of PM2.5 for each sampling interval is shown.
In Figure 6, the percentage chemical composition of PM2.5 for each
It is possible to note that the percentage quantity of the carbonaceous
sampling interval is shown. It
fraction was high during the
is possible
first sampling interval (3:00–9:00) and decreased until it stabilized in the was
to note that the percentage quantity of the carbonaceous fraction high during
following the first
intervals,
sampling interval
according to the(3:00–9:00) and
more intense decreased
activity of the until
ovensitinstabilized in the
early morning following intervals, according to
hours.
the more intense activity of the ovens in early morning hours.
Figure 6. The percentage chemical composition of PM2.5 in the different sampling intervals.
Figure 6. of
The speciation Thethe
percentage chemical composition
carbonaceous fraction inofOC,
PM2.5EC
in the
anddifferent
LG issampling intervals.
highlighted in Figure 7. It is
possible to note that OC, EC and LG mean concentrations monitored during the first sampling interval,
The2020,
Atmosphere speciation ofPEER
11, x FOR the carbonaceous
REVIEW fraction in OC, EC and LG is highlighted in Figure 7. It is 9 of 15
when the ovens were switched on, were larger than those in the other intervals.
possible to note that OC, EC and LG mean concentrations monitored during the first sampling
interval, when the ovens were switched on, were larger than those in the other intervals.
Figure 7. OC, EC, LG and K+ mean concentrations for each sampling interval.
Figure 7. OC, EC, LG and K+ mean concentrations for each sampling interval.
4. Discussion.
Most bakery production occurred during the first and second sampling interval, together withAtmosphere 2020, 11, 415 9 of 14
4. Discussion
Most bakery production occurred during the first and second sampling interval, together with the
lighting of both gas and wood ovens. This resulted in the production of coarse particulates mainly
made of flour and water, and finer particulate due to the combustion process of the ovens. During the
third sampling period, only a short lighting of the gas oven for the afternoon production and cleaning
activities occurred. The fourth sampling interval corresponded to the closure hours of the bakery. In
particular, fine and coarse fractions showed an increase starting from when the ovens were first lit.
Observing Figures 1 and 2a,b, it is possible to note that the particle coarse fraction was mostly due to
the handling of the raw materials, wood oven cleaning activities and the presence of humans in the
bakery. Particulate fine fraction can be linked mainly to the combustion processes and food cooking.
Major bakery activities were repeated every day. Sometimes a small time shift (30 min) occurred from
day-to-day. Moreover, during particular days, other activities such as taralli or friselle (typical local
breads) production were added.
As noted, PM2.5 sampling was scheduled in order to sample according to the different kinds of
activities performed in the bakery.
Indoor PM2.5 mean concentration (see Table 1) was larger than outdoors suggesting dominant
indoor sources for PM2.5 . Even if indoor PM2.5 mean concentrations values were bigger than outdoor
values, they were lower than the threshold-limit value–time-weighted average (TLV–TWA), which is
the exposure limit based on the average amount of a chemical substance that a worker is exposed to
over a 40 h workweek (eight hour workdays) reported in the American Conference of Governmental
Industrial Hygienists (ACGIH) (2018) [51]. These limits correspond to 3 mg/m3 PM respirable, 10 mg/m3
PM inhalable and 0.5 mg/m3 PM2.5 for flour dust.
It is worth noting that in our PM2.5 samples, among ions, Ca2+ , K+ and SO4 2− were the more
abundant concentrations in the first and second intervals (see Table 2). It is also worth noticing
that higher potassium concentrations were associated with higher nitrate during wood combustion
processes (i.e., during the first and the second intervals) in accordance with literature reports [52,53].
Furthermore, potassium sulfate is one of the most abundant gas phase species that forms during
biomass combustion [54,55]. In another study in the literature, it is reported how volatile ash-forming
elements in wood fuels are mainly alkali metals, chlorine and sulfur, and among the ash compounds
measured there are potassium, sulfates, chlorides and carbonates [56]. In our case, the higher Cl−
concentration was registered during the first interval.
Table 2. Mean concentration and standard deviation for monitored ions in PM2.5 samples during the
four sampling intervals.
HCOO− Cl− NO2 − NO3 − SO4 2− C2 O4 2− Na+ NH4 + K+ Mg2+ Ca2+
Sampling
Mean Mean Mean Mean Mean Mean Mean Mean Mean Mean Mean
Interval
Std Std Std Std Std Std Std Std Std Std Std
3:00–9:00 0.20 3.09 1.65 1.07 4.84 1.18 2.22 1.16 3.87 0.20 13.12
0.05 2.49 0.38 0.67 0.76 0.19 2.17 1.50 2.88 0.07 6.47
9:00–13:30 0.24 2.04 4.58 1.65 6.60 1.53 3.64 1.62 5.08 0.34 16.45
0.03 1.01 0.93 0.38 2.40 0.26 2.67 1.53 4.51 0.25 7.41
14:00–21:00 0.22 1.67 2.37 0.94 4.51 0.96 0.91 1.32 1.67 0.17 9.45
0.06 2.79 0.81 0.35 1.19 0.14 0.24 1.02 0.50 0.14 2.11
21:00–3:00 0.19 2.15 2.74 1.20 5.01 1.08 1.99 2.16 2.52 0.10 8.26
0.01 2.21 0.96 0.43 1.30 0.19 1.78 1.40 1.89 0.03 2.71
As shown in Figures 6 and 7, the PM2.5 carbonaceous components represent a relevant part
particularly during the first sampling interval (3:00–9:00). During other sampling intervals both
absolute and percentage values decreased about 20%, according to the more intense activity of the
ovens in early morning hours. Table 3 shows EC, OC and K+ mean concentrations in outdoor PM2.5
samples collected at monitoring sites close to the bakery location. Note that indoor OC mean valuesAtmosphere 2020, 11, 415 10 of 14
were bigger than outdoor ones, indoor EC mean values were similar to outdoor ones, and indoor K+
mean values were bigger than outdoor ones.
Table 3. OC, EC and K+ mean values in outdoor PM2.5 samples and indoor (bakery) PM2.5 samples.
Site OC (µg/m3 ) EC (µg/m3 ) K+ (µg/m3 )
PeP winter 5.3 ± 3.0 2.0 ± 0.8 0.38 ± 0.26
PeP summer 3.8 ± 1.2 1.5 ± 0.6 0.36 ± 0.20
San Nicola winter 5.2 ± 2.5 1.8 ± 0.9 0.37 ± 0.23
San Nicola summer 4.0 ± 3.3 1.6 ± 0.9 0.51 ± 0.58
Casamssima winter 7.6 ± 2.9 1.9 ± 1.1 0.42 ± 0.21
Casamssima summer 3.8 ± 0.7 1.4 ± 0.4 0.39 ± 0.12
Bakery 14 (min)–36 (max) 0.23 (min)–1.08 (max) 1.67 (min)–6.55(max)
The different indoor-to-outdoor concentration ratio between the combustion markers may be due
to the higher coarse contribution of OC and K+ with respect to EC in indoor compared to outdoor
ambient air. Literature reports observe that EC represents an important component of PM2.5 mass
concentration indoors and in chimney exhaust. Among elements, potassium, chlorine and sulfur are
the most relevant in terms of concentration. Furthermore, EC coming from the burning of biomass is
characterized by a smaller size and is related to adverse effects on human health, beyond being an
important agent in climatic change [57].
The correlation matrices of the PM2.5 chemical components in the four sampling intervals (not
shown), and in particular the analysis of correlations for OC with other components, may give insights
about transformations of organic carbon in fine particulate occurring during the day. In fact, in the
first sampling interval (3:00–9:00) a significant correlation (0.70) of OC with LG was observed. LG is a
compound directly linked to the emission of biomass combustion. Instead, in the second sampling
interval (9:00–13:30), OC was found to show the highest correlation with K+ (0.85), as well as with
other inorganic components of the PM. This could indicate a process leading to the formation of a
particulate in which the inorganic and carbonaceous components were more intimately linked together.
Moreover, although LG and K+ were both combustion markers, they showed different time trends as
shown in Figure 7. LG concentrations progressively decreased from the first to the fourth sampling
interval, while a maximum was observed for K+ concentration in the second one (9:00–13:30). Finally,
the significant correlations of OC with HCOO− (0.70) in the third sampling interval (14:00–21:00) and
with C2 O4 2− (0.77) in the fourth sampling interval (21:00–3:00) may support the hypothesis of an
aging process of the OC (oxidation) in the hours of the day when the combustion sources were no
longer active.
Moreover, observing the mean values of LG/K+ ratio shown in Table 4 for the different sampling
intervals, it is evident that the ratio in the first sampling interval was bigger than in the other intervals.
In fact, during the first sampling interval, when the wood oven was switched on, LG concentrations
were higher. At about 8:00, cleaning of wood oven and ash removal took place; the LG source
was switched off and its concentrations in the second, third and fourth intervals were lower with a
consequential decrease of the LG/K+ ratio.
Table 4. Mean value and standard deviation of the LG/ K+ ratio in each sampling interval.
Sampling Interval LG/K+ Average Ratio Ratio Standard Deviation
3:00–9:00 0.37 0.27
9:00–13:30 0.05 0.02
14:00–21:00 0.09 0.04
21:00–3:00 0.05 0.02
In the second sampling interval, K+ mean concentration showed an increase and the LG/K+ ratio
decreased to 0.05. The K+ mean concentration trend during the first and second sampling intervalsAtmosphere 2020, 11, 415 11 of 14
suggests a relevant second source emission of K+ , that of flour. As shown in Table 5, potassium is
among the micronutrients present in the flour, one of the most relevant. Moreover, potassium contained
in flour is soluble. Taking this into account, the high correlation between OC and K+ could be due to
the organic constituents (such as starch and fibers) derived from flour.
Table 5. Micronutrients (as ions) present in 100 g of some kind of frumento flour (INRAN-Istituto
Nazionale di Ricerca per gli Alimenti e la Nutrizione, 2000) [58].
Sodium Potassium Iron Calcium Phosphorus Thiamine Riboflavin Niacin
(mg) (mg) (mg) (mg) (mg) (mg) (mg) (mg)
Type 00 Flour 3 126 0.7 17 76 0.1 0.03 1
Type 0 Flour 2 140 0.9 18 160 0.25 0.04 1.2
Wholemeal
3 337 3 28 300 0.4 0.16 5
Flour
If we consider the daily K+ concentrations during the second sampling interval (9:00–13:30), as
shown in Figure 8, it is possible to note that PM2.5 samples collected during 13 and 19 April showed
significantly higher potassium concentrations than the other days. This can be explained by considering
that on Saturday, 13 April, the bakery produced more bread (using about a double quantity of flour
compared to the other working days) due to a major bread request. During the morning of 19 April,
more flour2020,
Atmosphere was11,used
x FORbecause of the production of taralli (with a larger quantity of flour, about1216ofkg
PEER REVIEW 15
more), for which the flour is used for sprinkling.
Figure 8. LG, EC, OC and K+ concentrations during the second sampling interval for all sampling
days.
FigureOn8. 7,LG,
14 and
EC, 17
OCApril
and some problems occurred
K+ concentrations duringwith
the the sampling
second system
sampling and these
interval filters
for all were
sampling
not considered.
days. On 7, 14 and 17 April some problems occurred with the sampling system and these filters were
not considered.
5. Conclusions
5. Conclusions
Within this paper, aerosol particulate matter emissions (PM2.5 ) within a bakery were studied both
from Within
the pointthis
of view of aerosol
paper, the chemical composition
particulate matter(ions, levoglucosan
emissions (PM2.5) and carbonaceous
within components)
a bakery were studied
and from the point of view of the particle size distribution. The main sources of particles
both from the point of view of the chemical composition (ions, levoglucosan and carbonaceous were wood
burning (in correspondence
components) with the
and from the point interval
of view time
of the when size
particle the wood oven was
distribution. Theswitched on), the
main sources of cleaning
particles
of ovens (ash removal), and the baking of bread. The latter was responsible for the
were wood burning (in correspondence with the interval time when the wood oven was switched emission of fine
particles while the wood combustion was associated with both coarse and fine fraction particles.
on), the cleaning of ovens (ash removal), and the baking of bread. The latter was responsible for While
the
levoglucosan was associated with a wood burning source, potassium in this case can
emission of fine particles while the wood combustion was associated with both coarse and fine be considered as
afraction
markerparticles.
of the contribution of the bakery
While levoglucosan wasactivities.
associated with a wood burning source, potassium in this
case can be considered as a marker of the contribution of the bakery activities.
Author Contributions: Conceptualization, I.P.; methodology, F.P. and I.P.; software, G.A.; validation, A.V.,
U.V.F. and P.C.M.; formal analysis, F.P.; investigation, I.P., U.V.F.; data curation, F.P. and A.V.; writing—original
draft preparation, I.P. and F.P.; writing—review and editing, G.A.; visualization, P.C.M.; supervision, I.P. All
authors have read and agreed to the published version of the manuscript.
Funding: This research received no external funding
Acknowledgments: Authors wish to thank Antonio Imperatore for FAI Instruments s.r.l. and Franco ColaciccoAtmosphere 2020, 11, 415 12 of 14
Author Contributions: Conceptualization, P.I.; methodology, P.F. and P.I.; software, A.G.; validation, V.A., V.F.U.
and C.M.P.; formal analysis, P.F.; investigation, P.I., V.F.U.; data curation, P.F. and V.A.; writing—original draft
preparation, P.I. and P.F.; writing—review and editing, A.G.; visualization, C.M.P.; supervision, P.I. All authors
have read and agreed to the published version of the manuscript.
Funding: This research received no external funding.
Acknowledgments: Authors wish to thank Antonio Imperatore for FAI Instruments s.r.l. and Franco Colacicco
for bakery “da Teresa” for their willingness to facilitate our research and technical support.
Conflicts of Interest: The authors declare no conflict of interest.
References
1. Ielpo, P.; Taurino, M.R.; Buccolieri, R.; Placentino, C.M.; Gallone, F.; Ancona, V.; Di Sabatino, S. Polycyclic
aromatic hydrocarbons in a bakery indoor air: Trends, dynamics, and dispersion. Environ. Sci. Pollut. Res.
2018, 25, 28760–28771. [CrossRef]
2. Koistinen, K.J.; Hänninen, O.; Rotko, T.; Edwards, R.D.; Moschandreas, D.; Jantunen, M.J. Behavioral and
environmental determinants of personal exposures to PM2.5 in EXPOLIS-Helsinki, Finland. Atmos. Environ.
2001, 35, 2473–2481. [CrossRef]
3. Scapellato, M.L.; Canova, C.; de Simone, A.; Carrieri, M.; Maestrelli, P.; Simonato, L.; Bartolucci, G.B. Personal
PM10 exposure in asthmatic adults in Padova, Italy: Seasonal variability and factors affecting individual
concentrations of particulate matter. Int. J. Hyg. Environ. Health 2009, 212, 626–636. [CrossRef] [PubMed]
4. Delgado-Saborit, J.M.; Stark, C.; Harrison, R.M. Carcinogenic potential, levels and sources of polycyclic
aromatic hydrocarbon mixtures in indoor and outdoor environments and their implications for air quality
standards. Environ. Int. 2011, 37, 383–392. [CrossRef] [PubMed]
5. Varghese, B.M.; Hansen, A.L.; Williams, S.; Bi, P.; Hanson-Easey, S.; Barnett, A.G.; Heyworth, J.S.; Sim, M.R.;
Rowett, S.; Nitschke, M.; et al. Heat-related injuries in Australian workplaces: Perspectives from health and
safety representatives. Saf. Sci. 2020, 126. [CrossRef]
6. Madureira, J.; Slezakova, K.; Silva, A.I.; Lage, B.; Mendes, A.; Aguiar, L.; Pereira, M.C.; Teixeira, J.P.; Costa, C.
Assessment of indoor air exposure at residential homes: Inhalation dose and lung deposition of PM10 , PM2.5
and ultrafine particles among newborn children and their mothers. Sci. Total Environ. 2020, 717. [CrossRef]
[PubMed]
7. Downward, G.S.; van der Zwaag, H.P.; Simons, L.; Meliefste, K.; Tefera, Y.; Carreon, J.R.; Vermeulen, R.;
Smit, L.A.M. Occupational exposure to indoor air pollution among bakery workers in Ethiopia; A comparison
of electric and biomass cookstoves. Environ. Pollut. 2018, 233, 690–697. [CrossRef]
8. Brant, A. Baker’s asthma. Curr. Opin. Allergy Clin. Immunol. 2007, 7, 152–155. [CrossRef]
9. Jacobs, J.H.; Meijster, T.; Meijer, E.; Suarthana, E.; Heederick, D. Wheat allergen exposure and the prevalence
of work-related sensitization and allergy in bakery workers. Allergy 2008, 63, 1597–1604. [CrossRef]
10. Suarthana, E.; Vergouwe, Y.; Moons, K.G.; de Monchy, J.; Grobbee, D.; Heederick, D.; Meijer, E. A diagnostic
model for the detection of sensitization to wheat allergens was developed and validated in bakery workers.
J. Clin. Epidemiol. 2010, 63, 1011–1019. [CrossRef]
11. Ade, S.; Adjobimey, M.; Agodokpessi, G.; Kouassi, M.S.; Gounongbe, F.A.; Cisse, I.; Hounkpatin, S.H.R.
Asthma symptoms in bakeries at parakou, benin. Pulm. Med. 2020, 2020, 376–382. [CrossRef] [PubMed]
12. Previdi, M.; Marracini, P.; Farioli, L. Allergopatie respiratorie professionali: Monitoraggio ambientale,
aeroallergeni, prevenzione. Med. Lav. 1988, 89, 481–498.
13. Patussi, V.; Portello, A.; Chermaz, E.; Sernagiotto, F.; De Noni, R.; Lorusso, A.; Collareta, A.; Valentini, F.;
Agnesi, R.; Dal Vecchio, L.; et al. Allergic disease due to wheat flour. Allergy 1995, 26, 88.
14. Geyssant, M.E.; Barthélemy, J.F.; Mouchot, L.; Paris, C.; Zmirou-Navierdoi, D. Exposure of bakery and pastry
apprentices to airborne flour dust using PM2.5 and PM10 personal samplers. BMC Public Health 2007, 7, 311.
15. Khan, S.; Khaskheli, M.H.; Nabi, G.; Deverajani, B.R.; Memon, N.; Shar, G.A. Immunological study of
different fraction of wheat proteins. Pak. J. Pharm. Sci. 2018, 31, 1437–1440.
16. Aidoo, H.; Beach, J.; Elbourne, R.; Galarneau, J.M.F.; Straube, S.; Cherry, N. Estimation and validation of flour
exposure in bakeries in Alberta, Canada. Ann. Work Expo. Health 2018, 62, 1096–1108. [CrossRef] [PubMed]
17. De Zotti, R.; Larese, F.; Bovenzi, M.; Negro, C.; Molinari, S. Allergic airway disease in Italian bakers and
pastry makers. Occup. Environ. Med. 1994, 51, 548–552. [CrossRef] [PubMed]Atmosphere 2020, 11, 415 13 of 14
18. Fishwick, D.; Curran, A.D. Variability in the diagnosis of occupational asthma and implications for clinical
practice. Curr. Opin. Allergy Clin. Immunol. 2008, 8, 140–144. [CrossRef] [PubMed]
19. Tarlo, S.M.; Malo, J.-L. An official american thoracic society proceedings: Work-related asthma and airway
diseases: Presentations and discussion from the fourth jack pepys workshop on asthma in the workplace.
Ann. Am. Thorac. Soc. 2013, 10, S17–S24. [CrossRef]
20. Previdi, M.; Farioli, L.; Marracini, P. Risultati delle indagini nei panifici milanesi. In Proceedings of the Rischi
e Strumenti Operativi per la Prevenzione nel Settore Della Panificazione, Milan, Italy, 23 November 1998;
pp. 10–15.
21. Saia, B.; Baruffini, A.; Cirla, A.M. Valutazione dell’esposizione ad allergeni professionali. Acta Med. Mediterr.
1997, 135, 234–243.
22. Cotton, D.J.; Dosman, J.A. Grain dust and health. III. Environmental factors. Ann. Intern. Med. 1978, 89,
420–421. [CrossRef] [PubMed]
23. Cotton, D.J.; Graham, B.L.; Li, K.Y.; Froh, F.; Barnett, G.D.; Dosman, J.A. Effects of grain dust exposure and
smoking on respiratory symptoms and lung function. J. Occup. Med. 1983, 25, 131–141. [PubMed]
24. Hurst, T.S.; Dosman, J.A. Characterization of health effects of grain dust exposures. Am. J. Ind. Med. 1990, 17,
27–32. [CrossRef] [PubMed]
25. Poulsen, K.B.; Nielsen, H.W. Health problems among persons exposed to grain dust (Review) [Helbredsgener
hos personer udsat for kornstøv.]. Ugeskr Laeger 1991, 153, 1986–1990.
26. Chan-yeung, M.; Dimich-ward, H.; Enarson, D.A.; Kennedy, S.M. Five cross-sectional studies of grain
elevator workers. Am. J. Epidemiol. 1992, 136, 1269–1279. [CrossRef] [PubMed]
27. Fonn, S.; Groeneveld, H.T.; deBeer, M.; Becklake, M.R. Relationship of respiratory health status to grain
dust in a Witwatersrand grain mill: Comparison of workers’ exposure assessments with industrial hygiene
survey findings. Am. J. Ind. Med. 1993, 24, 401–411. [CrossRef] [PubMed]
28. Gimenez, C.; Fouad, K.; Choudat, D.; Bouscaillou, P.; Leib, E.; Laureillard, J. Chronic and acute respiratory
effects among grain mill workers. Int. Arch. Occup. Environ. Health 1995, 67, 311–315. [CrossRef] [PubMed]
29. Massin, N.; Bohadana, A.B.; Wild, P.; Kolopp-Sarda, M.N.; Toamain, J.P. Airway responsiveness to
methacholine, respiratory symptoms, and dust exposure levels in grain and flour mill workers in eastern
france. Am. J. Ind. Med. 1995, 27, 859–869. [CrossRef]
30. Peelen, S.J.M.; Heederik, D.; Dimich-Ward, H.D.; Chan-Yeung, M.; Kennedy, S.M. Comparison of dust related
respiratory effects in Dutch and Canadian grain handling industries: A pooled analysis. Occup. Environ. Med.
1996, 53, 559–566. [CrossRef]
31. Musk, A.W.; Venables, K.M.; Crook, B.; Nunn, A.J.; Hawkins, R.; Crook, G.D.W.; Graneek, B.J.; Tee, R.D.;
Farrer, N.; Johnson, D.A.; et al. Respiratory symptoms, lung function, and sensitisation to flour in a British
bakery. Br. J. Ind. Med. 1989, 46, 636–642. [CrossRef]
32. Hauggaard-Nielsen, H.E.; Mundus, S.; Jensen, E.S. Grass-clover undersowing affects nitrogen dynamics in a
grain legume-cereal arable cropping system. Field Crop. Res. 2012, 136, 23–31. [CrossRef]
33. Buonanno, G.; Morawska, L.; Stabile, L. Particle emission factors during cooking activities. Atmos. Environ.
2009, 43, 3235–3242. [CrossRef]
34. Zhai, S.R.; Albritton, D. Airborne particles from cooking oils: Emission test and analysis on chemical and
health implications. Sustain. Cities Soc. 2020, 52. [CrossRef]
35. El-Sharkawy, M.F.; Javed, W. Study of indoor air quality level in various restaurants in Saudi Arabia.
Environ. Prog. Sustain. Energy 2018, 37, 1713–1721. [CrossRef]
36. Massey, D.; Kulshrestha, A.; Masih, J.; Taneja, A. Seasonal trends of PM10 , PM5.0 , PM2.5 & PM1.0 in indoor
and outdoor environments of residential homes located in North-Central India. Build Environ. 2012, 47,
223–231.
37. Dario, R.; Uva, J.; Trani, G.; Falco, S.; Ancona, V.; Petrera, L. Evaluation of the dustiness of a Bakery: An
integrated system with an experimental electronic device. G. Ital. Med. Lav. Ergon. 2012, 34, 744–747.
38. Salthammer, T.; Schripp, T.; Wientzek, S.; Wensing, M. Impact of operating wood-burning fireplace ovens on
indoor air quality. Chemosphere 2014, 103, 205–211. [CrossRef]
39. Daellenbach, K.R.; Stefenelli, G.; Bozzetti, C.; Vlachou, A.; Fermo, P.; Gonzalez, R.; Piazzalunga, A.;
Colombi, C.; Canonaco, F.; Hueglin, C.; et al. Long-term chemical analysis and organic aerosol
source apportionment at nine sites in central Europe: Source identification and uncertainty assessment.
Atmos. Chem. Phys. 2017, 17, 13265–13282. [CrossRef]Atmosphere 2020, 11, 415 14 of 14
40. Li, S.; Gao, J.; He, Y.; Cao, L.; Li, A.; Mo, S.; Chen, Y.; Cao, Y. Determination of time- and size-dependent
fine particle emission with varied oil heating in an experimental kitchen. J. Environ. Sci. 2017, 51, 157–164.
[CrossRef]
41. Ielpo, P.; Fermo, P.; Comite, V.; Mastroianni, D.; Viviano, G.; Salerno, F.; Tartari, G. Chemical characterization
of biomass fuel particulate deposits and ashes in households of Mt. Everest region (NEPAL). Sci. Total Environ.
2016, 573, 751–759. [CrossRef]
42. Cattaneo, A.; Fermo, P.; Urso, P.; Perrone, M.G.; Piazzalunga, A.; Tarlassi, J.; Carrer, P.; Cavallo, D.M.
Particulate-bound polycyclic aromatic hydrocarbon sources and determinants in residential homes.
Environ. Pollut. 2016, 218, 16–25. [CrossRef] [PubMed]
43. Gibbs, R.; Whitby, R.; Johnson, R. Experimental measurement of particulate emissions from a diesel operated
with particulate laden intake air. In Proceedings of the Chemical and Physical Processes in Combustion, Fall
Technical Meeting, the Eastern States Section, Philadelphia, PA, USA, 4–6 November 1985; p. 84.
44. Armstrong, B.; Hutchinson, E.; Unwin, J.; Fletcher, T. Lung cancer risk after exposure to polycyclic aromatic
hydrocarbons: A review and meta-analysis. Environ. Health Perspect. 2004, 112, 970–978. [CrossRef] [PubMed]
45. Fermo, P.; Piazzalunga, A.; Vecchi, R.; Ga, V. Set-up of extraction procedures for ions quantification in aerosol
samples. Chem. Eng. Trans. 2006, 10, 203–208.
46. Piazzalunga, A.; Bernardoni, V.; Fermo, P.; Vecchi, R. Optimisation of analytical procedures for the
quantification of ionic and carbonaceous fractions in the atmospheric aerosol and applications to ambient
samples. Anal. Bioanal. Chem. 2013, 405, 1123–1132. [CrossRef]
47. Fermo, P.; Piazzalunga, A.; Vecchi, R.; Valli, G.; Mb, C. A TGA/FT-IR study for measuring OC and EC in
aerosol samples. Atmos. Chem. Phys. 2006, 6, 255–266. [CrossRef]
48. Piazzalunga, A.; Belis, C.; Bernardoni, V.; Cazzuli, O.; Fermo, P.; Valli, G.; Vecchi, R. Estimates of wood
burning contribution to PM by the macro-tracer method using tailored emission factors. Atmos. Environ.
2011, 45, 6642–6649. [CrossRef]
49. Genga, A.; Ielpo, P.; Siciliano, M.; Siciliano, T. Carbonaceous particles and aerosol mass closure in PM2.5
collected in a port city. Atmos. Res. 2017, 183, 245–254. [CrossRef]
50. Cuccia, E.; Massabò, D.; Ariola, V.; Bove, M.C.; Fermo, P.; Piazzalunga, A.; Prati, P. Size-resolved
comprehensive characterization of airborne particulate matter. Atmos. Environ. 2013, 67, 14–26. [CrossRef]
51. American Conference of Governmental Industrial Hygienists (ACGIH). 2018. TLVs and BEIs. Available
online: https://www.acgih.org/ (accessed on 28 September 2018).
52. Luo, L.; Wu, Y.; Xiao, H.; Zhang, R.; Lin, H.; Zhang, X.; Kao, S.-J. Origins of aerosol nitrate in Beijing during
late winter through spring. Sci. Total Environ. 2019, 653, 776–782. [CrossRef]
53. Benetello, F.; Squizzato, S.; Hofer, A.; Masiol, M.; Khan, M.B.; Piazzalunga, A.; Fermo, P.; Formenton, G.M.;
Rampazzo, G.; Pavoni, B.; et al. Estimation of local and external contributions of biomass burning to PM2.5 in
an industrial zone included in a large urban settlement. Environ. Sci. Pollut. Res. 2017, 24, 2100–2115. [CrossRef]
54. Torvela, T.; Tissari, J.; Sippula, O.; Kaivosoja, T.; Leskinen, J.; Virén, A.; Lähde, A.; Jokiniemi, J. Effect of wood
combustion conditions on the morphology of freshly emitted fine particles. Atmos. Environ. 2014, 87, 65–76.
[CrossRef]
55. Shah, K.V.; Cieplik, M.K.; Betrand, C.I.; van de Kamp, W.L.; Vuthaluru, H.B. Correlating the effects of ash
elements and their association in the fuel matrix with the ash release during pulverized fuel combustion.
Fuel Process. Technol. 2010, 91, 531–545. [CrossRef]
56. Tissari, J.; Lyyränen, J.; Hytönen, K.; Sippula, O.; Tapper, U.; Frey, A.; Saarnio, K.; Pennanen, A.S.; Hillamo, R.;
Salonen, R.O.; et al. Fine particle and gaseous emissions from normal and smouldering wood combustion in
a conventional masonry heater. Atmos. Environ. 2008, 42, 7862–7873. [CrossRef]
57. Mota Lima, F.D.; Pérez-Martínez, P.J.; Andrade, M.d.F.; Kumar, P.; de Miranda, R.M. Characterization of
particles emitted by pizzerias burning wood and briquettes: A case study at Sao Paulo, Brazil. Environ. Sci.
Pollut. Res. 2020. [CrossRef]
58. Infofarine. Available online: http://www.infofarine.it/le-proprieta-nutrizionali/ (accessed on
12 December 2015).
© 2020 by the authors. Licensee MDPI, Basel, Switzerland. This article is an open access
article distributed under the terms and conditions of the Creative Commons Attribution
(CC BY) license (http://creativecommons.org/licenses/by/4.0/).You can also read