AUCKLAND 2nd edition P.R. Chappell - NIWA
←
→
Page content transcription
If your browser does not render page correctly, please read the page content below
THE CLIMATE AND WEATHER OF

AUCKLAND
2nd edition        P.R. Chappell
© All rights reserved. The copyright for this report, and for the data, maps, figures and other information
(hereafter collectively referred to as “data”) contained in it, is held by NIWA. This copyright extends to all forms
of copying and any storage of material in any kind of information retrieval system.

While NIWA uses all reasonable endeavours to ensure the accuracy of the data, NIWA does not guarantee or
make any representation or warranty (express or implied) regarding the accuracy or completeness of the data,
the use to which the data may be put or the results to be obtained from the use of the data. Accordingly, NIWA
expressly disclaims all legal liability whatsoever arising from, or connected to, the use of, reference to, reliance
on or possession of the data or the existence of errors therein. NIWA recommends that users exercise their own
skill and care with respect to their use of the data and that they obtain independent professional advice relevant
to their particular circumstances.

NIWA SCIENCE AND TECHNOLOGY SERIES
NUMBER 60

ISSN 1173-0382

Note to Second Edition
This publication replaces the first edition of New Zealand Meteorological Service Miscellaneous Publication
115 (20), written in 1988 by J.W.D. Hessell. This edition incorporates more recent data and updated methods of
climatological variable calculation.
THE CLIMATE AND WEATHER OF
AUCKLAND
2nd edition          P.R. Chappell
3
CONTENTS
SUMMARY                                       6

INTRODUCTION                                   7

TYPICAL WEATHER SITUATIONS IN AUCKLAND         9
  Strong easterlies with rain                  9
  Fine weather                                 9
  Southwesterly wind flows in winter          10
  Squally westerlies                          10

CLIMATIC ELEMENTS                             13
   Wind                                       13
   Sea breezes                                15
   Rainfall                                   16
     Rainfall frequency and intensity         19
     Recent extreme events in Auckland        20
     Periods of low rainfall                  21
   Temperature                                22
     Air and sea temperatures                 22
     Air temperature                          23
     Earth Temperatures                       25
     Frosts                                   26
   Sunshine and Solar Radiation               27
     Sunshine                                 27
     Solar radiation                          28
     UV (Ultra-violet radiation)              28
   Fog                                        29
   Severe convective storms                   30
     Thunderstorms                            30
     Hail                                     30
     Tornadoes                                30
   Sea swell and waves                        30

DERIVED CLIMATOLOGICAL PARAMETERS             33
  Vapour pressure and relative humidity       33
  Evapotranspiration and soil water balance   34
  Degree-day totals                           36

ACKNOWLEDGEMENTS                              38

REFERENCES                                    38

                                                   4
SUMMARY
    Auckland experiences a subtropical climate. The
    region lies some 13° of latitude south of the Tropic
    of Capricorn, so tropical plants which are protected
    for the winter months will flower and fruit in the
    summer, and cold climate vegetables planted in
    autumn will mature in early spring – providing the
    ground is well-drained. Almost any plant can be grown
    in Auckland providing the location is optimised with
    regard to radiation, shelter, drainage, and irrigation.
    Summers tend to be warm and humid, while winters
    are relatively mild, and many parts of the region only
    receive a few frosts each year. Rainfall is typically
    plentiful all year round, with sporadic very heavy falls.
    Dry spells may occur during the summer months, but
    they are usually not long-lived. Most parts of Auckland
    receive around 2000 hours of bright sunshine per year.
    Sometimes Auckland experiences extreme events that
    cause flooding and wind damage, but generally these
    events are not as severe as in other regions.

7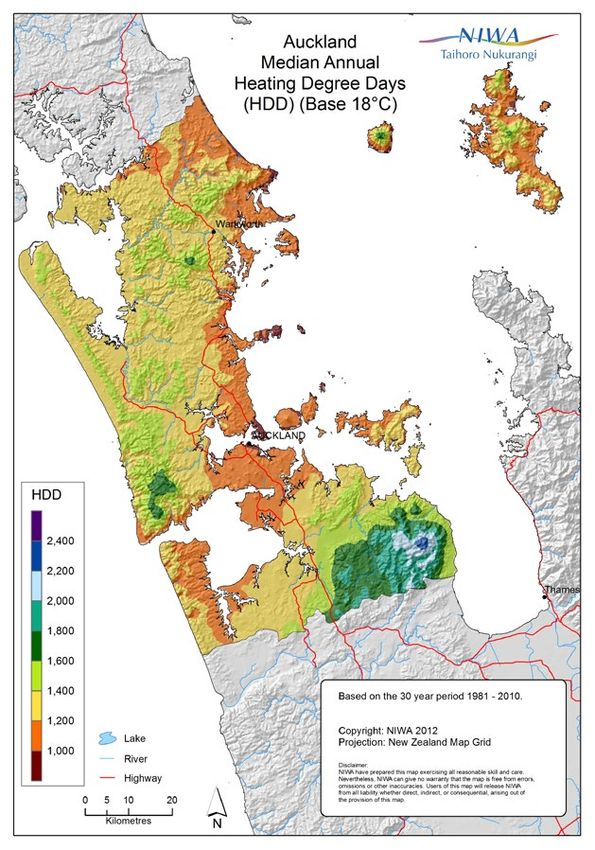
INTRODUCTION
The mean high pressure belt in the
New Zealand sector of the Southern
Hemisphere is centred near 30° S so
that westerly winds predominate over
the country. On a day to day basis,
however, there is great variability in the
pressure distribution, and sometimes
intense anticyclones occur to the south
of the country with depressions to the
north, causing an easterly flow with the
reversal of the usual weather pattern.
These blocking situations may be rather
persistent and interrupt the more
common westerlies associated with the
eastward progression of weather systems.
The Auckland region, lying in the northern
part of the country, and north of the main
mountain chains and the volcanic plateau,
is less vulnerable to outbreaks of Antarctic
air than most of the country. However, it is
one of the first areas to encounter storms
of tropical origin. Auckland’s rain occurs
mainly with northerly winds. The region is
relatively warm and the higher absolute
humidities give the climate a different
character to that of the southern and
Figure 1. The Auckland region, showing places mentioned in the tables,
eastern regions. figures, and text.
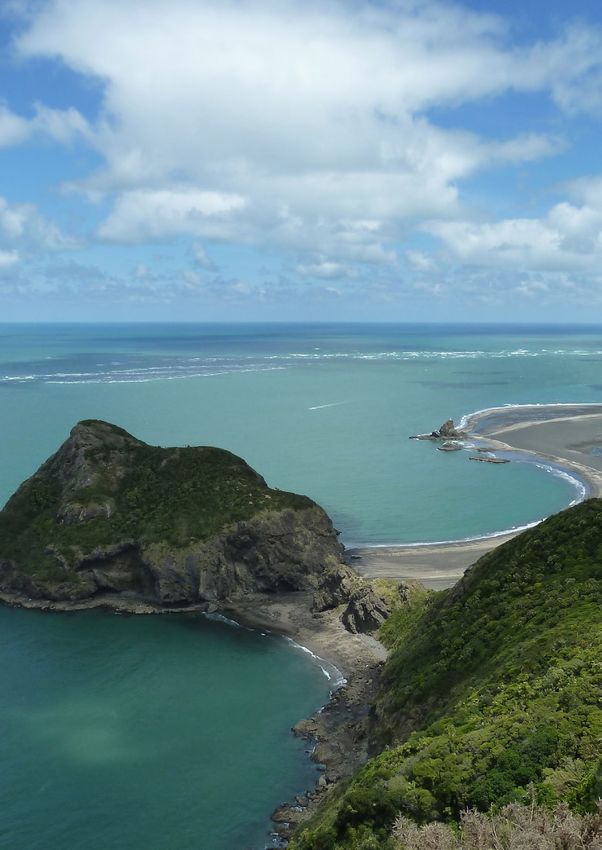
The Auckland region (i.e. the area
administered by the Auckland Council)
has an indented coastline including three coast of the region is exposed to ocean swells emanating from
major harbours (Kaipara, Waitemata, the Tasman Sea and the Southern Ocean, which may be further
and Manukau). The Auckland isthmus disturbed by the prevailing southwest winds. These black sand
is less than 2 km wide at its narrowest coasts present a startling contrast to those of the east. Figure 1
point. There are two dissected plateaux provides geographic context for the Auckland region, and shows
rising to 480 m and 690 m (Waitakere all locations mentioned in the text and following tables.
and Hunua Ranges1, respectively) and
All numbers given in the following tables are calculated using
numerous islands – the largest being
data from the 1981-2010 normal period (a normal is an average
Great Barrier Island (285 km2). Great
or estimated average over a standard 30 year period), unless
Barrier, along with islands in the inner
otherwise stated.
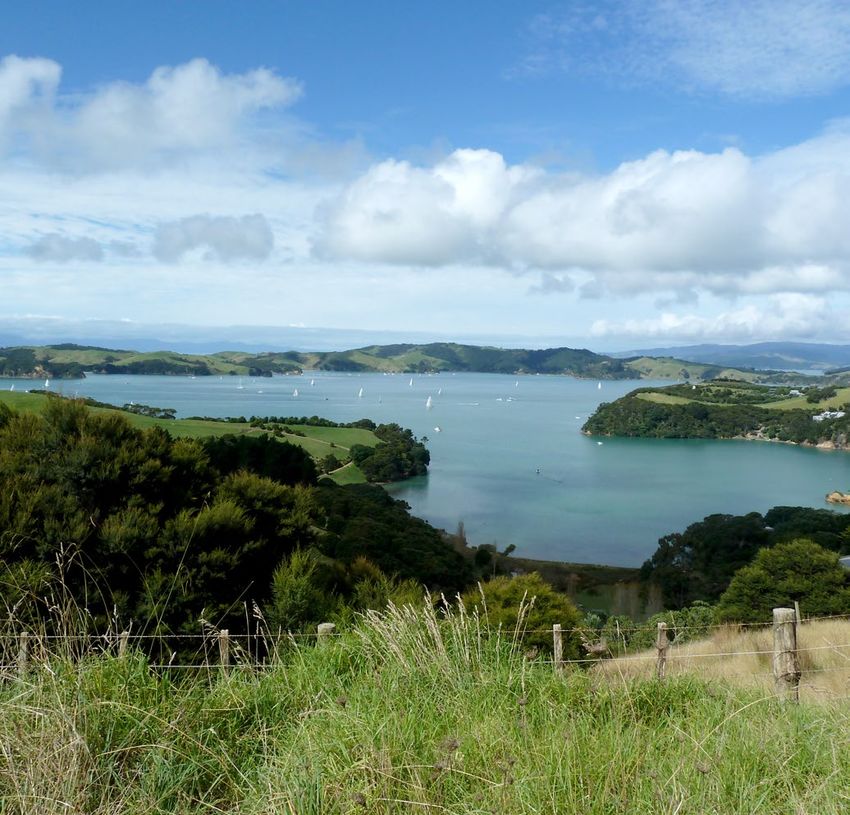
Hauraki Gulf (e.g. Waiheke Island), as
well as the Coromandel Peninsula (which
is not in the Auckland region), shelter
the waters of the eastern seaboard. The
Hauraki Gulf is consequently a popular
area for maritime activities. The west
1
As of 2010, the Hunua Ranges are outside the jurisdiction of Auckland Council (now
part of Waikato Region), but have been included in this publication.
7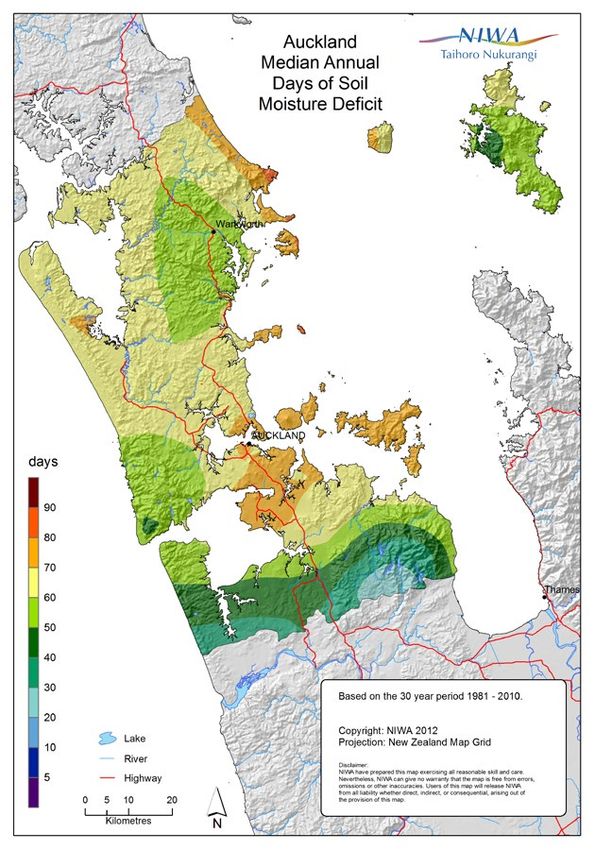
8
TYPICAL WEATHER
SITUATIONS IN
AUCKLAND
Strong easterlies with rain
Auckland’s heaviest rainfalls occur when
there is a depression to the north or
northwest with a strong north to northeast
wind flow over the city, and a front
embedded in the flow. Such a situation
occurred on July 15, 1987 (Figure 2). The
usual pattern of anticyclones to the north
of the country and depressions to the far      Figure 2. Strong easterlies with rain in Auckland.
south is reversed on this occasion. An
intense anticyclone is centred southeast
of the South Island, and a deep, complex
depression lies to the north of the country,
with a strong north-easterly flow lying
between the two pressure systems. These
are prevented from moving rapidly by
another anticyclone to the east, acting
as a block. The frontal zone demarks the
boundary between air arriving from the
Cook Islands region and that arriving from
the south Tasman Sea. Surface winds over
Auckland reached 50-60 km/hr with winds
of 80 km/hr at 1000 m altitude. Very heavy
rain was recorded on the Coromandel
Peninsula (up to 200 mm) and rainfall over
Auckland during the episode totalled 43        Figure 3. Fine weather in Auckland.
mm. Flooding occurred in South Auckland
about the Hunua Ranges and there was
also some wind damage.

Fine weather
Auckland’s sunniest days occur during
anticyclonic conditions in a light
southeasterly flow, as on 31 January
1985 (Figure 3). Due to minor causes
(e.g. sea breeze convergence zones or
an anticyclonic subsidence inversion)
local variations in wind direction and
cloud cover may occur, but fine weather
predominates. On the day of this example,
over twelve hours of sunshine were
recorded in Auckland city.
                                               Figure 4. Southwesterly wind flows in Auckland.

                                                                                                    9
Southwesterly wind flows in winter
     Due to the tendency for anticyclones to
     form over Australia in winter, and for
     a major trough of low pressure to lie
     to the east of New Zealand, southwest
     airstreams are relatively common in
     the cooler half of the year. They are
     particularly persistent during periods when
     the Southern Oscillation Index is low (El
     Niño conditions). Southwesterlies produce
     cloudy, showery weather in Auckland,
     especially in winter when comparatively
     warm seas tend to destabilise the flow.
     Showers are more frequent in the hilly
                                                     Figure 5. Squally westerlies in Auckland.
     areas of the Waitakere and Hunua Ranges.
     The southwest flow is seldom undisturbed,
     and decaying cold fronts embedded in
     the flow frequently cause increases in the
     shower activity as they pass. Sometimes
     this is followed by a brief fine spell, but
     the cloudy, showery conditions quickly
     become re-established. Southwesterlies
     in summer are frequently fine, as the
     lower layers are not destabilised by
     comparatively warmer seas as they are in
     winter. Figure 4 is the synoptic analysis for
     a typical southwest day.

     Squally westerlies
                                                     Figure 6a. Tropical cyclones which made landfall in New Zealand during
     Auckland is vulnerable to strong gusty          December, 1970-2010. Source: Southwest Pacific Enhanced Archive of
     westerlies which may be accompanied             Tropical Cyclones (SPEArTC; Diamond et al., 2012).
     by thunderstorms, and rarely tornadoes.
     These conditions are most likely to occur
     in winter and spring. Such a situation is
     represented by Figure 5. Typical of these
     situations are strongly cyclonically-curved
     isobars with a strong wind flow rapidly
     decreasing towards the depression centre.
     Also typical are features in the upper
     atmosphere such as jet streams just to
     the north, and a column of very cold air
     to high levels. On this day thunderstorms
     were present over the Auckland, Taranaki,
     Waikato, and Bay of Plenty regions,
     and Auckland city experienced several
     tornadoes which damaged buildings and
                                                     Figure 6b. Tropical cyclones which made landfall in New Zealand during
     brought down power lines.                       January, 1970-2010. Source: SPEArTC (Diamond et al., 2012).

10
Tropical cyclones that reach Auckland
and still retain very low pressures and
hurricane force winds are very rare.
However, other storms of tropical
origin (which may never have been
fully developed tropical cyclones) affect
Auckland about once or twice each year,
mainly between the months of December
and April. They usually bring heavy rain
and strong easterly winds.
Figure 6 shows, by months, the tracks of
tropical cyclones which made landfall in
New Zealand during the period between
Figure 6c. Tropical cyclones which made landfall in New Zealand during
1970 and 2010. February, 1970-2010. Source: SPEArTC (Diamond et al., 2012).
Figure 6d. Tropical cyclones which made landfall in New Zealand during
March, 1970-2010. Source: SPEArTC (Diamond et al., 2012).
Figure 6e. Tropical cyclones which made landfall in New Zealand during April,
1970-2010. Source: SPEArTC (Diamond et al., 2012).
1112
CLIMATIC ELEMENTS
Wind
The airflow over Auckland is predominantly                             Leigh 2                            Whenuapai Airport

from the southwest. This is particularly so
in winter and spring, but in summer the
proportion of winds from the northeast
increases. This arises from the changing
location of the high pressure belt, which is
further south in summer and early autumn
than it is in winter and spring. In addition,
sea breezes add to the proportion of
easterlies in eastern areas in summer and
early autumn. Figure 6 shows mean annual                            Manukau Heads                          Auckland Airport
wind frequencies of surface wind based on
hourly observations from selected stations.

Mean wind speed data (average wind
speeds are taken over the 10 minute
period preceding each hour) are available
for several sites in Auckland, and these
illustrate the several different wind regimes
of the region. Coastal areas (e.g. Auckland
Airport) tend to be windier throughout
the year compared with sheltered inland
                                                                    Pukekohe EWS
areas (e.g. Pukekohe). Table 1 gives mean
monthly and annual wind speeds for
selected stations in Auckland.

                                                           Figure 7. Mean annual wind frequencies (%) of surface wind directions
                                                           from hourly observations at selected Auckland stations. The plots
                                                           show the directions from which the wind blows, e.g. the dominant wind
                                                           direction at Auckland Airport is from the southwest.

    Table 1. Mean monthly/annual wind speeds (km/hr) for Auckland sites.
     Location                  Jan    Feb    Mar     Apr      May       Jun      Jul   Aug   Sep    Oct    Nov     Dec        Ann
     Warkworth EWS              14     13     13      12       14       14       15    14    16     17      16      16        14
     Whenuapai Airport          14     13     13      12       12        12      12    14    15     16      16      14        14
     North Shore ARC            10     10      9      8         9        9         9    9    10     12      12      11        10
     Onehunga ARC               12     12     11      9        10        10      10    11    12     14      14      13        12
     Auckland Airport           18     17     16      15       16        16      16    17    19     21      21      19        18
     Pukekohe EWS               9       8      8      8         8        8         8    9     9     10      10       9         9

                                                                                                                                    13
Spring is generally the windiest season Table 2. Seasonal percentages of strong winds or calms (%) in Auckland.
throughout the region. Summer and Location Summer Autumn Winter Spring
autumn are the seasons when the Strong 22 15 24 40
Warkworth
greatest numbers of light wind days are Light 25 26 25 23
recorded. Table 2 gives the seasonal Strong 16 15 23 45
Whenuapai Airport
proportion of strong and light winds as Light 25 25 25 24
a percentage of the annual total. For Strong 10 11 30 49
North Shore ARC
example, of all strong winds recorded Light 25 25 25 25
at Auckland Airport, 21% occurred in Strong 21 5 37 37
Onehunga ARC
summer, 19% in autumn, 23% in winter Light 25 25 25 25
and 36% in spring. In compiling this table Strong 21 19 23 36
Auckland Airport
a strong wind was defined as having a Light 25 26 25 24
mean wind speed of at least 31 km/hr. Strong 40 0 40 20
Pukekohe EWS
Light 25 25 25 25
Table 3. Average wind speed (km/hr) for selected hours in Auckland. Diurnal variation in wind speed is well-
Location 00 03 06 09 12 15 18 21 marked, with greatest wind speeds
Warkworth 11 11 11 13 19 20 17 13 occurring in the early part of the afternoon.
Whenuapai This is because at that time of day heating
9 9 9 13 20 21 17 11
Airport
of the land surface is most intense and
North Shore ARC 7 7 7 9 13 15 12 9
stronger winds aloft are brought down to
Onehunga ARC 9 9 8 10 15 16 15 11
ground level by turbulent mixing. Cooling
Auckland Airport 15 14 14 16 20 23 22 17
at night generally restores a lighter wind
Pukekohe EWS 6 6 6 8 12 13 11 7
regime. Table 3 gives average wind speeds
at three-hourly intervals for selected
stations.
Table 4. Average number of days per year with gusts exceeding 63 km/hr
and 96 km/hr, and gale force winds. Winds can be strong and gusty at times,
Gusts Gusts especially in exposed coastal areas.
Location Days of gale
>63 km/hr >96 km/hr
Warkworth has the highest frequency of
Warkworth 90 7 3
gusts per year that are greater than 63 km/
Whenuapai Airport 48 1 1
hr and 96 km/hr. Warkworth and Auckland
Auckland Airport 55 3 3
Airport show the same average number
of days per year where gale force winds
Table 5. Highest recorded gusts at selected Auckland stations, from all (10-minute average wind speeds in excess
available data. of 63 km/hr) are recorded, shown in Table 4.
Location Gust (km/hr) Direction (°) Date In comparison, Whenuapai Airport is more
Leigh 2 150 200 14/06/1975 sheltered.
Warkworth 131 050 22/05/1975
Although gale force winds can occur in
Whenuapai Airport 115 310 19/07/1978
any month, they are most frequent in
North Shore ARC 95 240 08/10/2005
winter. The highest gust recorded in the
Musick Point wind 148 - 02/08/1982
region was 204 km/hr at Manukau Heads
Onehunga ARC 96 284 28/05/2002
(an exposed site on the west coast) on 21
Auckland Airport 147 102 06/09/1981
February 1992. Maximum gusts recorded at
Manukau Heads 204 270 21/02/1992
different stations in the region are listed in
Pukekohe EWS 102 110 26/07/2008
Table 5.
14Sea breezes
Sea breezes are local onshore daytime
winds generated on fine days by the sun
warming the land surface more than
the sea surface. In Auckland they occur
most frequently between November and
March when the sunshine is greatest
and the wind flows are weakest. Sea
breezes occur on approximately 20% of
days during the summer months (McGill,
1987). Between 8 am and 10 am, breezes
are initiated from the harbours in the
region (Waitemata, Manukau, Kaipara) and
along Auckland’s east coast, and in the band of cloud that occasionally contains scattered showers, that
late morning these ‘elementary’ breezes sits parallel to the coast over the Auckland isthmus. The direction
are augmented by ‘mature’ breezes from of the large-scale, or synoptic, wind controls the position of
the main water bodies surrounding the the Sea Breeze Convergence Zone. If the synoptic wind about
region (Tasman Sea and outer Hauraki Auckland is from between northwest and southwest, the zone
Gulf) (Figure 7). The breezes have speeds will move towards and sometimes into the Hauraki Gulf. This
of less than 20 km/hr, and tend to weaken allows the west coast sea breeze, blowing from the southwest, to
around 4 pm, and cease between 5pm cover the isthmus. Should the synoptic wind be between north-
and 10pm (McGill, 1987). The two breezes northwest and east, the east coast sea breeze, blowing from
contribute towards the development of the the northeast, will move over the isthmus as the zone moves
sea breeze convergence zone, which is a towards, or into, the Tasman Sea.
A B
Figure 8. Typical sea breeze convergence zone; a) bay breezes from harbours at 11 am, b) mature breezes from
oceans with sea breeze convergence zone at 2 pm.
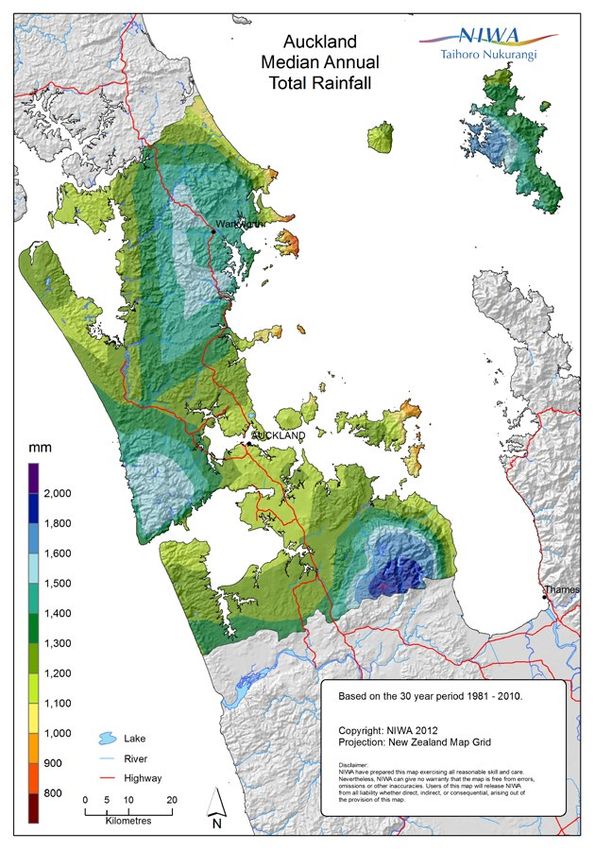
15Rainfall
The distribution of the Auckland region’s
median annual rainfall is shown in Figure
8. Rainfall totals in the Hunua Ranges
are about 50% higher than in lower-lying
parts of Auckland. The Waitakere Ranges,
Great Barrier Island, and the area around
Warkworth also have higher rainfall totals
than the urban Auckland and the east
coast. Eastern areas such as Leigh and
parts of Waiheke Island record on average
about 900 mm of rain per year.
Seasonal influences on rainfall
distribution are also quite well defined.
Table 6 lists monthly rainfall normals and
percentage of annual total for selected
stations. This table shows a clearly
defined winter rainfall maximum. Monthly
percentages of the annual rainfall total
are fairly consistent across the Auckland
region, with around 32% of annual rainfall
expected in the winter months from June
to August, and around 20% of rain in
the summer months from December to
February.
Figure 9. Median annual total rainfall for Auckland region.
Table 6. Monthly/annual rainfall normals (a; mm); percentage of annual total for each month (b; %).
Location Jan Feb Mar Apr May Jun Jul Aug Sep Oct Nov Dec Ann
a 73 70 98 82 105 117 130 120 95 83 69 76 1117
Leigh 2
b 7 6 9 7 9 10 12 11 8 7 6 7
a 86 88 109 107 134 155 180 152 131 108 92 113 1454
Warkworth Ews
b 6 6 7 7 9 11 12 10 9 7 6 8
a 85 73 102 91 87 107 142 140 109 96 95 105 1231
Whenuapai Airport
b 7 6 8 7 7 9 12 11 9 8 8 9
a 84 61 96 92 91 106 114 127 100 86 91 89 1137
Auckland, Albert Park
b 7 5 8 8 8 9 10 11 9 8 8 8
a 74 66 91 102 109 124 147 116 103 101 90 93 1213
Auckland, Owairaka
b 6 5 7 8 9 10 12 10 8 8 7 8
a 82 64 94 103 98 113 138 129 108 95 100 90 1212
Auckland, Pakuranga
b 7 5 8 9 8 9 11 11 9 8 8 7
a 66 71 75 85 110 108 133 111 91 94 72 87 1101
Auckland Airport
b 6 6 7 8 10 10 12 10 8 9 7 8
16Table 6 continued.
Location Jan Feb Mar Apr May Jun Jul Aug Sep Oct Nov Dec Ann
a 68 77 90 88 92 116 131 104 102 76 92 89 1124
Manukau Heads 2
b 6 7 8 8 8 10 12 9 9 7 8 8
a 73 64 76 86 122 141 151 144 111 120 98 98 1283
Pukekohe Ews
b 6 5 6 7 10 11 12 11 9 9 8 8
Waiheke Island, Awaroa a 76 75 88 102 114 132 154 137 107 97 81 104 1266
Valley b 6 6 7 8 9 10 12 11 8 8 6 8
Port Fitzroy, Great a 112 128 142 134 145 180 223 186 140 115 120 115 1740
Barrier b 6 7 8 8 8 10 13 11 8 7 7 7
The distribution of monthly rainfall is shown in
Figure 9. The 10th percentile, 90th percentile, and
mean rainfall values for each month are shown along
with maximum and minimum recorded values for
several stations.
Leigh 2 Albany Henderson River Park
500
500
500
400
400
400
Rainfall (mm)
Rainfall (mm)
Rainfall (mm)
300
300
300
200
200
200
100
100
100
0
0
0
J F M A MJ J A S O ND J F M A MJ J A S O ND J F M A MJ J A S O ND
Auckland Airport Pukekohe EWS
500
500
Highest Monthly Total
400
400
90 Percentile Value
Rainfall (mm)
Rainfall (mm)
300
300
200
200
Mean
100
100
10 Percentile Value
0
0
J F M A MJ J A S O ND J F M A MJ J A S O ND Lowest Monthly Total
Figure 10. Monthly variation in rainfall for selected Auckland stations.
17Rainfall variability over longer periods is indicated by month stated. For example, using the table for Leigh,
rainfall deciles, as given in Table 7. The 10th percentile for three months it can be seen that in the three month
values show the accumulated rainfalls that will period beginning in April, 181 mm or more of rainfall
normally be exceeded in nine out of ten years, while the can be expected in nine years in ten, while a total of
90th percentile values indicate the accumulated falls 443 mm or more should occur in only one year in ten.
that will normally be exceeded in only one year in ten.
The table includes periods from one month to twelve
months; each period over one month begins with the
Table 7. Rainfall deciles for consecutive months
Jan Feb Mar Apr May Jun Jul Aug Sep Oct Nov Dec
Leigh 2
1 month
10th 23 14 19 24 27 64 56 49 54 39 27 20
90th 128 142 181 161 239 208 210 189 164 146 117 181
3 months
10th 141 126 170 181 200 249 228 203 179 134 101 102
90th 390 429 514 443 484 496 446 439 345 329 363 373
6 months
10th 382 407 478 482 486 470 420 404 305 293 320 335
90th 726 870 922 838 795 765 737 698 636 662 598 666
12 months
10th 906 901 861 898 839 827 817 852 797 818 832 884
90th 1441 1519 1474 1417 1376 1339 1350 1418 1395 1421 1372 1354
Auckland Airport
1 month
10th 15 8 20 39 49 67 67 50 49 50 28 28
90th 115 140 155 157 193 159 210 187 167 155 119 146
3 months
10th 92 145 203 200 250 245 209 213 175 176 124 131
90th 383 336 381 399 471 483 472 373 347 329 396 428
6 months
10th 397 462 491 488 493 470 482 388 314 290 313 355
90th 720 758 813 791 782 772 713 686 651 656 632 689
12 months
10th 902 890 850 797 812 877 895 880 862 847 882 867
90th 1304 1324 1315 1280 1281 1289 1286 1289 1315 1300 1298 1275
Pukekohe EWS
1 month
10th 13 8 22 28 69 96 66 55 59 47 41 37
90th 149 151 170 150 182 221 241 216 219 177 164 183
3 months
10th 111 160 197 225 282 262 225 239 208 208 181 148
90th 313 359 401 453 551 597 531 468 466 470 387 360
6 months
10th 423 450 456 472 491 477 486 426 421 359 349 400
90th 783 917 995 939 943 927 854 751 771 620 665 642
12 months
10th 896 972 952 903 907 960 937 964 947 940 1001 990
90th 1650 1648 1597 1563 1536 1466 1605 1629 1657 1557 1505 1545
18Rainfall frequency and intensity
The average number of days each year on which 0.1
mm or more of rain is recorded varies from around
180 days in coastal areas of the region (e.g. Leigh) to
over 210 days in inland areas (e.g. Warkworth). Table
8 lists the average number of days per month with
0.1 mm and 1 mm of rain for selected stations. The
0.1 mm rain days and 1 mm wet days show the same
geographic variability.
Table 8. Average monthly rain days and wet days for Auckland region; a: 0.1 mm rain day, b: 1 mm wet day.
Location Jan Feb Mar Apr May Jun Jul Aug Sep Oct Nov Dec Ann
a 11 11 12 13 17 17 19 20 18 15 13 12 179
Leigh 2
b 8 7 8 8 11 13 13 14 12 11 9 8 121
a 13 13 15 16 19 21 22 23 21 19 17 14 214
Warkworth
b 9 8 9 11 12 15 16 16 16 13 12 9 146
a 11 10 11 13 17 19 20 19 17 16 14 13 180
Auckland Albany
b 8 7 8 10 12 15 15 15 13 12 10 9 133
a 12 10 14 14 17 20 20 21 19 17 14 13 191
Whenuapai Airport
b 8 7 9 9 11 15 16 15 14 12 9 9 135
Auckland Henderson a 12 12 13 16 20 22 22 23 20 19 16 15 209
River Park b 9 7 8 11 14 16 17 17 14 13 11 10 146
a 12 10 12 15 18 21 22 21 19 16 15 13 194
Auckland Owairaka
b 8 7 8 11 12 15 16 15 13 12 10 9 136
a 11 10 12 14 18 19 20 20 17 16 14 13 183
Auckland Airport
b 7 7 8 9 13 14 15 14 12 12 9 9 129
a 11 11 12 13 18 19 20 21 18 18 15 14 191
Pukekohe EWS
b 8 8 8 10 13 15 16 16 13 13 11 10 141
a 9 8 10 12 15 17 16 17 15 14 12 11 156
Waiheke Awaroa Valley
b 7 7 8 10 12 14 14 15 12 11 10 10 130
a 12 13 14 16 19 20 21 20 17 15 15 12 195
Great Barrier RNZN
b 8 7 9 11 12 14 15 14 11 10 9 8 128
Heavy rainfalls can occur with the passage of stations, from all available data. Also listed in this
depressions of tropical origin over or close to table are the maximum rainfalls expected in 2, 5, 10,
Auckland, and with northeasterly flows between 20, and 50 years. Depth-duration frequency tables for
ridges of high pressure to the east and troughs over Auckland locations are available from NIWA’s High
the Tasman Sea. Intense rainfalls also occur with Intensity Rainfall Design System (HIRDS). HIRDS uses
thunderstorms. In Table 9, maximum short period the index-frequency method to calculate rainfall return
rainfalls for periods of 10 minutes to 72 hours with periods. For more information on methods and to use
calculated return periods are given for several the tool, see www.hirds.niwa.co.nz.
19Table 9. Maximum recorded short period rainfalls and calculated return periods from HIRDS.
Location 10min 20min 30min 1hr 2hrs 6hrs 12hrs 24hrs 48hrs 72hrs
Warkworth a 15 23 26 39 59 109 178 201 263 264
b 7 9 7 9 16 26 56 22 48 25
c 11 16 20 27 37 60 82 111 130 142
d 14 20 24 34 47 76 104 142 166 182
e 17 23 28 40 54 89 122 167 195 215
f 19 27 33 33 63 104 142 195 229 251
g 23 32 39 39 76 126 173 239 280 307
Whenuapai Airport a 17 28 36 58 104 176 176 260 297 298
b 20 35 39 60 100+ 100+ 55 100+ 91 61
c 11 16 20 29 38 57 74 95 112 124
d 13 19 24 36 47 72 95 125 147 161
e 15 22 28 41 55 85 112 149 175 193
f 17 25 32 47 63 99 132 176 207 228
g 20 30 38 56 76 121 163 219 258 284
Auckland Airport a 14 27 38 53 61 127 153 168.4 181 181
b 9 47 95 90 43 100+ 100+ 48 40 29
c 10 14 17 25 31 46 59 75 84 90
d 12 18 21 30 39 58 75 97 110 118
e 14 20 25 35 45 69 89 116 131 140
f 16 23 28 40 52 80 105 137 154 166
g 19 27 34 48 63 98 129 170 192 206
Pukekohe MAF a 18 20 27 32 57 142 161 167 172 172
b 41 13 25 10 40 100+ 100+ 38 23 17
c 10 13 16 23 30 46 61 80 94 102
d 12 17 20 28 37 59 78 104 121 132
e 14 19 23 32 43 68 92 123 143 157
f 16 22 27 37 50 80 107 144 168 184
g 19 26 26 44 60 97 131 178 208 227
a: highest fall recorded (mm)
b: calculated return period of a (years)
c: max fall calculated with ARI 2 years (mm)
d: max fall calculated with ARI 5 years (mm)
e: max fall calculated with ARI 10 years (mm)
f: max fall calculated with ARI 20 years (mm)
g: max fall calculated with ARI 50 years (mm)
Recent extreme events in Auckland
Auckland has experienced numerous extreme weather
events, with significant damage and disruption caused
by flooding and high winds (e.g. Figure 10). The events
listed below are some of the most severe events to
have affected Auckland between 1980 and 2012.
17 July 1988: Torrential rain caused flooding in west
Auckland, and a Civil Defence Emergency was declared
(the first CDE in west Auckland for 15 years). Thirty-
two people were evacuated from their homes. State
Highway 16 was closed by flooding, and the railway
from Auckland to Whangarei was closed due to slips.
A teenage boy was presumed drowned after being
swept away in Waiwera Estuary (north Auckland).
2021-22 January 1999: Heavy rain caused
severe flooding in Pukekohe. The town
received three times its normal January
rainfall in just two hours on the 21st, an
event with a return period of well over
150 years. Many homes were flooded and
crops were destroyed. The floodwaters
were 1 m deep in places. An elderly man
drowned in a field after escaping from
his car which was pinned to a fence by
floodwaters. For six weeks after the flood,
residents had to boil their water because
of giardia contamination fears.
Figure 11. Southbound lanes on Auckland’s northern motorway are
11-16 June 2006: High winds and rain submerged during a storm that coincided with high tide in January 2011.
Source: NZTA
battered Auckland, causing 700,000 people
to be without power for a number of hours.
Phone lines and cellphone networks were
also affected, and the outage of more Periods of low rainfall
than 300 sets of traffic lights in central Periods of fifteen days or longer with less than 1 mm of rain on
Auckland caused gridlock. The power any day are referred to as “dry spells”. Dry spells are common
cut also stopped and delayed trains, and in Auckland during the summer and early autumn. There is
hospitals cancelled all surgery. usually one, and frequently two, such periods each year between
December and March. The average duration of a dry spell is
9-11 July 2007: Torrential rain and
about 20 days. The longest recent dry spell between three sites
hurricane-force winds hit Auckland during
in Auckland (Leigh, Auckland Airport, and Pukekohe) was 34 days
the height of this storm. 90,000 homes
recorded in Pukekohe, from 22 January 1999 to 24 February 1999.
in the region were without power on the
During this dry spell, nine consecutive days were without any rain.
night of the 10th. Trains and ferries were
Other long dry spells include 32 days at Leigh from 3 January
cancelled or delayed, resulting in some
1988 to 3 February 1988, of which 15 consecutive days were
commuters being unable to return home
without any rain, and the same dates at Auckland Airport, but at
on the 10th. Two people were blown off
that site 16 consecutive days were without any rain.
their motorbikes on the Harbour Bridge,
and the median lane barrier was moved
out of alignment by the wind.
26-27 July and 29 July – 1 August 2008:
Two large storms occurred within days
of each other. On 26 July, about 60,000
customers were without power due to high
winds bringing down power lines. More
than 35 boats in the region broke free
from their moorings. The second storm
caused numerous slips, closing roads and
damaging properties. The Muriwai Surf
Lifesaving Club’s patrol tower had to be
moved further back from the shoreline
after the storms scoured the sand dunes
and left part of the tower hanging over a
drop of 10 m to the beach.
21Temperature
Air and sea temperatures
Auckland enjoys a mild climate with few 25 Land temperature East coast SST West coast SST
extremes of temperature. Although this
20
is partly due to the relatively low latitudes
Temperature (°C)
and elevations in the region, the extensive 15
surrounding ocean also has a modifying
effect on temperature in the region. 10
Monthly mean sea surface temperature 5
for the east and west coasts of the
Auckland region is compared with mean 0
Jan Feb Mar Apr May Jun Jul Aug Sep Oct Nov Dec
monthly air temperature for Auckland
Month
Airport in Figure 11. There is a six to eight
week lag between the minima of land Figure 12. Mean monthly land temperatures (Auckland Airport) and sea
and sea temperatures. Figure 12 shows surface temperatures (east coast and west coast).
the mean sea surface temperatures for
the New Zealand region for February
and August, which are the warmest
and coolest months with respect to sea
temperatures.
MEAN FEBRUARY SST (°C) MEAN AUGUST SST (°C)
Figure 13. Monthly mean sea surface temperatures (°C) for: a) February; b) August, based on the years 1993-2002. Source: NIWA
SST Archive, Uddstrom and Oien (1999).
22Air temperature
Most of the Auckland region experiences
mean annual temperatures between
14 °C and 16 °C, with eastern areas
generally warmer than western areas.
Lower mean annual temperatures are
experienced over higher elevations (e.g.
Hunua Ranges; 12°C) due to the decrease
of temperature with altitude. There is
a deal of variability about this figure
with high ground being relatively colder
under windy conditions, while on cold
nights hill tops may be warmer than low
ground because of cold air drainage. The
areal variation of annual median average
temperature is shown in Figure 13.
Highest Recorded
Mean Monthly Maximum
Mean Daily Maximum
Mean
Mean Daily Minimum
Mean Monthly Minimum Figure 14. Median annual average temperature for Auckland region.
Lowest Recorded
Leigh 2 Henderson River Park
20 30
30
Temperature (0C)
Temperature (0C)
20
10
0 10
0
J F M A M J J A S O N D J F M A M J J A S O N D
Auckland Airport Ardmore Aero
30
20 30
Temperature (0C)
Temperature (0C)
20
10
10
0
0
J F M A M J J A S O N D J F M A M J J A S O N D
Figure 15. Monthly variation in air temperatures for selected Auckland stations.
23Figure 14 gives the monthly temperature regime Compatible with the proximity to the sea and
(highest recorded, mean monthly maximum, mean vulnerability to sea breezes, no great extreme maxima
daily maximum, mean, mean daily minimum, mean have been recorded. The highest temperature recorded
monthly minimum and lowest recorded) for selected in Auckland is 34.0°C at Lincoln Road, west Auckland,
sites in Auckland. Coastal sites (Leigh and Auckland on 12 February 2009, and the lowest recorded is -5.7°C
Airport) show a smaller temperature range when at Riverhead Forest in June 1936. These compare with
compared to sites further inland (Henderson and national extremes of 42.4°C and -25.6°C.
Ardmore Airport). All sites show a winter minimum
and summer maximum temperature pattern.
Table 10. Average daily temperature range (Tmax–Tmin,°C).
Location Jan Feb Mar Apr May Jun Jul Aug Sep Oct Nov Dec
Leigh 2 6 5.8 5.8 5.5 5.2 5.1 5.1 5.3 5.5 5.7 6 6
Whenuapai Aws 9.3 9.6 9.6 9.1 8.7 8.5 8.8 8.2 8.2 8.1 8.3 8.8
Auckland, Owairaka 8.1 7.8 8.1 8.1 7.4 7.5 7.7 7.5 7.6 7.4 7.6 7.6
Auckland, Henderson, 11.2 11.2 11.2 10.7 9.7 9.6 9.9 10 10.2 9.9 10.1 10.4
River Pk
Auckland Aero 7.6 7.6 7.7 7.3 6.8 6.8 6.8 6.7 6.7 6.5 6.7 6.9
Pukekohe Ews 9.3 9.2 9.1 8.7 7.7 7.5 7.6 7.6 7.9 7.8 8.3 8.5
Many stations have not recorded any temperatures
below freezing point. In particular, sites on high ground
and near the coast (e.g. Leigh, Auckland Airport)
almost never record temperatures as low as freezing
point.
Table 11. Mean hourly temperatures at Auckland Airport in January and July.
hrs 00 01 02 03 04 05 06 07 08 09 10 11
January 17.9 17.7 17.4 17.2 17.1 16.9 17.0 18.1 19.2 20.2 21.0 21.6
July 9.8 9.7 9.6 9.4 9.3 9.2 9.1 9.1 9.3 10.1 11.3 12.2
hrs 12 13 14 15 16 17 18 19 20 21 22 23
January 22.1 22.4 22.5 22.5 22.2 21.5 21.0 20.2 19.2 18.8 18.6 18.2
July 12.8 13.3 13.5 13.4 13.2 12.5 11.6 11.3 10.9 10.5 10.3 10.0
The annual mean daily temperature 25 January July
range for Auckland is small, averaging
Mean hourly temperature (°C)
20
7.9°C. Table 10 shows the average daily
temperature range for each month for a 15
number of sites in Auckland. Owairaka
has the smallest temperature range for 10
any station and Pukekohe has the largest.
5
Diurnal temperature ranges are also
0
relatively minor. Table 11 and Figure 00 01 02 03 04 05 06 07 08 09 10 11 12 13 14 15 16 17 18 19 20 21 22 23
15 show mean hourly temperatures for Time
Auckland Airport for January and July. Figure 16. Mean hourly temperatures at Auckland Airport, January
and July.
24Earth Temperatures
Earth temperatures are measured
at varying depths and are important,
amongst other things, for determining
the growth and development of plants.
Different plants have different rooting 30 10 cm 20 cm 30 cm 100 cm Air temp
depths and earth temperatures are
25
routinely monitored at 10, 20, 30, 50, and
Temperature (°C)
100 cm depths. 20
Although earth temperatures are 15
particularly sensitive to specific site
10
conditions (aspect, elevation, soil
colour and type, etc.) no great spatial 5
variations in earth temperatures are 0
apparent in Auckland. Fluctuations in Jan Feb Mar Apr May Jun Jul Aug Sep Oct Nov Dec
earth temperatures are less than air Month
temperatures due to the slower heating
Figure 17. Average monthly 9 am earth temperatures for different depths
and cooling rates of the soil. Highest and monthly mean air temperature at Auckland Airport.
temperatures are found in January or
February and lowest in July or August.
Table 12 lists mean monthly earth
temperatures for a number of standard
depths. Figure 16 shows how earth
temperatures change throughout the year
for different depths at Auckland Airport.
The temperature cycle for 100 cm depth is
more damped than shallower depths.
Table 12. Mean 9am earth temperatures at different Auckland locations (°C), with site elevations in brackets
Location Jan Feb Mar Apr May Jun Jul Aug Sep Oct Nov Dec Ann
Whenuapai Airport 10cm 19.2 19.3 17.5 14.5 11.5 9.7 8.4 9.4 11.0 13.1 15.8 17.9 13.9
(26m) 20cm 20.7 20.9 19.1 16.2 13.2 11.2 9.8 10.7 12.1 14.1 17.0 19.2 15.3
30cm 20.4 20.7 19.3 16.7 13.9 11.8 10.4 11.1 12.4 14.3 16.9 18.9 15.6
Auckland, Owairaka 10cm 20.1 20.2 18.6 16.0 13.5 11.1 9.7 10.4 12.3 14.4 16.5 18.7 15.1
(41m) 20cm 20.8 21.0 19.3 16.7 14.2 11.9 10.5 11.1 12.8 14.9 17.2 19.4 15.8
30cm 21.4 21.7 20.2 17.7 15.3 13.0 11.6 12.1 13.6 15.7 17.9 19.9 16.7
Auckland Airport (7m) 10cm 20.4 20.4 18.5 15.8 13.0 10.7 9.5 10.2 12.2 14.1 16.6 18.9 15.0
20cm 21.1 21.2 19.5 16.6 13.8 11.7 10.4 11.1 12.6 14.7 17.2 19.5 15.8
30cm 21.5 21.5 20.0 17.2 14.5 12.3 11.1 11.7 13.1 15.1 17.6 19.8 16.3
100cm 20.1 20.7 20.3 18.6 16.5 14.4 13.1 12.9 13.6 14.9 16.7 18.5 16.7
Pukekohe EWS (88m) 10cm 20.3 20.2 18.2 15.5 12.7 10.1 9.1 10.0 12.2 14.0 16.3 18.9 14.8
20cm 21.1 21.4 19.5 16.7 13.9 11.4 10.2 10.8 12.7 14.9 17.0 19.5 15.8
50cm 20.9 21.6 20.4 18.2 15.8 13.3 11.7 12.0 13.2 15.1 17.0 19.3 16.6
100cm 18.9 19.9 19.8 18.6 16.9 15.0 13.4 12.9 13.3 14.4 15.9 17.5 16.4
25Frosts
Compared with many parts of the country, Auckland are rare in most parts of Auckland. Ground frosts are
is mild and frosts are generally light and infrequent. recorded when the air temperature 2.5 cm above a
Frosts only occur under very stable conditions and are clipped grass surface falls to -1.0°C or lower. Ground
accompanied by shallow inversions where temperature frosts can be quite frequent in Auckland, especially in
increases with height. Frost is a local phenomenon and sheltered inland areas. Areas vulnerable to radiation
its frequency of occurrence can vary widely over very fog are those most likely to suffer frost; whether fog
small areas. Areas most likely to be subjected to frost or frost occurs is usually the result of the moisture
are flat areas, where air is not able to drain away on content of the air. Table 13 lists for selected sites
calm nights, and valleys, where cold air is likely to drift the mean daily grass minimum and extreme grass
from higher areas. minimum temperatures and the average number of
days each month with ground and air frosts. Data on
There are two types of frost recorded. Air frosts,
air temperatures (mean daily, monthly minima and
when air temperature measured in a screen by a
extreme minima) can be obtained from Figure 14.
thermometer 1.3 m above the ground falls below 0°C,
Table 13. Occurrences of frosts and grass minimum temperatures in Auckland.
Location Jan Feb Mar Apr May Jun Jul Aug Sep Oct Nov Dec Ann
Leigh 2 a 13.5 14.2 12.9 11.1 8.9 7.2 6.5 6.5 7.3 8.6 10.2 11.9 9.9
b 4.3 5.4 2.4 0.4 -0.5 -1.8 -2.0 -0.6 0.0 1.0 2.6 4.3 -2.0
c 0.0 0.0 0.0 0.0 0.0 0.2 0.2 0.0 0.0 0.0 0.0 0.0 0.4
d 0.0 0.0 0.0 0.0 0.0 0.0 0.0 0.0 0.0 0.0 0.0 0.0 0.0
Henderson River Park a 11.7 12.0 9.9 7.8 5.9 3.5 2.3 3.0 4.7 6.9 8.6 10.7 7.3
b 2.2 1.3 -1.3 -4.2 -4.7 -8.9 -8.3 -6.7 -4.7 -3.4 -0.6 0.8 -8.9
c 0.0 0.0 0.0 0.5 2.2 6.3 7.9 6.4 3.4 0.8 0.0 0.0 27.4
d 0.0 0.0 0.0 0.0 0.1 2.7 3.8 1.5 0.6 0.0 0.0 0.0 8.8
Auckland Airport a 13.8 14.2 12.4 9.6 7.6 5.7 4.9 5.6 7.1 9.0 10.7 12.8 9.5
b 3.1 4.2 2.2 -0.8 -2.7 -4.4 -6.0 -4.2 -3.0 -1.8 1.5 2.5 -6.0
c 0.0 0.0 0.0 0.0 0.7 2.5 3.7 1.2 0.6 0.1 0.0 0.0 8.7
d 0.0 0.0 0.0 0.0 0.0 0.0 0.1 0.0 0.0 0.0 0.0 0.0 0.1
Pukekohe EWS a 11.9 12.1 10.4 8.3 6.9 4.7 3.7 4.2 5.6 7.6 8.6 10.8 7.9
b 2.4 0.6 0.1 -2.9 -2.2 -5.4 -5.0 -5.1 -3.3 -2.9 -1.4 0.0 -5.4
c 0.0 0.0 0.0 0.1 0.5 4.2 4.9 2.5 1.2 0.5 0.0 0.0 13.9
d 0.0 0.0 0.0 0.0 0.1 0.4 0.1 0.1 0.0 0.0 0.0 0.0 0.7
a: mean daily grass minimum (°C)
b: lowest grass minimum recorded (°C)
c: average number of ground frosts per month
d: average number of air frosts per month
26Sunshine and Solar Radiation
Sunshine
Most parts of Auckland receive about
2000 hours of bright sunshine per year
(Figure 17). In general, central and eastern
areas receive more bright sunshine than
western and southern areas of the region,
and islands in the Hauraki Gulf (e.g.
Waiheke, Little Barrier, and Great Barrier
Islands) receive even higher sunshine
hours – over 2100 hours in some places.
Southern areas around Pukekohe receive
the least bright sunshine in the region.
Figure 18 shows the monthly breakdown of
bright sunshine experienced in Auckland,
showing that it is cloudier during the
winter months than in the summer.
Figure 18. Median annual sunshine hours for Auckland, 1981-2010.
Leigh 2 Auckland City
Bright Sunshine (hours)
Bright Sunshine (hours)
300
300
200
200
100
100
Highest Recorded
0
0
J F M A M J J A S O N D J F M A M J J A S O N D
Bright Sunshine (hours)
Bright Sunshine (hours)
Auckland Airport Pukekohe MAF
Mean
300
300
200
200
Lowest Recorded
100
100
0
0
J F M A M J J A S O N D J F M A M J J A S O N D
Figure 18. Mean monthly sunshine for Auckland sites, and minimum and maximum sunshine hours recorded. These graphs were
calculated from all available data.
27Solar radiation
Solar radiation records are available for a number of
sites in Auckland. Mean daily global solar radiation is
presented in Table 14 for Leigh, Henderson, Auckland
Airport, and Pukekohe. Insolation is at a maximum in
December and January and a minimum in June.
Table 14. Mean daily global solar radiation (MJ/m2/day).
Location Jan Feb Mar Apr May Jun Jul Aug Sep Oct Nov Dec Ann
Leigh 2 23 20 17 12 9 7 8 10 14 18 21 23 15
Henderson, AKL 21 18 15 11 8 6 7 9 13 16 19 20 13
Auckland Airport 23 20 16 12 8 7 7 10 14 17 21 22 15
Pukekohe EWS 21 19 16 11 8 7 7 10 13 16 19 21 14
UV (Ultra-violet radiation)
Ultra-violet radiation (UV) is recorded at two sites in
Auckland, and the site with the most data is Leigh.
Table 15 and Figure 19 show the mean daily UV Index
at Leigh compared with Lauder, a site in the lower
South Island. Leigh records higher UV levels than
Lauder throughout the year due to Leigh’s northern
location, although at both sites, summer months
record significantly higher UV levels than winter
months. Figure 20 shows an example of a UV forecast
for Auckland city, and indicates the levels of UV where
sun protection is required.
Table 15. Mean daily maximum UV Index at Leigh and Lauder.
Location Jan Feb Mar Apr May Jun Jul Aug Sep Oct Nov Dec Ann
Leigh 12.2 10.7 8.4 5.1 2.8 1.8 1.9 3.0 4.8 7.2 9.8 11.5 6.6
Lauder 10.4 8.9 6.0 2.9 1.3 0.8 0.9 1.7 3.3 5.2 7.9 10.0 4.9
14 Leigh Lauder
12
10
UV Index
8
6
4
2
0
Jan Feb Mar Apr May Jun Jul Aug Sep Oct Nov Dec
Month
Figure 20. Mean daily maximum UV Index at Leigh and Lauder.
28Figure 21. UV Index forecast for Auckland city, January and July.
Source: https://www.niwa.co.nz/our-services/online-services/uv-and-ozone
Fog
The frequency of fog varies widely over the Auckland The third type of fog is that caused by radiation cooling
region. As the definition of fog is cloud at ground in low lying areas where there is little wind. These
level with a horizontal visibility of 1000 m or less, the radiation fogs have preferred locations where the air
stratus cloud which forms on hill tops in rain must be tends to pond, and usually occur in winter. The average
regarded, and is sometimes called ‘high fog’. Areas number of days per year with fog for selected stations in
predominantly affected by this type of fog are the the Auckland region is listed in Table 16. Favoured areas
Waitakere and Hunua Ranges. for fog formation in the Auckland region are Whenuapai
(44 fogs per year on average) and Warkworth (23 fogs
Advection fogs, caused by warm moist air masses
per year).
moving over cooler surfaces, are most common in
late summer or autumn. They are associated with the
tropical wet season, and mainly occur in the warm
northeast winds ahead of decaying storms of tropical Table 16. Average number of days each year with
origin. Advection fogs can affect large areas and are thunder, fog, and hail, from all available data.
deep enough to blanket most high ground. They can Location Thunder Fog Hail
dominate the weather for one to three days and occur Leigh 2 7 5 1
several times each year in the Auckland region, though Warkworth 5 23 8
mainly in autumn. Whenuapai Airport 11 44 5
Auckland, Albert Park 12 10 4
Auckland, Owairaka 6 15 3
Auckland, Henderson,
3 6 8
River Pk
Auckland Airport 12 17 4
Auckland, Ardmore 1 4 1
Hunua Edl 4 16 15
Port Fitzroy, Great
3 1 1
Barrier
29Severe convective storms
Thunderstorms
In Auckland thunderstorms occur throughout the year, concrete slabs on a construction site crushed their
and have a maximum frequency in the winter months truck, and there were dozens of other injuries. On one
when cold, unstable air masses cross the region. street in Hobsonville, no houses escaped damage, with
Average annual frequencies for selected stations are roofs and windows broken and trees felled. Hundreds
given in Table 16, and range from 12 in Auckland city of people were displaced by the tornado, 150 homes
(Albert Park) and Auckland Airport to only one per year were damaged, and an emergency Civil Defence centre
at Ardmore Airport. At some of the stations, it is likely was set up at Whenuapai Airport. Damage costs were
that not all the thunderstorms are detected. The heavy estimated at $11 million.
rain, lightning, hail, wind squalls, and rare tornadoes
which can occur with thunderstorms will sometimes Sea swell and waves
cause severe local flooding, disruption of electrical and In enclosed waters such as the Waitemata, Manukau,
electronic equipment, and damage to trees, crops, and and Kaipara Harbours, it is unlikely that the wind
buildings. generated waves ever exceed two metres. This is
because the winds to generate such waves would
Hail
need to be either a steady wind of 70 km/hr or more (a
Table 16 gives the average number of days per year very rare event in Auckland), or would require a much
on which hail is reported at selected stations. These longer fetch than the enclosed harbours provide.
range from 15 at Hunua to one at Leigh, Ardmore,
There is a known relationship between steady wind
and Great Barrier Island. As with thunderstorms, an
speed and wave heights over the open sea. The most
unknown number of hail falls will escape detection at
probable wave heights for a given wind speed over a
some of the stations. Hail is most likely over the six
typical fetch length in New Zealand coastal waters of
months from June to November.
about 500 km are given in Table 17.
Severe hailstorms are those containing stones with
Much of the swell that affects the west coast of
diameters of at least 0.5 cm or those which cause
New Zealand originates in the ocean to the south
damage to crops. One such severe hail event occurred
of Australia. On the west coast of Auckland, the
in November 1984, when parts of west Auckland near
most frequent swell direction is from the southwest,
Kumeu experienced a hail storm of up to 30 minutes
occurring nearly 40% of the time (Gorman et al.,
in duration. The storm, with hailstones up to 2.5 cm
2003). The frequency of swells of less than one metre
in diameter, caused significant damage to crops,
is about 20%, while swell over two metres occur
glasshouses, sheds, trees, and houses. The estimated
approximately 35% of the time. Heavy southwest swells
damage cost was over $10 million 2008 dollars.
are particularly noticeable in winter and spring.
Tornadoes On the east coast of Auckland, swells from an easterly
Tornadoes are rapidly rotating columns of air extending or northeasterly direction tend to predominate. These
from the base of a cumulonimbus cloud, and have can originate from tropical cyclones well to the north
in New Zealand a damage path typically 10-20 m of New Zealand or from anticyclones far to the east.
wide and 1-5 km long. The small size (compared to Of all swells observed on the east coast the frequency
tornadoes in the USA), their short lifetimes and the of those less than one metre is about 40%, while for
sparse population of much of New Zealand, must those greater than two metres is 8% (Gorman et al.,
result in an unknown number of tornadoes not being 2003). The islands in the Hauraki Gulf form a buffer to
reported. During the period 1981-2012, 26 damage- large swells for the majority of the region.
causing tornadoes were reported in Auckland. One
particularly severe tornado event was on 6 December
2012, when a tornado swept through the Hobsonville
area near Whenuapai. Three people were killed when
30Table 17. Generated wave heights associated with specific wind
speeds. Assumes a fetch length of 500 km with unlimited wind
duration.
Wind speed (km/hr) Associated wave height (m)
10 0.5
20 1
30 2
40 3
50 4
75 7
100 11
125 13+
31DERIVED CLIMATOLOGICAL
PARAMETERS
Apart from elements such as temperature and rainfall wilting in plants). Average 9 am vapour pressures for
which can be measured directly, it has been found that several stations are given in Table 18.
parameters computed from several elements have
Relative humidity is high in all seasons throughout
some important uses especially in industry. Parameters
the region due to the influence of the surrounding sea
which define the overall suitability of the climate for
and the lack of any large mountain masses. Table 19
agriculture, horticulture, architectural and structural
gives the average relative humidity at 9 am for selected
designs, and contracting, etc., are vapour pressure,
stations in Auckland. Most of the region shows similar
relative humidity, evapotranspiration (leading to soil
relative humidity throughout the year, with Leigh
water balance), degree-days (thermal time), and rainfall
generally experiencing the lowest average relative
extremes. Some of these parameters and their uses are
humidity for the region and Ardmore experiencing the
discussed in the following paragraphs. Short-term high
highest average relative humidity.
intensity rainfalls have been covered previously.
As Auckland’s mean temperature is higher than in
Vapour pressure and relative humidity places further south and relative humidity is similar,
Auckland has a somewhat higher vapour pressure than
Vapour pressure and relative humidity are the two
other main centres. The effect of this on people is what
parameters most frequently used to indicate moisture
leads to Auckland’s climate being considered humid
levels in the atmosphere. Both are calculated from
in comparison to other centres. Figure 21 shows how
simultaneous dry and wet bulb thermometer readings,
vapour pressure varies in the main centres across New
although a hygrograph may be used to obtain
Zealand.
continuous humidity readings.
20 Auckland Wellington Christchurch Dunedin
Vapour pressure is the part of total air pressure that 18
results from the presence of water vapour in the
9 am vapour pressure (hPa)
16
atmosphere. It varies greatly with air masses from 14
12
different sources, being greatest in warm air masses 10
that have tropical origins and lowest in cold, polar- 8
6
derived air masses. Vapour pressure can be important
4
in determining the physiological response of organisms 2
to the environment (very dry air, especially if there is a 0
Jan Feb Mar Apr May Jun Jul Aug Sep Oct Nov Dec
pre-existing soil moisture deficit, can cause or increase Month
Figure 22. Monthly average 9 am vapour pressures; Auckland,
Wellington, Christchurch, Dunedin.
Table 18. Mean monthly/annual 9 am vapour pressure (hPa) for selected Auckland stations.
Location Jan Feb Mar Apr May Jun Jul Aug Sep Oct Nov Dec Ann
Leigh 2 17.9 18.4 17.4 15.7 14.0 12.5 11.7 11.8 12.5 13.2 14.3 16.4 14.6
Henderson River Park 18.2 18.6 17.1 15.8 13.7 11.5 10.8 11.6 12.9 13.6 14.6 16.7 14.6
Auckland Airport 17.4 17.9 16.7 15.2 13.4 11.8 11.0 11.4 12.4 13.0 14.0 16.0 14.2
Auckland Ardmore 18.3 18.6 16.9 15.2 13.4 11.6 10.9 11.4 12.9 13.9 14.7 17.0 14.6
Pukekohe EWS 17.5 18.3 16.5 14.8 13.3 11.6 10.7 11.4 12.5 13.1 14.0 16.1 14.1
Table 19. Mean monthly/annual 9 am relative humidity (%) for selected Auckland stations
Location Jan Feb Mar Apr May Jun Jul Aug Sep Oct Nov Dec Ann
Leigh 2 79 80 79 78 80 81 81 81 79 78 78 78 79
Henderson River Park 80 85 86 89 91 92 92 91 85 82 78 78 86
Auckland Airport 77 80 81 83 86 88 88 85 81 79 77 77 82
Auckland Ardmore 86 88 87 89 91 92 92 91 88 88 84 85 88
Pukekohe EWS 81 85 84 84 88 90 90 88 85 83 80 80 85
33Evapotranspiration and soil water balance
Evapotranspiration is the process where water held
in the soil is gradually released to the atmosphere
through a combination of direct evaporation and
transpiration from plants. A water balance can be
calculated by using daily rainfalls and by assuming
that the soil can hold a fixed amount of water with
actual evapotranspiration continuing at the maximum
rate until moisture depletion of the soil occurs. The
calculation of water balance begins after a long
dry spell when it is known that all available soil
moisture is depleted or after a period of very heavy
rainfall when the soil is completely saturated. Daily
calculations are then made of moisture lost through
evapotranspiration or replaced through precipitation.
If the available soil water becomes insufficient to
maintain evapotranspiration then a soil moisture
Table 20. Mean monthly/annual water balance summary for a soil moisture capacity of 150 mm
Location Jan Feb Mar Apr May Jun Jul Aug Sep Oct Nov Dec Ann
Leigh 2 DE 78 68 40 18 2 0 0 0 0 4 45 73 329
ND 16 15 11 8 1 0 0 0 0 1 10 16 79
RO 3 0 10 8 28 53 89 72 35 10 0 2 309
NR 0 0 0 1 2 6 9 9 4 1 0 0 32
Auckland Albany ND 78 74 41 15 2 0 0 0 0 1 27 55 293
RO 16 16 12 7 1 0 0 0 0 0 6 12 70
NR 9 4 7 7 33 84 120 81 44 22 3 1 415
DE 0 0 0 1 3 10 12 10 5 2 0 0 46
Henderson River RO 70 62 34 10 1 0 0 0 0 0 13 46 235
Park NR 15 14 10 5 1 0 0 0 0 0 3 10 57
DE 6 3 6 10 50 122 152 107 66 36 7 4 570
ND 0 0 0 1 6 14 15 13 8 4 1 0 62
Auckland Airport NR 98 73 43 16 2 0 0 0 0 3 47 74 357
DE 19 16 12 7 2 0 0 0 0 1 10 15 81
ND 3 3 1 2 29 66 98 66 30 15 0 3 315
RO 0 0 0 0 3 9 12 9 4 2 0 0 40
Pukekohe EWS DE 56 53 26 8 0 0 0 0 0 0 5 26 174
ND 13 14 8 4 0 0 0 0 0 0 1 6 48
RO 6 2 1 9 44 117 124 99 51 45 13 13 522
NR 0 0 0 1 6 14 15 13 6 6 1 1 63
DE is the average amount of soil moisture deficit in mm
ND is the average number of days per month on which a soil moisture deficit occurs
RO is the average amount of runoff in mm
NR is the average number of days per month on which runoff occurs
34deficit occurs and irrigation becomes
necessary to maintain plant growth.
Runoff occurs when the rainfall exceeds
the soil moisture capacity (assumed to
be 150 mm for most New Zealand soils).
The Auckland region is comparatively
well served by frequent rainfalls in winter,
but due to high evapotranspiration and
a minimum of rainfall, soil moisture
levels in summer are frequently such that
irrigation or watering is necessary.
Mean monthly and annual water balance
values are given in Table 20, for a number
of sites in Auckland. It can be seen from
this table that Auckland has about 11
days between November and April when
there is insufficient soil moisture to
maintain plant growth without irrigation,
but this number varies between sites
and between months. There is adequate
moisture available to maintain plant
growth between May and October. Figure
22 shows region-wide variability in days of
soil moisture deficit per year.
Potential evapotranspiration (PET) has
been calculated for Leigh, Auckland
Airport, and Pukekohe, using the Penman
method (Penman, 1948). The monthly
Figure 23. Auckland median annual days of soil moisture deficit, 1981-2010
mean, minimum, and maximum PET
values are listed in Table 21.
Table 21. Penman calculated maximum, mean, and minimum monthly average potential evapotranspiration (mm)
Location Jan Feb Mar Apr May Jun Jul Aug Sep Oct Nov Dec Ann
Leigh 2 Max 169 143 123 89 60 42 50 61 84 120 144 159
Mean 150 123 110 72 49 35 39 53 74 104 124 141 1074
Min 117 103 89 56 38 29 30 47 59 82 104 118
Auckland Airport Max 187 146 124 79 51 36 45 60 81 126 150 176
Mean 161 129 109 65 40 27 31 48 72 107 133 153 1075
Min 137 113 91 52 33 18 23 35 61 87 116 139
Pukekohe EWS Max 155 112 98 61 37 25 26 43 61 93 119 135
Mean 129 103 88 52 31 19 22 35 54 82 102 120 837
Min 111 92 78 43 27 14 17 29 45 65 92 109
35Degree-day totals
The departure of mean daily temperature
above a base temperature which has
been found to be critical to the growth
or development of a particular plant is a
measure of the plant’s development on
that day. The sum of these departures
then relates to the maturity or harvestable
state of the crop. Thus, as the plant grows,
updated estimates of harvest time can be
made. These estimates have been found
to be very valuable for a variety of crops
with different base temperatures. Degree-
day totals indicate the overall effects of
temperature for a specified period, and can
be applied to agricultural and horticultural
production. Growing degree-days express
the sum of daily temperatures above a
selected base temperature that represent
a threshold of plant growth. Table 22 lists
the monthly totals of growing degree-day
totals above base temperatures of 5 °C and
10 °C for sites in Auckland.
Cooling and heating degree days are
measurements that reflect the amount
of energy that is required to cool or
heat buildings to a comfortable base
temperature, which in this case is 18°C.
Figure 24. Median annual heating degree days for Auckland, 1981-2010.
Table 23 shows that the number of cooling
degree days reach a peak in summer in
Auckland, where there is a higher demand
for energy to cool building interiors to
18 °C. Conversely, heating degree days
Table 22. Monthly/annual average growing degree-day totals above base 5°C and 10°C.
Location Jan Feb Mar Apr May Jun Jul Aug Sep Oct Nov Dec Ann
Leigh 2 5°C 449 425 439 370 323 255 234 235 260 303 336 405 4032
10°C 294 284 284 220 168 105 80 81 110 148 186 250 2209
Whenuapai Airport 10°C 429 400 395 305 242 179 158 184 217 266 320 385 3481
5°C 274 259 240 156 91 48 32 44 71 112 170 230 1728
Henderson River 5°C 458 426 414 329 267 185 166 189 233 293 333 411 3704
Park 10°C 303 285 259 180 113 52 36 48 87 138 183 256 1939
Auckland Airport 10°C 459 432 428 340 277 204 184 205 243 293 337 415 3817
10°C 304 290 273 190 123 64 45 56 94 138 187 260 2025
Pukekohe EWS 5°C 426 403 397 317 262 188 166 181 220 268 300 376 3504
10°C 271 262 242 168 109 52 32 39 74 113 150 221 1734
36reach a peak in winter, where the demand
for energy to heat buildings to 18°C is
highest. Figure 23 shows region-wide
variability in the number of heating
degree days per year. The number of
heating degree days tends to be lower in
low elevation coastal areas, compared
with areas further inland and at higher
elevations.
Table 23. Average cooling (CDD) and heating (HDD) degree-day totals with base 18 °C
Location Jan Feb Mar Apr May Jun Jul Aug Sep Oct Nov Dec Ann
Leigh 2 CDD 50 60 42 12 1 0 0 0 0 0 3 21 190
HDD 4 2 7 32 82 136 169 168 130 100 57 20 907
Whenuapai Airport HDD 39 42 23 3 0 0 0 0 0 0 3 18 129
CDD 14 8 31 87 161 211 246 219 173 137 73 36 1396
Henderson River CDD 63 63 32 8 1 0 0 0 0 1 6 31 205
Park HDD 8 4 21 69 137 205 237 214 157 111 63 23 1250
Auckland Airport HDD 61 67 38 7 1 0 0 0 0 0 4 30 209
HDD 5 3 13 57 126 186 219 198 147 110 57 18 1140
Pukekohe EWS CDD 40 44 23 5 1 0 0 0 0 0 2 15 129
HDD 17 8 29 77 142 203 237 222 170 135 91 42 1373
37You can also read