High-impact thunderstorms of the Brisbane metropolitan area
←
→
Page content transcription
If your browser does not render page correctly, please read the page content below
CSIRO PUBLISHING

Journal of Southern Hemisphere Earth Systems Science, 2019, 69, 239–251
https://doi.org/10.1071/ES19017

     High-impact thunderstorms of the Brisbane
     metropolitan area

     Joshua S. Soderholm A,D, Kathryn I. Turner B, Jordan P. Brook B, Tony Wedd C and
     Jeffery Callaghan C
     A
       Australian Bureau of Meteorology, GPO Box 1289, Melbourne, Vic. 3001, Australia.
     B
      The University of Queensland, St Lucia, Qld., Australia.
     C
       Australian Bureau of Meteorology, Brisbane, Qld., Australia.
     D
       Corresponding author. Email: joshua.soderholm@bom.gov.au

     Abstract. Accurate thunderstorm warnings in the hours-to-minutes preceding impact are often limited by the complex
     evolution of the mesoscale atmospheric environment. To accurately capture these complexities, analysis of observations
     remained central to operational short-term nowcasting predictions of thunderstorms. Over the past 40 years, multiple high-
     impact thunderstorm events have impacted the Brisbane Metropolitan Area (BMA) of South East Queensland resulting in
     significant insured losses. Four of these high-impact events were the focus of the following work. These cases included
     three events that resulted in the greatest insured losses for the BMA, exceeding AU$4 billion (2017) (18 January 1985,
     16 November 2008 and 27 November 2014) and a fourth significant event (24 December 1989). Synthesis of previous
     work indicates that the four high-impact cases occurred during a south-easterly change with strengthening winds ahead of
     the change, suggesting commonalities may exist that can be exploited for forecasting. This paper provides a detailed
     observational analysis of the environment and convective storms from the four BMA events to explore discriminating
     characteristics that may improve the skill of nowcasting. For the four BMA events, significant deep convection was
     observed along the change for the hours prior to the change’s arrival at the Brisbane Airport, potentially acting as an early
     indicator of favourable conditions for high-impact thunderstorms. It was found that the timing of the south-easterly change
     through Brisbane was also highly correlated for all events, occurring within a 90-min window during the mid-afternoon
     convective heating maximum. Despite the destructive severe weather, upper air conditions were marginal for supporting
     organised thunderstorms, highlighting the importance of capturing mesoscale processes, such as the south-easterly
     change. To further understand possible discriminators of the four high-impact BMA cases, a 10-year climatology of the
     mesoscale and synoptic environment associated with south-easterly change events was developed for the warm season
     months of November to January. It is shown that although only a small number of events are associated with high-impact
     BMA thunderstorms, these events share a set of conditions relating to the prechange wind shift, timing of the south-easterly
     change and radar signatures.

     Received 28 May 2019, accepted 8 November 2019, published online 11 June 2020

1 Introduction                                                        et al. 2014). Distinguishing the environments which support
The impact of thunderstorms upon the Brisbane Metropolitan            potentially catastrophic thunderstorms from numerous lower
Area (BMA) and the encompassing South East Queensland                 impact storms remains a challenge for forecasters. One potential
(SEQ) region of Australia is recognised through both climato-         discriminator is the south-easterly change synoptic type, which
logical (Allen and Karoly 2014; Peter et al. 2015; Soderholm          Soderholm et al. (2017b) showed is associated with significantly
et al. 2017a; Allen and Allen 2016) and event-based studies           more severe thunderstorm days than other synoptic conditions.
(Richter et al. 2014; Soderholm et al. 2016, 2017b). Although         Furthermore, the south-easterly change type is associated with the
most thunderstorms have a limited impact on the BMA, the              four events that are the focus of this study: the 18 January 1985
region experiences more reports of large hail (.2 cm) and             Brisbane hailstorm, the 24 December 1989 Redcliffe peninsula
damaging wind gusts (.25 m s1) than any other Australian             tornadic storm, the 16 November 2008 windstorm at The Gap and
capital city (Allen and Karoly 2014). Furthermore, a small            the 27 November 2014 Brisbane hailstorm. Understanding the
number of these severe events have resulted in catastrophic losses    conditions which favour these destructive thunderstorms during a
for densely populated suburbs of the BMA, leaving a lasting           south-easterly change is essential for improving the prediction of
impression upon the public (e.g. The Gap windstorm, Richter           future events in the BMA.

Journal compilation Ó BoM 2019 Open Access CC BY-NC-ND                                                  www.publish.csiro.au/journals/es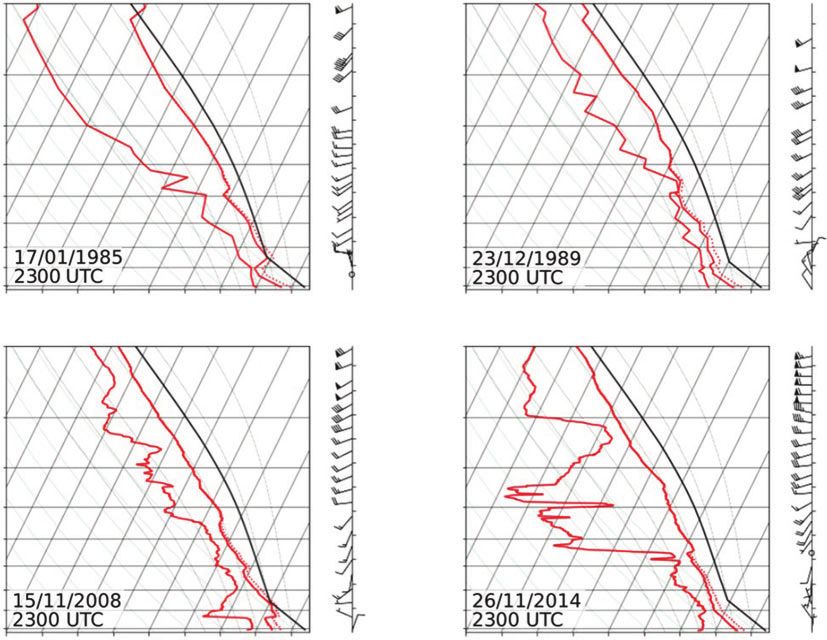
240      Journal of Southern Hemisphere Earth Systems Science                                                                            J. S. Soderholm et al.

         Markers

               Airport Weather Station
                                                                                                                                          N
               Eagle Farm Radar
               Mt Stapylton Radar
               CP2 Radar                                                                                                                           27.0°S
               Brisbane City
               Locality

         Land use types

               Urban
               Water                                                                                                                               27.5°S
               Terrain > 300 m
               Terrain > 500 m
               Terrain > 750 m

         Storm tracks

               27-11-2014
                                                                                                                                                   28.0°S
               16-11-2008

               24-12-1989
                                                                                                                     0    10   20   30    40 km
               18-01-1985

        151.5°E                  152.0°E                152.5°E                 153.0°E                 153.5°E                 154.0°E

      Fig. 1. South East Queensland region of Australia. Location of referenced localities, Brisbane Airport (YBBN), Archerfield Airport (YBAF) and
      Coolangatta Airport (YBCG) weather stations, and weather radars shown. The approximate Brisbane Metropolitan Area (BMA) extent is shown by
      the map insert. Approximate paths of the 1985, 1989, 2008 and 2014 events are illustrated on the insert map of the BMA region. Terrain is contoured
      at 200 m intervals from 300-m elevation.

    The climate of SEQ is characterised by a warm coastal                         (1996) noted that high-impact severe thunderstorm events in
subtropical regime, with prevailing easterly trade winds and                      SEQ are often associated with the passage of a south-easterly
local sea breezes. The occasional passage of dry continental or                   change boundary.
tropical air masses supports a variable synoptic environment                         South-easterly air mass changes in SEQ are forced by a
during the austral spring and summer. Thunderstorm environ-                       developing coastal ridge which generally propagates behind a
ments are often characterised by high instability and marginal                    boundary causing cooler air to be channelled northward along
deep layer (0–6 km) bulk wind difference, limiting the potential                  the eastern slopes of the Great Dividing Range. Previous
for long-lived organised convection that is typically associated                  studies focusing on the south-easterly change of the SEQ
with destructive impacts (Peter et al. 2015). The physical setting                region are absent; however, numerous studies have documen-
is characterised by undisturbed-forested mountain ranges (800–                    ted a similar phenomenon, known colloquially in New South
1200 m) bordering the southern and western regions of SEQ,                        Wales (NSW) as the southerly buster. Pertinent characteristics
providing an initiation mechanism for convective storms                           include the northward moving cold air mass, terrain channel-
(Fig. 1). The adjacent coastal plains are extensively modified                    ling and rapid drop in temperature with a positive pressure
for agriculture and urbanisation (including the city of Brisbane).                gradient. A key difference to the south-easterly change,
During spring and summer, sea breezes develop across these                        documented by numerous studies (Colquhoun et al. 1985;
coastal plains on 8–14 days per month (Soderholm et al. 2017b).                   Holland and Leslie 1986; Howells and Kuo 1988), lies in the
Increased low-level shear and moisture associated with the sea-                   deformation of the front. The southerly buster has been shown
breeze air mass potentially favours the intensification of some                   to coincide with the deformation of a cold front moving over
thunderstorm events (e.g. Soderholm et al. 2017b), while                          the Australian Alps Baines (1980) (Holland and Leslie 1986;
weakening others (e.g. Soderholm et al. 2016). The passage of                     Howells and Kuo 1988). By the time the cold front has reached
air mass boundaries through the region also provides the                          the central coast of NSW, its frontogenic nature has weakened
much-needed low-level shear to support thunderstorm organi-                       significantly, resulting in a slower propagation and a weaker
sation in the typically weak wind shear conditions of a subtropi-                 thermal gradient. The extent that the modified air mass inter-
cal climate (e.g. Sills et al. 2004). Furthermore, Callaghan                      acts with the land and relatively warm (.208C) coastal sea as it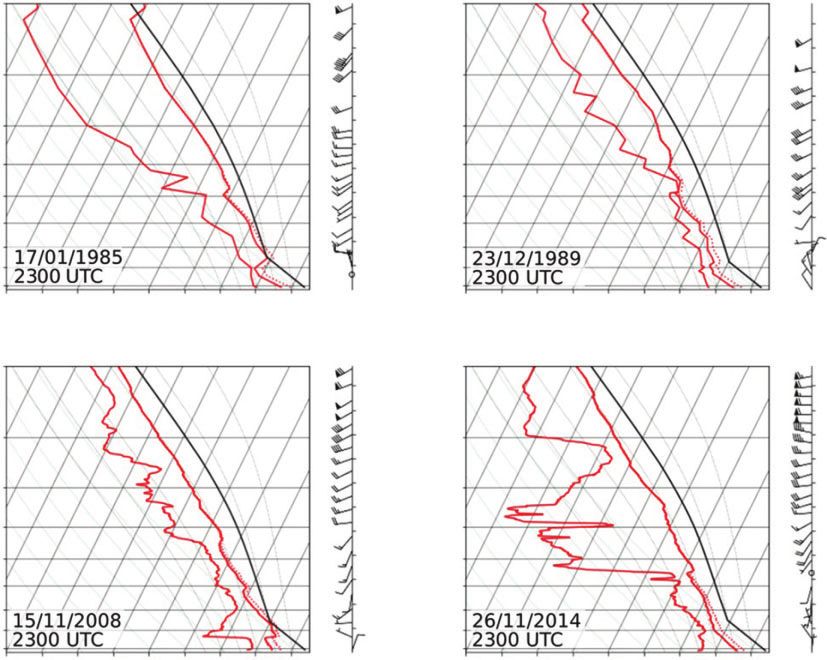
High-impact thunderstorms Journal of Southern Hemisphere Earth Systems Science 241
propagates across SEQ is unknown, as is the influence upon the (a) (b)
convective environment. The following paper provides an
analysis of the four BMA high-impact events and comparison
against a 10-year climatology of south-easterly changes. These
comparisons provide the basis of a discussion of potential
discriminators that aim to assist the identification of future
high-impact thunderstorms in the BMA.
2 Event summary and impacts
The severe thunderstorm events of 18 January 1985, 24
December 1989, 16 November 2008 and 27 November 2014 (c) (d )
resulted in significant losses to SEQ and a lasting community
awareness. Insured losses from 1985 event are the second
highest recorded in Australia (after the 1999 Sydney hailstorm)
and the highest for the BMA, with a total of AU$2.27 billion
(2017 value; Insurance Council of Australia 2017). Damage
extended from the south-western suburbs of the BMA to
Brisbane Airport (YBBN) in the north-east, with a damage area
width of 8–12 km (Fig. 1, Callaghan 1996). A wind gust of
40 m s1 (78 kn) was reported at the Brisbane City weather
station and the 51 m s1 (101 kn) wind gust at YBBN remains
the highest recorded for the SEQ region. Roof damage was Fig. 2. Photographs of building damage form the (a) 1985 event at Zillman
reported to over 20 000 houses, with 2000 homes unroofed and Road, Hendra (Courier Mail), (b) 1989 event at Newport Waterways Marina,
12 declared structurally unsafe (Fig. 2a, Johnstone 1985). The Redcliffe (Courier Mail), (c) 2008 event at The Gap (Dave Hunt/EPA) and
event impacted Brisbane during peak hour (0700 hours UTC; (d) 2014 event at Turbot St, Brisbane (Jessy Sahota).
local time ¼ UTC þ 10 h) on a weekday (Friday), increasing
motor vehicle exposure to hailstones as large as tennis ball size
(.65 mm, Johnstone 1985). vehicle damage (Fig. 2d, Parackal et al. 2015). The time of
The 1989 Christmas Eve event impacted the northern bay- day (0600 hours UTC) contributed to significant motor vehicle
side suburbs of the BMA primarily through tornado damage, damage, with a total insured loss of AU$1.54 billion (2017
resulting in several injuries and two deaths (Fig. 1, Southorn value; Insurance Council of Australia 2017).
1989). Nearly 1000 homes were damaged with ,500 unroofed
and extensive damage to the Redcliffe marina (Fig. 2b). The cell
tracked north along the Queensland coastline for over 4 h 3 Synoptic and mesoscale environment
resulting in AU$11.8 million (1990 value; Insurance Council Surface and upper air synoptic analyses at 0000 hours UTC
of Australia 1990, personal communication, 9 July) of insured (1000 hours local time) were generated for each event using the
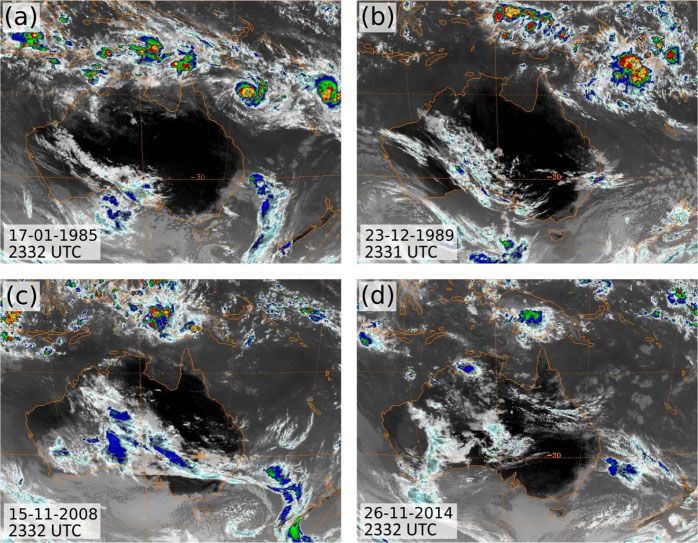
losses. Ignoring changes to residential buildings and contents, ERA-Interim reanalysis (Fig. 3, Dee et al. 2011). To diagnose
the consumer price index provides an estimated 2017 value of cloud characteristics, infrared (10.2–11.2 mm) satellite imagery
AU$24.5 million for insured losses. for three different platforms (GMS-3, GMS-4 and MTSAT-1R)
On the 16 November 2008, a destructive wet microburst was sourced from the International Satellite Cloud Climatology
impacted the north-western suburbs of the BMA, in Project (ISCCP) around 2330 hours UTC (Fig. 4, Knapp 2008).
particular the suburb of The Gap. Radial wind velocities For all four events, a broad trough associated with the dryline
exceeding 43 m s1 (84 kn) were observed by the Doppler and upper level ridge (board region of warm 500-hPa
radar, in addition to reports of 40-mm hailstones (Leitch et al. temperature) is present across northern Australia (Fig. 3),
2009; Richter et al. 2014). Damage was reported to 1300 maintaining clear conditions across SEQ on the morning of each
houses, 262 of which were declared structurally unsafe event (Fig. 4). A developing surface ridge along the south-
(Fig. 2c, O’Brien 2009). Fortunately the event occurred on a eastern coast of Australia is also present, extending from a high-
Sunday afternoon, limiting the exposure of motor vehicles. pressure region in the Great Australian Bight. Upper level
Insured losses from the event exceeded AU$224 million temperature (500 hPa) over south-eastern Australia indicates the
(2017 value; Insurance Council of Australia 2017, B Buckley presence of a negatively tilted trough over the Tasman Sea. For
2018, personal communication, 28 March). the 2008 event, a vertically stacked low remains closer to the
The most recent high-end event to impact the BMA occurred Australian coastline and a cloud band from the associated cold
on Thursday the 27 November 2014, damaging an area extend- front is evident in satellite imagery. Conditions over SEQ were
ing from the south-western to the north-eastern suburbs. A wind not indicative of high-end severe thunderstorm environments
gust of 39 m s1 (76 kn) was observed by the Archerfield Airport given the absence of notable surface and upper level troughing,
(YBAF) surface station and giant 70 mm hailstones were with 500 hPa temperatures between 8 and 108C (Table 1).
observed in the CBD, creating widespread roof and motor Cloud along the northern and eastern edge of the south-easterly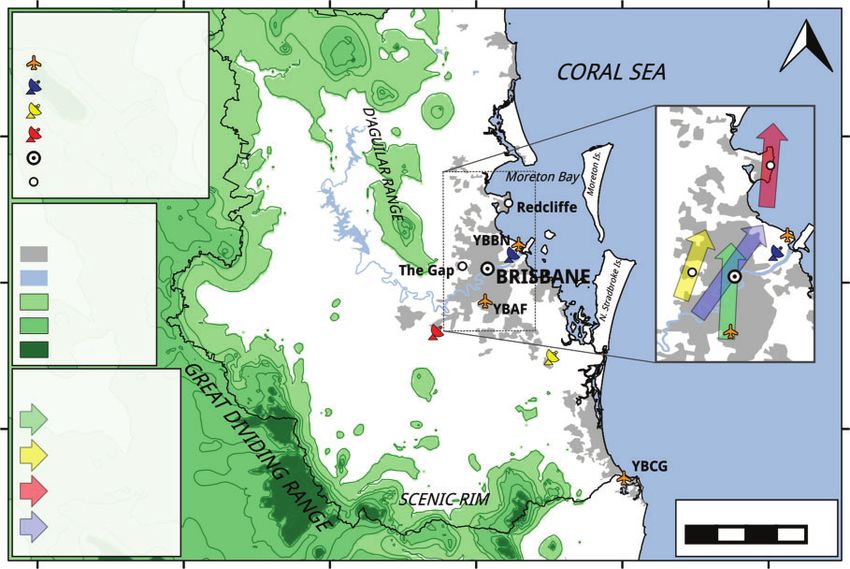
242    Journal of Southern Hemisphere Earth Systems Science                                                                                        J. S. Soderholm et al.

                                                                                                                            0
                          (a)                                               (b)
                   15°S                                              15°S
                                                                                                                            –5

                   30°S                                              30°S

                                                                                                                                  500 hPa temperature (°C)
                                                                                                                            –10

                   45°S                                              45°S

                             120°E     135°E     150°E     165°E               120°E     135°E     150°E      165°E         –15

                          (c)                                               (d )
                   15°S                                              15°S                                                   –20

                   30°S                                              30°S
                                                                                                                            –25

                   45°S                                              45°S
                                                                                                                            –30
                             120°E     135°E     150°E     165°E               120°E     135°E     150°E      165°E

                   Fig. 3. Mean sea level pressure (contoured) and colour shaded 500 hPa temperature from the ERA-Interim
                   reanalysis for the 1985 (a), 1989 (b), 2008 (c) and 2014 (d) events at 0000 hours UTC. The location of the surface
                   high pressure centre over southern Australia is marked by a red letter ‘H’. The positioning of the dryline over
                   Queensland is shown with a white dotted line.

                       (a)                                                    (b)

                       (c)                                                    (d )

                     Fig. 4. Enhanced infrared imagery for the Australia region from satellites GMS-3 (a), GMS-4 (b) and
                     MTSAT-1R (c, d) (Knapp 2008).

air mass can also been seen offshore of NSW for each event and                   To further analyse the prestorm environments of each case,
a postfrontal cloud field further south associated with the high-             morning (2300 hours UTC) upper air soundings from Brisbane
pressure region.                                                              Airport (YBBN) were processed using the Sharppy package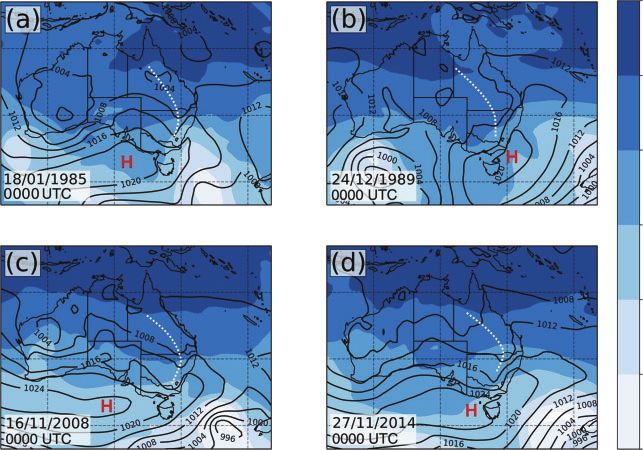
Table 1. Climatological analysis from June 2007 to July 2017 of 30 south-easterly change characteristics using observations Brisbane (YBBN), Archerfield (YBAF) and Coolangatta (YBCG)
Airports and Mt Stapylton radar
CAPE and CIN was calculated by inserting 0300 hours UTC YBAF surface parcels into the preceding 2300 hours UTC YBBN sounding. The 0–6-km bulk wind shear, 850- and 500-hPa temperature and
precipitable water are taken from the preceding 2300 hours UTC YBBN sounding. Prechange wind shift is calculated as the difference between the half-hourly observation before the change and
observation 60 min prior. The deep convection indicator is defined as radar echoes exceeding 50 dBZ before 0430 hours UTC across the southern SEQ region. SBCAPE, Surface-based CAPE; SEQ, South
East Queensland
Upper air Radar Change arrival (UTC) Prechange wind shift(8)
High-impact thunderstorms
Date From 0300 hours UTC YBAF parcel Bulk wind diff Temperature (8C) Precipitable South SEQ storms YBCCG YBBN Diff. (h) YBBN
water (mm) by 0430 hours
UTC
SBCAPE (J kgB) CIN (J kgI) (0–6 km kts) 850 hPa 500 hPa
High Impact Brisbane
18 January 85 2153 6 17 19 8 38.8 Yes 0100 0700 6 30
24 December 89 1191 0 31 15 9.7 42.1 Yes 0400 0530 1.5 0
16 November 08 1607 0 33 18.5 8 36.9 Yes 0400 0700 3 60
27 November 14 1772 0 27 14.1 10 31.7 Yes 0430 0730 2.5 40
Severe storms near change
04 December 08 3186 49 41 20.5 8 34.8 No 0030 0400 3.5 10
11 December 08 3265 0 39 18 6.2 36.3 Yes 0530 0800 2.5 10
03 January 10 879 79 25 17.6 6 52 No 0030 0300 3 10
27 December 11 1478 2 43 16.5 10 39.7 Yes 0230 0530 3 20
22 January 14 4052 0 14 21.3 8 39.7 No 0100 0730 7.5 10
18 December 16 578 12 33 16.6 8 43.2 Yes 0030 0300 2.5 10
02 January 17 1377 0 16 17.5 3 41.4 No 0900 1100 2 10
Nonsevere storms near change
17 December 07 1793 0 6 16 6 48.1 No 0100 0430 3.5 10
30 November 09 892 0 49 18 14 21.9 No 0800 1200 4 20
11 December 09 1659 48 25 19.9 7.8 38.6 No 1030 1330 3 0
02 January 13 1461 7 17 20.6 8.2 17.4 No 0700 1000 3 10
29 November 13 1166 4 35 17.5 7.5 26.7 No 1000 1230 2.5 40
29 December 13 4135 0 39 22.5 9.2 32.7 Yes 0930 1200 2.5 20
10 November 16 1896 24 52 18.5 8.7 34.7 Yes 0730 0930 2 10
No storms near change
19 December 08 4362 I 31 21.4 11 29.6 No 0830 1130 3 0
16 November 12 2466 15 25 20 10 21.1 No 0900 1100 2 0
19 November 12 544 0 41 16.3 13 19.7 No 0100 0630 5.5 10
19 January l3 2990 5 17 22.1 5 42.8 No 0300 1130 8.5 0
24 November 13 2854 0 35 16.5 10 37.8 No 1100 1300 4 0
24 December 13 326 54 19 18 4 19.9 No 0530 1130 6 20
04 January 14 1767 91 31 25.5 6 36.2 No 0530 0830 3 20
19 December 14 276 0 29 16.4 9.2 21.5 No 0730 1130 4 0
15 January 15 2107 0 23 20 5 45.8 No 0500 1000 5 0
21 November 15 326 177 4 20 7 23.7 No 0730 0930 2 0
15 January 16 354 61 12 20.3 7 28.1 No 0130 0430 3 30
Journal of Southern Hemisphere Earth Systems Science
09 December 16 258 229 33 21.3 7.3 44.9 No 0800 1130 3.5 30
243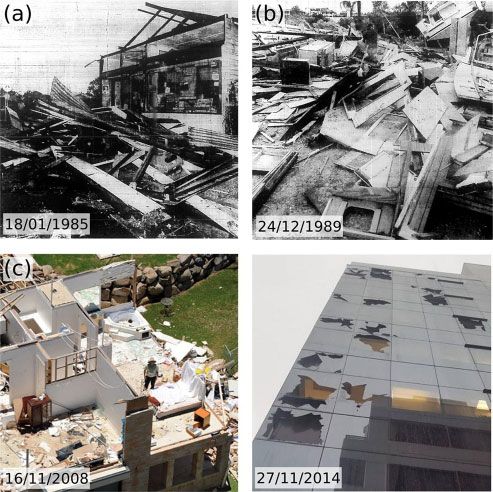
244 Journal of Southern Hemisphere Earth Systems Science J. S. Soderholm et al.
(a) 200 (b) 200
11 11
10 10
300 9 300 9
8 8
Pressure (hPa)
Altitude (km)
400 7 400 7
6 6
500 5 500 5
600 4 600 4
700 3 3
700
800 2 800 2
900 1 900 1
1000 1000
–50 –40 –30 –20 –10 0 10 20 30 –50 –40 –30 –20 –10 0 10 20 30
Temp. (°C) Temp. (°C)
(c) 200 (d) 200
11 11
10 10
300 9 300 9
8
Pressure (hPa)
8
Altitude (km)
7 400 7
400
6 6
500 5 500 5
600 4 600 4
3 3
700 700
2 2
800 800
900 1 900 1
1000 1000
–50 –40 –30 –20 –10 0 10 20 30 –50 –40 –30 –20 –10 0 10 20 30
Temp. (°C) Temp. (°C)
Fig. 5. Morning (2300 hours UTC) radiosonde profiles from Brisbane Airport for the 1985 (a), 1989 (b), 2008 (c) and 2014 (d) events.
Dew point (left solid red line), temperature (right solid red line) and virtual temperature (right dotted red line) shown. Theoretical surface
parcel profile (black line) derived from respective 0300 hours UTC Archerfield weather station observation (Fig. 1).
(Fig. 5, Blumberg et al. 2017). The surface parcel from the marginal, ranging between 8.7 m s1 (17 kn) for the 1985 event
morning soundings was modified to the 0300 hours UTC and 17 m s1 (33 kn) for the 1989 event. Prior to additional low-
Archerfield Airport (YBAF) weather station observation level shear generated by the south-easterly change, the high
(Fig. 1) to better represent the prestorm conditions further inland. instability weak shear environments observed in sounding pro-
Virtual temperature correction was applied for calculation of files would have indicated to forecasters that highly organised
parcel-based parameters (Doswell and Rasmussen 1994). Lifted thunderstorms were unlikely (Weisman and Klemp 1982).
surface parcels were found to be uncapped, with the exception of To diagnose the afternoon convective potential and the
the 1985 event which had 6 J kg1 of Convective Inhibition. spatial variability of the near-surface environment, meso-
Surface-based convective available potential energy (SBCAPE) analyses of SEQ were prepared using 0500 hours UTC weather
were moderate to high for deep convection, ranging from station observations. These are shown in Fig. 6 (Koch and Ray
1191 J kg1 for the 1989 event to 2153 J kg1 for the 1985 event. 1997). For each event, the south-easterly change can be identi-
Precipitable water calculated from the sounding ranged between fied as a zonal air mass boundary with south-easterly winds
29.2 mm for 1985 and 42.1 mm for 1989. Furthermore, dry-air between 5 and 8 m s1 (10–15 kn) to the south of the boundary.
layers were largely absent from the 1989 and 2008 profiles, The wind speeds associated with the change are weaker than
suggesting that thunderstorms updrafts would remain relatively those documented for southerly busters (e.g. .15 m s1,
free of dry-air entrainment. All profiles exhibit light winds Colquhoun et al. 1985). For all events, the change arrived in
(,5 m s1 and ,10 kn) below 3 km, with north-west to north- Brisbane during the late afternoon, coinciding with peak diurnal
easterly winds at the surface ahead of the change. Above 3 km, heating, whereby surface parcels approach maximum instability
winds backed from the west to southwest with a gradual increase (Table 1). North of the south-easterly change, a meridionally
in speed to .26 m s1 (50 kn) at 9 km, with the exception of the aligned wind shift boundary can be seen. For the 1985, 2008 and
1989 case, where winds increased to 18 m s1 (35 kn) at 4 km. 2014 cases, this boundary likely relates to the effects of the Great
Bulk wind difference between 0 and 6 km were as a result Dividing Range, with westerly momentum mixed to the surface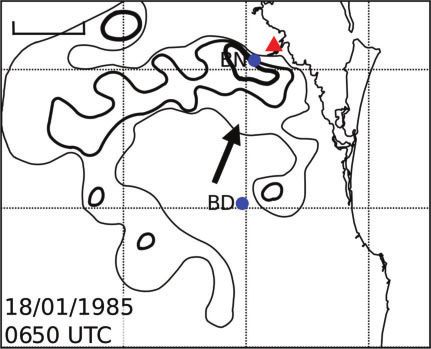
High-impact thunderstorms                                                          Journal of Southern Hemisphere Earth Systems Science   245

                                (a)                                               (b)
                      26.4°S

                       27°S

                      27.6°S

                      28.2°S

                      28.8°S

                                 (c)                                              (d )
                      26.4°S

                       27°S

                      27.6°S

                      28.2°S

                      28.8°S

                               151.2°E 151.8°E 152.4°E 153°E 153.6°E           151.2°E 151.8°E 152.4°E      153°E   153.6°E

                     Fig. 6. Observed surface temperature (8C, red text), dew point (8C, green text), winds (short barb: 2.5 kn
                     and long barb: 5 kn) at 0500 hours UTC for the 18 January 1985, 24 December 1989, 16 November 2009 and
                     27 November 2014 events across South East Queensland. The city of Brisbane is shown with a blue marker
                     and the town of Beaudesert is shown with a red marker. Different air masses are shown as shaded regions,
                     including hot and moderately humid continental (red), warm and very humid maritime (light blue) and the
                     cool and very humid south-easterly change (dark blue).

of the elevated terrain and north-easterlies extending to the               YBBN surface observations available is at a 30-min interval.
foothills of the range (Fig. 1). Sea breezes are common in SEQ              The last YBBN observation before storm arrival and, therefore,
during warmer months and advect a north-easterly maritime air               the most representative of prestorm environment was at 0630
mass over the region (Soderholm et al. 2016). For the 1989 case,            hours UTC. Surface temperature had cooled by 38C (now 288C)
the drier continental air found in the north-western SEQ was                since 0500 hours UTC, likely due to increasing altocumulus
replaced with a very humid air mass under large scale northerly             coverage noted by the YBBN observer. Dew point temperature
to north-easterly flow (Fig. 3b). In comparison to the other three          remained steady (less than 18C drop) over this period. During the
cases, coastal wind speeds for 1989 were less, suggesting a                 same period, YBBN surface winds veered from 30 to 608 TN and
weaker sea breeze was present. This is likely the result of                 increased from 11 to 15 kn. Inflow parcels for the severe
morning cloud cover, evident in both the satellite imagery                  thunderstorms originated from this easterly air mass as it
(Fig. 4b) and the 2300 hours UTC sounding profile as a saturated            approached the BMA, opposed to the sea-breeze air mass
layer at 550 hPa (Fig. 5b), inhibiting diurnal heating and large            observed at 0500 hours UTC. Even with the reduced buoyancy
scale north-easterly flow further weakening the land-sea tem-               from a cooler prestorm environment, the increased storm-
perature gradient.                                                          relative flow would have been more favourable for organisation
    Ongoing evolution of the prestorm environment must be                   (Coniglio et al. 2011). Thirty-minute YBBN surface observa-
expected in the hours preceding storm impact due to strong                  tions for the 1989 event show a comparable cooling (38C) and
diurnal heating, the sea-breeze circulation and the approaching             strengthening of prechange flow (by 5 kt), but no change in
south-easterly change. Only the 1989 change arrived at YBBN                 direction (308 TN) between the 0330 hours UTC and 0500 hours
shortly after the 0500 hours UTC observation, whereas the                   UTC observations.
change for the 1985, 2008 and 2014 events arrived more than                     For the 2008 and 2014 cases, 1-min observations from
1.5 h later. For the 1985 case, the highest temporal resolution of          YBBN are shown in Fig. 7 for the 90-min period prior to the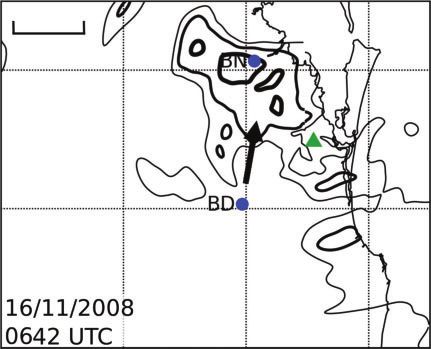
246 Journal of Southern Hemisphere Earth Systems Science J. S. Soderholm et al.
(a) 30 (b) 30
Air temperature Air temperature
28 28
Dew point Dew point
Temperature (°C)
Temperature (°C)
26 26
24 24
22 22
20 20
18 18
0515 0525 0535 0545 0555 0605 0615 0625 0635 0645 0540 0550 0600 0610 0620 0630 0640 0650 0700 0710
Time (UTC) Time (UTC)
12 140 12 100
90
10 120 10
80
Wind direction (TN)
Wind direction (TN)
Wind speed (m/s)
Wind speed (m/s)
100 70
8 8
60
80
6 6 50
60 40
4 4
40 30
Wind speed Wind speed 20
2 20 2
Wind direction Wind direction 10
0 0 0 0
0515 0525 0535 0545 0555 0605 0615 0625 0635 0645 0540 0550 0600 0610 0620 0630 0640 0650 0700 0710
Time (UTC) Time (UTC)
Fig. 7. One-minute surface observation from the Brisbane Airport (YBBN) weather station for the 90 min preceding the south-easterly change for the 2008
(a) and 2014 (b) events. Air temperature (blue solid line), dew point temperature (light blue dashed line), wind speed (green solid line) and wind direction
(light green dashed line) shown.
arrival of the south-easterly change. The higher temporal noted a deep, well-mixed layer above the sea-breeze circula-
sampling resolves significantly more variability than the tion. Soderholm et al. (2017a) attributed this layer to the
30-min observations from the 1985 and 1989 events, including advection of the continental boundary layer eastwards over
an easterly wind shift of greater magnitude to the 1985 event the coastal plains. Richter et al. (2014) suggested that the drier
(80 and 608 shift c.f. 308). Cooling of a similar magnitude to the layer could have contributed to the destructive surface winds by
1985 event (48C) occurred for the 2014 event, but not the 2008 enhancing the cold-pool intensity through stronger evapoura-
event. Furthermore, in contrast to the 1985 event, surface wind tive cooling. Without afternoon profile data for the 1985 and
speed weakened (.4 kn decrease) for both 2008 and 2014 cases. 1989 events, the contribution of elevated air masses remains
Both the temperature (2014) and wind shift (2008 and 2014) unknown.
occurred concurrently within 30–40 min window prior to the
arrival of the change. This correlation suggests that the cooling
for the 2014 case, and possibly the 1985 case, was in response to 4 Radar comparison
a change in onshore flow characteristics rather than cooling Significant changes to weather radar technology and data over
from increasing cloud coverage. These changes on timescales of the 29 years between the 1985 and 2014 cases requires careful
tens of minutes are poorly sampled by the 30-min observations; consideration when comparing the four case study events. For
therefore, it is impossible to rule out similar processes occurring the 1985 event, only Terminal Area Severe Turbulence (TAST)
prior to the 1985 and 1989 BMA storms. radar tracings are available from the BoM Eagle Farm weather
Richter et al. (2014) and Soderholm et al. (2017a) show the surveillance radar (Fig. 1). These tracings were collected by
respective 2008 and 2014 BMA storms that were surface-based manually tracing radar scans from a cathode-ray tube display at
at the time of impact and that inflow parcels were mostly three reflectivity levels (30, 40 and 50 dBZ) from the 0.58 plan
sourced from the onshore flow ahead of the change. YBBN position indicator (PPI) scan. For the 1989 event, printouts of
observations have shown that surface parcels were becoming digital radar imagery from the Eagle Farm radar are available,
less buoyant in the tens of minutes prior to the change; however, providing six reflectivity levels (15, 30, 40, 45, 50 and 55 dBZ)
elevated parcels may have remained more favourable. Analysis from the 0.58 PPI scan. The TAST tracings and imagery
of profile data from the afternoon of the 2008 and 2014 cases by printouts were georeferenced and digitised using the QGIS
Richter et al. (2014) and Soderholm et al. (2017a) captured the software package and plotted using the Cartopy package. For
evolution of elevated air masses. For upper levels (,700 hPa), the 2008 and 2014 events, digital radar data was sourced from
the temperature and shear profile remained very similar to the the Brisbane Mt Stapylton Doppler weather radar. The Py-ART
0000Z sounding. Within the boundary layer, both case studies software package was used to process the 0.58 PPI imagery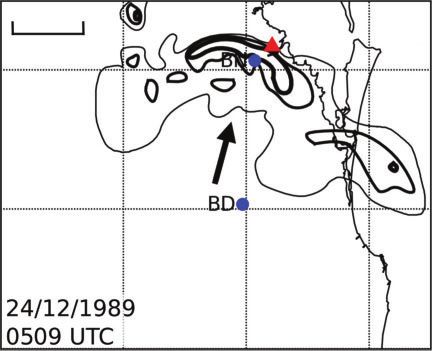
High-impact thunderstorms                                                               Journal of Southern Hemisphere Earth Systems Science             247

  (a)          30 km                                                             (b)          30 km

  27.5°S                                                                         27.5°S

    28°S                                                                           28°S

  28.5°S                                                                         28.5°S
       152°E             152.5°E            153°E             153.5°E                 152°E             152.5°E            153°E             153.5°E

  (c)          30 km                                                             (d )         30 km

  27.5°S                                                                         27.5°S

    28°S                                                                           28°S

  28.5°S                                                                         28.5°S
       152°E            152.5°E             153°E             153.5°E                 152°E             152.5°E            153°E             153.5°E

  Fig. 8. Contoured low-level reflectivity for the 1985 (a), 1989 (b), 2008 (c) and 2014 (d) thunderstorm events. Radar scan times are selected to show the
  first detection of deep convection in South East Queensland prior. Reflectivity contours are shown at 30 (thin lines), 40 (medium lines) and 50 (boldface
  lines) dBZ levels. Locations of Brisbane (BN) and Beaudesert (BD) are shown. Location of Eagle Farm and Mt Stapylton radars marked with a red and
  green triangle, respectively.

(Helmus and Collis 2016). Data were smoothed using a                             of SEQ, confirming that severe storms were present well before
Gaussian filter (s ¼ 4.0) and contoured at the TAST levels (30,                  impact on the BMA (Johnstone 1985; Southorn 1989). The
40 and 50 dBZ) to replicate the style of the 1985 TAST tracing                   discrete nature of the high reflectivity regions and damage
(Figs 8 and 9).                                                                  reports plausibly suggests a high-end multicell or supercell
    The radar scans shown in Fig. 8 represent the first detection                storm mode; however, any analysis of the nebulous radar
of reflectivities exceeding 50 dBZ for each case within the SEQ                  imagery remains highly subjective.
region. For all cases, the antecedent deep convection occurred                      For all cases except 1989, the severe thunderstorms which
within the southern Scenic Rim region of SEQ (Fig. 1), likely                    impacted the BMA initiated ahead of the antecedent convec-
forced by the colocated south-easterly change interacting with                   tion shown in Fig. 8. Regardless, all four cases traversed the
the mountainous terrain (Fig. 6). The 1985 and 1989 storms                       BMA with a north-northeast heading (Fig. 1) and exhibited
exhibited larger areas of high reflectivity (.50 dBZ) in contrast                large areas of reflectivity exceeding 50 dBZ (Fig. 9). A tight
to the 2008 and 2014 events. This area difference is partly due                  reflectivity gradient with a notch along the leading edge for the
to the larger sampling volume of the Eagle Farm radar beam (38)                  1985 and 2014 storms suggests a mesocyclone was present
at increasing range in comparison to Mt Stapylton (0.98                          within a parent supercell storm. Supercells are known for
beamwidth). Miscalibration of the Eagle Farm radar may have                      producing a disproportionate amount of large hail and tornadic
also increased the size of the high reflectivity areas. Regardless,              events (Moller et al. 1994; Smith et al. 2012). The 1989 case
these high reflectivity regions are associated with reports of                   exhibits a distinct quasi-linear convective system (QLCS)
widespread damage through southern and south-western areas                       mode by 0509 hours UTC over Brisbane, indicating a transition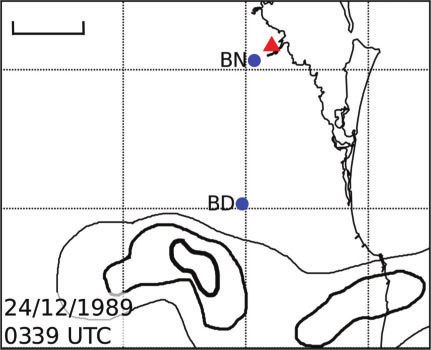
248      Journal of Southern Hemisphere Earth Systems Science                                                                           J. S. Soderholm et al.

  (a)          30 km                                                             (b)          30 km

  27.5°S                                                                         27.5°S

      28°S                                                                         28°S

  28.5°S                                                                         28.5°S
       152°E             152.5°E             153°E             153.5°E                152°E             152.5°E             153°E             153.5°E

  (c)          30 km                                                             (d )         30 km

  27.5°S                                                                         27.5°S

      28°S                                                                         28°S

  28.5°S                                                                         28.5°S
       152°E             152.5°E             153°E             153.5°E                152°E             152.5°E             153°E             153.5°E

  Fig. 9. Contoured low-level reflectivity for the 1985 (a), 1989 (b), 2008 (c) and 2014 (d) thunderstorm events at approximate time of impact.
  Reflectivity shown at 30 (thin lines), 40 (medium lines) and 50 (boldface lines) dBZ levels. An arrow indicating the direction of storm motion is shown for
  each case. Location of Beaudesert (BD) and Brisbane (BN) is marked. Location of Eagle Farm and Mt Stapylton radars is marked with a red and green
  triangle respectively.

from the possible discrete mode observed at 0339 hours UTC                        documents a high-end multicell mode where destructive winds
(Trapp et al. 2005). Furthermore, notches along the rear of the                   were likely the result of acceleration into a low-level mesocy-
QLCS are possible indicators of descending mid-level flow and                     clone. Remarkably, the 1985, 2008 and 2014 severe storms (and
damaging straight-line winds at the surface (Klimowski 1994;                      associated south-easterly change) arrived at Brisbane Airport
Skamarock et al. 1994). A tornado was reported along the                          (YBBN) within a 60-min window (630–0730 hours UTC). The
leading edge of the 1989 storm at 0545 hours UTC, impacting                       1989 QLCS event occurred earlier, at 0510 hours UTC. This
the Redcliffe peninsula area, possibly generated by a QLCS                        narrow window suggests that time of arrival is an important
mesocyclone (Australian Bureau of Meteorology 1989). Tran-                        factor for high-impact storms in the BMA; however, further
sient tornadoes associated with QLCS, in particular those with                    analysis is required in the context of a long-term climatology
bow echoes, have been documented in numerous cases (e.g.                          data set.
Trapp et al. 2005; Skow and Cogil 2017). Unfortunately an
outage of the Eagle Farm weather radar occurred shortly after                     5 Climatological context
the storm impacted the CBD, and no imagery was collected at                       The environmental and radar analysis have provided a number
the time of the tornado event to further understand the char-                     of shared characteristics between the four BMA events, in par-
acteristics of the parent storm.                                                  ticular the 1985, 2008 and 2014 events. The 1989 case differs
   In contrast, the 2008 storm exhibited an unorganised struc-                    due to the earlier arrival time of the south-easterly change
ture, lacking the tight reflectivity gradients observed during the                and the linear convective mode but shares comparable condi-
other events. Detailed analysis by Richter et al. (2014)                          tions prechange, including a warm maritime air mass and
High-impact thunderstorms Journal of Southern Hemisphere Earth Systems Science 249
mid-afternoon thunderstorm activity over southern SEQ. In Within the prechange environment, the three of the four
summary, these characteristics include BMA cases (1985, 2008 and 2014) exhibited a distinct
wind-shift of at least 308 from the north-east to east (veering)
1. Upper air: Modest environmental support for organised
during the hour prior to the change. The prechange wind shift is
convection (all cases)
also computed for the climatology events in Table 1. Across the
2. Radar: Mid-afternoon thunderstorm activity over southern
climatology, only two events meet this criterion but occurred on
SEQ region (all cases)
days where no storms were near the change. Prechange wind
3. Surface: Veering of prechange onshore flow from the north-
speed (3-h mean prior to change) was found to be more variable,
east to east just prior to change arrival (excludes 1989)
with many of the climatology cases exceeding the modest wind
4. Timing: Thunderstorm arrival at BMA between 0630 and
speeds of the 1985 and 2014 BMA cases (not shown). The
0730 hours UTC (excludes 1989)
average prechange wind-shift threshold of 308 is, therefore, the
To explore whether these characteristics and others discrim- most useful discriminator.
inate the 1985, 1989, 2008 and 2014 BMA events from thunder- Despite their widespread use, instability and wind shear para-
storms with limited or no impact, a climatological analysis was meters derived from the morning (2300 hours UTC) radiosonde
conducted. Given the south-easterly change was the dominant profile were found to have little relation to thunderstorm activity
synoptic feature for all four cases, a 10-year (2007–17) clima- during south-easterly changes. Table 1 shows the SBCAPE
tology of south-easterly change events for SEQ was compiled calculated from the morning profile using a parcel initialised
through the examination of 30-min surface observations, 2300 using the 0300 hours UTC (afternoon) observation from the
hours UTC radiosonde profiles, and radar observations held by Archerfield airport site (YBAF, Fig. 1). The YBAF site samples
the Australian Bureau of Meteorology. Only changes occurring the prestorm environment immediately south of the BMA, along
in November, December or January were considered, as these the expected storm track. Although moderate-to-high SBCAPE
months are considered to be the peak of the storm season was observed for the BMA cases (ranging between 1191 and
(Soderholm et al. 2017b) and include all four BMA events. 2153 J kg1), they do not represent the most unstable environ-
Candidate south-easterly change days were identified as a wind ments in the climatology. In total eight other events (26%) in the
shift between 2300 and 1100 hours UTC using the following climatology exhibited larger SBCAPE (over 4000 J kg1 in some
criteria: cases) but with negligible thunderstorm impact. The poor correla-
tion between instability and thunderstorm activity is likely influ-
1. 2300 hours UTC (0900 AEST) 10-min mean wind direction
enced by the use of morning soundings to represent an evolving
at Coolangatta Airport (YBGC, Fig. 1) from west-northwest
afternoon environment 5–6 h later, despite adjusts made using
through to east-northeast inclusive (337.5–67.58).
an afternoon surface parcel. The bulk wind difference between
2. 1100 hours UTC (2100 AEST) 10-min mean wind direction
the surface to 6 km observed for the BMA cases were generally
at YBGC between southeast to south inclusive (908 to 1808)
only moderate to marginally high, ranging from 8.7 to 17 m s1
with a minimum 10-min mean wind speed of 4.1 m s1
(17–33 kn). These values were equalled or exceeded by 36 % (11)
(8 kn).
events in the climatology, including four cases that exceeded the
Thirty south-easterly change events were identified using the BMA events in both buoyancy and bulk wind difference.
criteria above and are presented in Table 1 with respective Mid-afternoon (0500 hours UTC) thunderstorms were
parameters relating to the upper air and surface conditions. observed over southern SEQ in proximity to the arriving change
Events are grouped according the amount and intensity of for all BMA cases (Fig. 8), suggesting this signature is a potential
thunderstorm activity occurring with the change. Despite the precursor. Analysis of the climatology events shows that this
small sample size, this data set provides valuable insight into the signature occurred for 5 of the 14 other south-easterly change
environmental conditions that support thunderstorms during events with thunderstorms, supporting the use of this precursor.
south-easterly changes. The strongest discriminator between Examination of various thermodynamic parameters showed that
the four BMA events and other days was found to be the timing certain thresholds of moisture and instability are also useful for
of the south-easterly change across SEQ. For the southern separating the BMA cases. In particular, based on the 2300 hours
YBGC station, the arrival of the change is clustered between UTC radiosonde flight from YBBN, precipitable water of
0400 and 0430 hours UTC for three of the four cases, with the $30 mm (excludes 30% (9) cases in Table 1) and a 500-hPa
1985 event an outlier due to the earlier arrival time of 0100 hours temperature of #88C (excludes 43% (13) cases in Table 1) were
UTC. At YBBN, only for two other events did the south-easterly found to be necessary (but not sufficient) thresholds. The
change arrive within the 0530 and 0730 hours UTC window of observed thermodynamic profile for the BMA events was char-
the four BMA events. Excluding the 1989 event contracts this acterised by a generally moist environment up to a height of
window to a 60-min period between 0630 and 0730 hours UTC, ,650 hPa, with no large (greater than 100 hPa in depth) dry slots
for which only one other event occurred (22 January 2014) and below this level. The 850-hPa temperature did not exceed 198C
was also associated with severe storms outside of SEQ. This for any of the four case study events (cooler than 43% (13) other
mid-afternoon period is generally associated with a peak in cases). A well-mixed boundary layer and buoyant surface parcels
severe thunderstorm activity due to the convective heating provided zero or near-zero convective inhibition for all the BMA
maximum (e.g. Allen and Allen 2016), indicating that the cases in contrast to a 40% (12) other cases with greater capping.
passage of a south-easterly change at this time realises the most In combination with the prestorm radar analysis, the 10-year
diurnally favourable environment for convective storms. south-easterly change climatology yields five important, but not250 Journal of Southern Hemisphere Earth Systems Science J. S. Soderholm et al.
Table 2. Criteria relating to high-impact severe storms events in the Brisbane region during south-easterly changes
Variable Criteria Description
1 Arrival of south-easterly 0100–0430 hours UTC at YBCG Position of south-easterly change boundary as observed by automatic weather
change 0530–0730 hours UTC at YBBN stations
2 Pre-impact radar reflectivity Significant (.50 dBZ) returns by Significant convection should be observed in proximity to the change boundary by
0500 hours UTC radar and satellite south of Brisbane by 0500 hours UTC
3 Prechange wind shift .308 (veering) from the north-east Wind shift between the half-hourly observation prior to the change and the
observation 1 h before that
4 Precipitable water .30 mm Observed total precipitable water content from the 2300 hours UTC YBBN
radiosonde profile
5 500-hPa temperature ,88C Observed temperature at the 500-hPa pressure level from the 2300 hours UTC
YBBN radiosonde profile
sufficient, discriminators of high-impact events (Table 2). Cau- distinguishing the four high-impact events. Application of these
tion must be used when applying these discriminators to future criteria provides forecasters with an additional decision-making
events due to the small sample size; however, these discrimi- tool for identifying possible high-impact south-easterly change
nators do provide useful insight into characteristics of the events in the days and hours leading up to impact on the BMA.
prestorm environment, some of which are typically not consid- Soderholm et al. (2017b) and Richter et al. (2014) showed
ered in operational forecasting. that inflow parcels for the respective 2014 and 2008 BMA cases
originated from the onshore flow in the boundary layer. Further,
6 Summary this study has shown that onshore flow characteristics changed
Accurate prediction of high-impact thunderstorms remains a significantly within 1 h of the 2008 and 2014 storm events.
significant challenge for the BMA against a climatology of Quantifying the origin, buoyancy and shear of this new air mass
predominantly marginal events. Analysis of four high-impact is required to understand its convective potential, likely leading
events in the BMA, which included the three highest impact to the refinement of criteria in Table 2. This understanding will
events in the past 30 years, shows the south-easterly change benefit forecasting in thunderstorm prone coastal settings out-
synoptic type was associated with each case. Commonly applied side of SEQ which also experience similar south-easterly
upper air diagnostics for thunderstorms, including SBCAPE and changes, including the Sydney region and NSW coast. The
bulk wind difference, are poor discriminators for the severity for diversity of south-easterly changes identified through the cli-
the four BMA cases, promoting further investigation at the matological analysis merits further expansion to increase the
mesoscale. The presence of the south-easterly change boundary sample size. This will assist with refining the discriminating
was evidently critical for storm evolution, in particular, the criteria of high-impact storm events and possibly suggest a
arrival timing at the BMA during the mid-afternoon. Radar relationship with multiyear climate cycles. Further study of
imagery shows deep convection along the south-easterly change south-easterly changes using high-resolution model data sets
for all four BMA cases by mid-afternoon (0500 hours UTC). The (e.g. Bureau of Meteorology Atmospheric high-resolution
convective mode at time of the BMA impact was variable. Regional Reanalysis for Australia) and evaluation through field
Lower quality imagery from the Eagle Farm suggests a supercell experiments is encouraged by the authors given the role of this
and QLCS modes for the 1985 and 1989 events respectively. synoptic type for high-impact thunderstorm events in SEQ.
The modern Mt Stapylton radar clearly shows a high-end mul- Acknowledgements
ticell and supercell for the 2008 and 2014 events respectively. The authors express their gratitude for Tamika Tihema from the Brisbane
To identify discriminators for high-impact BMA cases from office of the Bureau of Meteorology for support developing the climato-
other south-easterly change events (some of which produced no logical analysis. Extraction of historical newspaper articles for the 1985 and
thunderstorms), a climatology of south-easterly change events 1989 cases was provided by Margretha Gould from the State Library of
over the last 10 years (November to January 2007–17) was Queensland. Assistance for calculating normalised insured losses was pro-
developed (Table 1). Five criteria were established to be impor- vided by Bruce Buckley from Insurance Australia Group. The authors wish
tant, but not sufficient, for high-impact thunderstorm for the BMA. to thank the forecasters of the Queensland office for their insightful dis-
First, the timing of the change boundary at YBCG (0100–0430 cussions towards this paper, in particular Dean Narramore, Andrew Bufalino
hours UTC) followed by arrival at YBBN (0530–0730 hours and David Grant, and Anthony Cornelius from WeatherWatch. Finally, the
authors wish to thank Harald Richter and two anonymous reviewers for the
UTC) was shown to be an important discriminator, in addition to
valuable input towards improving this study. This research did not receive
the presence of deep convection on the change by ,0430 hours any specific funding.
UTC. Wind direction shift ahead of the south-easterly change also
proved to be a useful indicator, raising further questions about the References
properties of this air mass. From the morning (2300 hours UTC) Allen, J., and Karoly, D. (2014). A climatology of Australian severe
Brisbane Airport (YBBN) sounding, precipitable water and thunderstorm environments 1979-2011: inter-annual variability and
500-hPa temperatures were also found to be useful for ENSO influence. Int. J. Climatol. 34(1), 81–97. doi:10.1002/JOC.3667High-impact thunderstorms Journal of Southern Hemisphere Earth Systems Science 251
Allen, J. T., and Allen, E. R. (2016). A review of severe thunderstorms in Leitch, C., Ginger, J., Harper, B., Kim, P., Jayasinghe, N., and Somerville, L.
Australia. Atmos. Res. 178–179, 347–366. doi:10.1016/J.ATMOSRES. (2009). Investigation of Performance of Housing in Brisbane Following
2016.03.011 Storms on 16 and 19 November 2008. Tech. Rep. 55. (James Cook
Australian Bureau of Meteorology (1989). Severe Weather Summary University: Townsville, Qld., Australia.)
Terminal No. 18 IDA10Q. Tech. Rep. (Australian Bureau of Meteorol- Moller, A. R., Doswell, C. A., Foster, M. P., and Woodall, G. R. (1994). The
ogy: Brisbane, Qld., Australia.) operational recognition of supercell thunderstorm environments and
Baines, P. G. (1980). The dynamics of the Southerly Buster. Austr. Meteorol. storm structures. Wea. Forecasting 9(3), 327–347. doi:10.1175/1520-
Mag. 28(4), 175–200. 0434(1994)009,0327:TOROST.2.0.CO;2
Blumberg, W. G., Halbert, K. T., Supinie, T. A., Marsh, P. T., Thompson, O’Brien, C. (2009). Storm Clean-Up Continues 12 Months On. Available at
R. L., and Hart, J.A. (2017). Sharppy: An open-source sounding analysis http://www.abc.net.au/news/2009-11-11/storm-clean-up-continues-12-
toolkit for the atmospheric sciences. Bull. Am. Meteorol. Soc. 98(8), months-on/1137536 [Verified 8 May 2020].
1625–1636. doi:10.1175/BAMS-D-15-00309.1 Parackal, K. I., Mason, M. S., Henderson, D. J., Smith, D. J., and Ginger, J. D.
Callaghan, J. (1996). Review of severe thunderstorm forecasting and the severe (2015). Investigation of Damage: Brisbane 27 November 2014. Tech.
thunderstorm warning service in the southeast coast district of Queensland. Rep. Cyclone Testing Station, College of Science; Technology and
In 5th Australian Severe Thunderstorm Conference. Australian Bureau of Engineering. (James Cook University, Townsville, Qld., Australia.)
Meteorology, Avoca Beach, New South Wales, p. 178. Peter, J. R., Manton, M. J., Potts, R. J., May, P. T., Collis, S. M., and Wilson, L.
Colquhoun, J. R., Shepherd, D. J., Coulman, C. E., Smith, R. K., and (2015). Radar-derived statistics of convective storms in southeast
McInnes, K. (1985). The Southerly Buster of South Eastern Australia: Queensland. J. Appl. Meteorol. Climatol. 54, 1985–2008. doi:10.1175/
An Orographically Forced Cold Front. Mon. Wea. Rev. 113, 2090–2107. JAMC-D-13-0347.1
doi:10.1175/1520-0493(1985)113,2090:TSBOSE.2.0.CO;2 Richter, H., Peter, J. R., and Collis, S. (2014). Analysis of a destructive wind
Coniglio, M. C., Corfidi, S. F., and Kain, J. S. (2011). Environment and storm on 16 November 2008 in Brisbane, Australia. Mon. Wea. Rev.
early evolution of the 8 May 2009 derecho-producing convective system. 142(9), 3038–3060. doi:10.1175/MWR-D-13-00405.1
Mon. Wea. Rev. 139(4), 1083–1102. doi:10.1175/2010MWR3413.1 Sills, D. M. L., Wilson, J., Joe, P. I., Burgess, D. W., Webb, R. M., and Fox,
Dee, D. P., Uppala, S. M., Simmons, A. J., Berrisford, P., Poli, P., Kobayashi, N. I. (2004). The 3 November tornadic event during Sydney 2000: storm
S., Andrae, U., Balmaseda, M. A., Balsamo, G., Bauer, P., Bechtold, P., evolution and the role of low-level boundaries. Wea. Forecasting 19,
Beljaars, A. C. M., van de Berg, L., Bidlot, J., Bormann, N., Delsol, C., 22–42. doi:10.1175/1520-0434(2004)019,0022:TNTEDS.2.0.CO;2
Dragani, R., Fuentes, M., Geer, A. J., Haimberger, L., Healy, S. B., Skamarock, W. C., Weisman, M. L., and Klemp, J. B. (1994). Three-
Hersbach, H., Hólm, E. V., Isaksen, L., Kållberg, P., Köhler, M., dimensional evolution of simulated long-lived squall lines. J. Atmos.
Matricardi, M., McNally, A. P., Monge-Sanz, B. M., Morcrette, J. J., Sci. 51(17), 2563–2584. doi:10.1175/1520-0469(1994)051,2563:
Park, B. K., Peubey, C., de Rosnay, P., Tavolato, C., Thépaut, J. N., and TDEOSL.2.0.CO;2
Vitart, F. (2011). The ERA-Interim reanalysis: configuration and per- Skow, K. D., and Cogil, C. (2017). A high-resolution aerial survey and radar
formance of the data assimilation system. Q. J. R. Meteorol. Soc. analysis of quasi-linear convective system surface vortex damage paths
137(656), 553–597. doi:10.1002/QJ.828 from 31 August 2014. Wea. Forecasting 32(2), 441–467. doi:10.1175/
Doswell, C. A., III, and Rasmussen, E. N. (1994). The effect of neglecting WAF-D-16-0136.1
the virtual temperature correction on CAPE calculations. Wea. Forecast- Smith, B. T., Thompson, R. L., Grams, J. S., Broyles, C., and Brooks, H. E.
ing 9, 625–629. doi:10.1175/1520-0434(1994)009,0625:TEONTV. (2012). Convective modes for significant severe thunderstorms in
2.0.CO;2 the contiguous United States. Part I: Storm classification and clima-
Helmus, J. J., and Collis, S. M. (2016). The python ARM radar toolkit tology. Wea. Forecasting 27(5), 1114–1135. doi:10.1175/WAF-D-11-
(Py-ART), a library for working with weather radar data in the python 00115.1
programming language. J. Open Res. Soft. 4(1), e25. doi:10.5334/JORS.119 Soderholm, J., McGowan, H. A., Richter, H., Walsh, K., Weckwerth, T. M.,
Holland, G. J., and Leslie, L. M. (1986). Ducted coastal ridging over S.E. and Coleman, M. (2016). The Coastal Convective Interactions Experi-
Australia. Q. J. R. Meteorol. Soc. 112(April), 731–748. doi:10.1002/QJ. ment (CCIE): understanding the role of sea breezes for hailstorm hot-
49711247310 spots in Eastern Australia. Bull. Am. Meteorol. Soc. 97(9), 1687–1698.
Howells, P., and Kuo, Y. H. (1988). A numerical study of the meso- doi:10.1175/BAMS-D-14-00212.1
scale environment of a Southerly Buster Event. Mon. Wea. Rev. Soderholm, J. S., McGowan, H., Richter, H., Walsh, K., Weckwerth, T. M.,
116(September), 1771–1788. doi:10.1175/1520-0493(1988)116,1771: and Coleman, M. (2017a). An 18-year climatology of hailstorms trends
ANSOTM.2.0.CO;2 and related drivers across Southeast Queensland, Australia. Q. J. R.
Insurance Council of Australia (2017). ICA Catastrophe Database. Available Meteorol. Soc. 143(703), 1123–1135. doi:10.1002/QJ.2995
at https://docs.google.com/spreadsheets/d/1vOVUklm2RR_XU1hR6db- Soderholm, J. S., Mcgowan, H. A. H., Richter, H., Walsh, K., Wedd, T., and
GMT7QFj4I0BGI_JAq4-c9mcs/edit?usp=sharing [Verified 8 May Weckwerth, T. M. (2017b). Diurnal preconditioning of subtropical
2020]. Coastal Convective Storm Environments. Mon. Wea. Rev. 145(9),
Johnstone, B. (1985). Storm’s Trail of Ruin. The Courier-Mail. 3839–3859. doi:10.1175/MWR-D-16-0330.1
Klimowski, B. A. (1994). Initiation and development of rear inflow within Southorn, E. (1989). Savage Storm Leaves $5m trail of damage. The
the 28–29 June 1989 North Dakota mesoconvective system. Mon. Courier-Mail.
Wea. Rev. 122(5), 765–779. doi:10.1175/1520-0493(1994)122,0765: Trapp, R. J., Tessendorf, S. A., Godfrey, E. S., and Brooks, H. E. (2005).
IADORI.2.0.CO;2 Tornadoes from squall lines and bow echoes. Part I: Climatological
Knapp, K. R. (2008). Scientific data stewardship of International Satellite distribution. Wea. Forecasting 20(1), 23–34. doi:10.1175/WAF-835.1
Cloud Climatology Project B1 global geostationary observations. Weisman, M., and Klemp, J. (1982). The dependence of numerically
J. Appl. Remote Sens. 2(November), 023548. doi:10.1117/1.3043461 simulated convective storms on vertical wind shear and buoyancy. Mon.
Koch, S., and Ray, C. (1997). Mesoanalysis of summertime convergence Wea. Rev. 110, 504–520. doi:10.1175/1520-0493(1982)110,0504:
zones in central and eastern North Carolina. Wea. Forecasting 12, TDONSC.2.0.CO;2
56–77. doi:10.1175/1520-0434(1997)012,0056:MOSCZI.2.0.CO;2
www.publish.csiro.au/journals/esYou can also read


