Management Reference Materials - May 2021 The Okinawa Electric Power Company, Inc.

Page created by Ethel Frazier
 
CONTINUE READING
Management Reference Materials - May 2021 The Okinawa Electric Power Company, Inc.
Management Reference Materials

                May 2021
        The Okinawa Electric Power Company, Inc.
Management Reference Materials - May 2021 The Okinawa Electric Power Company, Inc.
Contents
 Main contents                                                               Q&A contents
 Characteristics of the Business Base                                1       Q1.Topics of Okinawa’s Economy

[ Demand for Energy ]                                                         1) Current Status and Future Forecast of Okinawa's Economy                        23

 Okinawa Prefecture Demographics                                     2~3      2) Economic Growth of Okinawa Prefecture under the Okinawa Promotion Plan         24

 Number of incoming tourists                                         4~6     Q2.What is the Current State of U.S. Military Bases?                               25
 Urban Development of the Returned former U.S. military base sites
                                                                     7       Q3.What is the Current State of Promotion of Electrification?                      26
 and Others
[ Competition ]                                                              Q4.What is the enrichment of electricity rate menus?                               27

 Full liberalization of the Electricity Market                       8       Q5.What are the efforts to fuel cost reduction?                                    28~29

[ Total Energy Services ]                                                    Q6.The Fuel Cost Adjustment System                                                 30
                                                                             Q7.What is the approval that it's possible to engage in electricity transmission
 Gas supply business                                                 9                                                                                          31
                                                                               and distribution on concurrent?
 Energy Service Provider (ESP) Business                              10      Q8.What are the Special Tax Measures?                                              32

[ Electric Power Generation Facilities ]                                     Q9.What are the efforts to typhoon measures?                                       33

 Power Supply Composition                                            11      Reference 1:Trends of Ordinary Income and ROE                                      34
 Response to the Fade-out of Inefficient Coal-fired Thermal Power
                                                                     12      Reference 2:Trends of the Total Assets and Shareholder’s equity                    35
 Generation
 Demand-Supply balance                                               13      Reference 3:Trends of the Capital Expenditure and Free Cash Flows                  36

[ Remote Islands ]                                                           Reference 4:Change in Okinawa Electric Power’s Stock Price                         37

 Efforts to Improve Income and Expenditure                           14      Reference 5:Earnings Per Share and Payout Ratio                                    38

[ Global Warming Countermeasures ]                                           Reference 6:Policy for Returning Profits to Shareholders                           39

 Efforts to Global Warming Countermeasures                           15~16

 Partnership Agreement with Okinawa Prefecture                       17

 Introduction status of renewable energy Facilities                  18

 Efforts to expand the introduction of renewable energies            19~21

 Efforts to base on TCFD Recommendations                             22
Management Reference Materials - May 2021 The Okinawa Electric Power Company, Inc.
Characteristics of the Business Bases

                                                                                                                         Reference
     Item                                                       Overview
                                                                                                                           Page
                   Increasing demand for energy due to population growth.
  Demand for       As the proportion of energy for consumer use is high, effects of economic fluctuations are low for
                                                                                                                            2~7
    Energy          demand for Electric power.
                   Potential demand due to large-scale urban development projects

                   OEPC is outside the framework of wide-area power interchange because it has an isolated
                    system.
  Competition      OEPC has voluntarily released power of 10,000kW supplied by J-Power.                                     8
                   Competition is advancing due to the entry of energy suppliers.
                   Power producer and supplier is currently implementing plans to construct power plants.

  Total Energy     Started selling gas with the introduction of LNG.
                                                                                                                           9~10
    Services       Developing Total Energy Services by taking advantage of our ability to sell electricity and gas.

                   A high reserve supply capacity is required due to an isolated system.
 Electric Power
                   Reliant on fossil fuels only due to difficulties to develop nuclear or hydraulic power generation.
  Generation                                                                                                              11~13
    Facilities     Coal-fired thermal power generation is indispensable not only for stable supply but also for
                    maintaining electricity rates.

                   OEPC supplies power to 11 isolated systems including those in the main island.
Remote Islands     The region has a high cost structure because it has small islands and also because the scale of          14
                    the economy is small. This leads to constant loss recording.

                   Currently, possible measures are limited due to reasons including the region’s geographic
                    characteristics and constraints on the scale of demand.
 Global Warming    The introduction of renewable energies contributes to reducing fuel consumption and cost on
                                                                                                                          15~22
Countermeasures     remote islands, where fuel unit price is high.
                   Since the systems of Okinawa area are small and independent, the limit of connection volume is
                    likely to occur when using renewable energies.

                                                                                                                                     1
Management Reference Materials - May 2021 The Okinawa Electric Power Company, Inc.
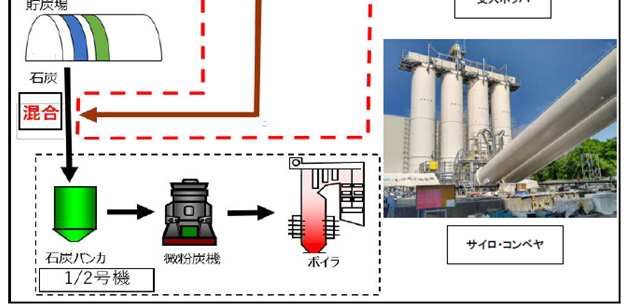
Okinawa Prefecture Demographics(1/2)

      While the national population has started decreasing , the population in Okinawa is expected to
       increase until around 2030. *
      Demand for lighting is expected to increase as the population and number of households increases in
       the future.
    * According to the National Institute of Population and Social Security Research, "Regional Population Projections for Japan: 2015–2045 (2018)

    Population              Trend of Population and Households             Households              Population                         Trend of Population
(Thousand People)                       in Okinawa                         (Thousand)          (Thousand People)                     (Excluding Okinawa)

               Population                                                                                   Population

               Households

                                                                                    (FY)                                                                                              (FY)

 Source:
 Population: The actual figures are based on the data provided by the Ministry of Internal            Source: The actual figures are based on the data provided by MIC.
             Affairs and Communications (MIC), and the Okinawa Prefecture Government.                         The figures for FY2030 are based on estimated data provided by OCCTO.
 .           The figures for FY2030 are based on estimated data provided by the Organization
             for Cross-regional Coordination of Transmission Operators, JAPAN (OCCTO).
 No. of households: The figures are based on the data provided by the Okinawa Prefecture
                     Government.

                                                                                                                                                                                      2
Management Reference Materials - May 2021 The Okinawa Electric Power Company, Inc.
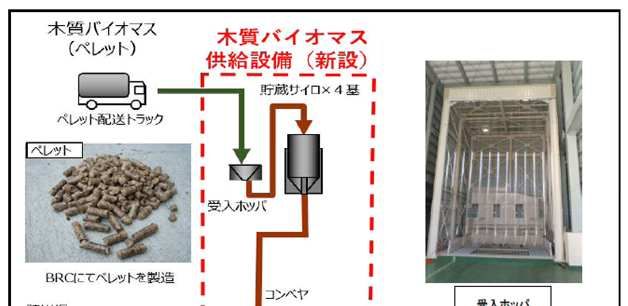
Okinawa Prefecture Demographics(2/2)

 The total fertility rate of Okinawa Prefecture in FY2019 was 1.82, the highest among all prefectures in
  Japan (nationwide:1.36)
 While the number of the national population in FY2020 decreased by -3.7 persons per 1,000 people,
  that of Okinawa increased by 3.2 people.

Okinawa Prefecture Demographics                                                                                                                                           (People)

                                                                                     2016               2017                 2018                 2019                 2020
                                                            Nationwide                     1.44               1.43                 1.42                 1.36                     -
            The total fertility rate
                                                              Okinawa                      1.95               1.94                 1.89                 1.82                     -
           (Per Thousand people)
                                                              Ranking                        (1)                (1)                   (1)                  (1)                   -
                                                            Nationwide                      -1.3               -1.8                 -2.1                 -2.2                 -3.7
         The Increase of population
                                                              Okinawa                        4.0                2.6                  3.1                  3.9                  3.2
          (Per Thousand people)
                                                              Ranking                        (2)                (3)                   (2)                  (2)                   -
                                                            Nationwide                      -2.3               -3.0                 -3.4                 -3.8                 -4.0
   The Natural Increase of population
                                                              Okinawa                        3.8                2.9                  2.6                  2.0                  1.8
        (Per Thousand people)
                                                              Ranking                        (1)                (1)                   (1)                  (1)                   -
                                                            Nationwide                       1.1                1.2                  1.3                  1.7                  0.3
    The Social Increase of population
                                                              Okinawa                        0.2               -0.3                  0.5                  1.9                  1.4
         (Per Thousand people)
                                                              Ranking                       (11)              (17)                  (11)                   (8)                   -
Source: ”Vital Statistics” by Ministry of Health, Labour and Welfare                                   The figures in brackets in the chart show Okinawa Prefecture's national ranking
        ”Population Estimates” by Statistics Bureau, Ministry of Internal Affairs and Communications
        ”Population Estimates” by Okinawa Prefectural Government
         Figures for FY2020 are our own calculations based on published figures.
                                                                                                                                                                                         3
Management Reference Materials - May 2021 The Okinawa Electric Power Company, Inc.
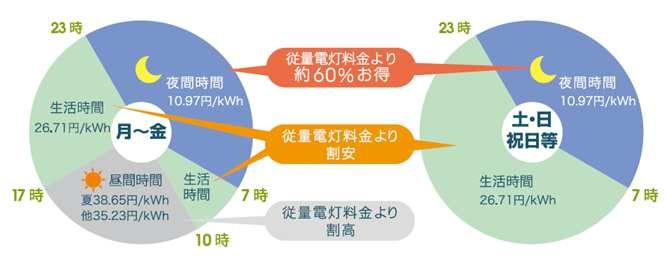
Number of incoming tourists(1/3)

       In FY 2020, the number of incoming tourists was 2.58 million, it fell sharply from the previous year
        due to the spread of the novel coronavirus.
         [Incoming tourists]
          FY2019 : 9,470 thousand people (Growth rate of -5.3% year-on-year)
          FY2020 : 2,580 thousand people (Growth rate of -72.7% year-on-year)

                            Trends of the Numbers of Incoming Tourists and Guest Rooms at Accommodation Facilities

(10 thousand people)                                                                                                                              (rooms)

                                                                                                                                                  (FY)
                Note: The breakdown and total values do not match sometimes due to rounding decimals.
                Source: “Tourism Guidebook”, “Summary Statistics on Incoming Tourists to Okinawa”, “2019 Accommodations Fact-finding Survey Result”,
                        published by Okinawa Prefectural Government                                                                                         4
Management Reference Materials - May 2021 The Okinawa Electric Power Company, Inc.
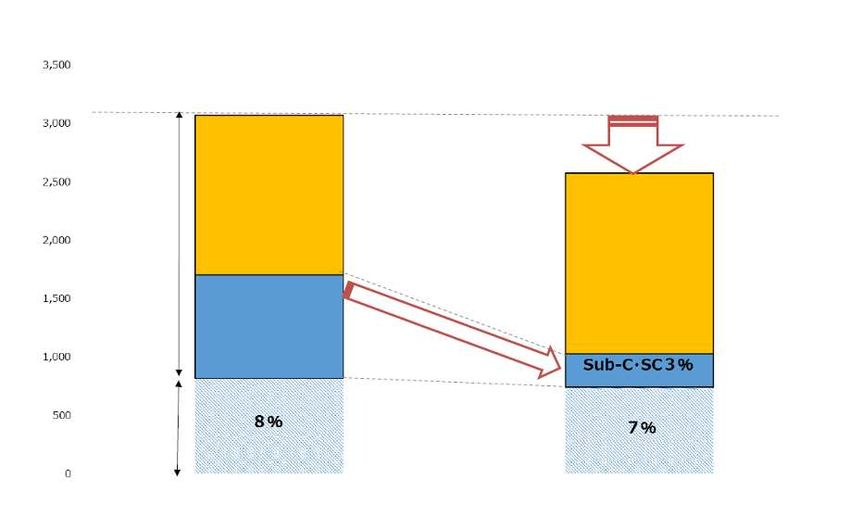
Number of incoming tourists(2/3)

     Due to the impact of the spread of the novel coronavirus, the situation has been severe since February
      2020.

(10 thousand people)                Monthly trend of the number of incoming tourist
                                                                                                      FY2017                      FY2018

                                                                                                      FY2019                      FY2020

                                                                                                  Declaration of State of Emergency
                                                Declaration of State of Emergency                 (Issued by Okinawa Prefecture)
                                                (Issued by Okinawa Prefecture)                      Jan 19th, 2021 – Feb 28th, 2021
                                                   Jul 31st, 2020 – Sep 5th, 2020
            Declaration of State of Emergency
             (Issued by the government)
              Apr 16th, 2020 – May 14th, 2020

            Apr           May            Jun    Jul           Aug           Sep     Oct   Nov        Dec            Jan           Feb      Mar

        Source: “Tourism Guidebook” and “Summary Statistics on Incoming Tourists to Okinawa” published by Okinawa Prefectural Government

                                                                                                                                                 5
Management Reference Materials - May 2021 The Okinawa Electric Power Company, Inc.
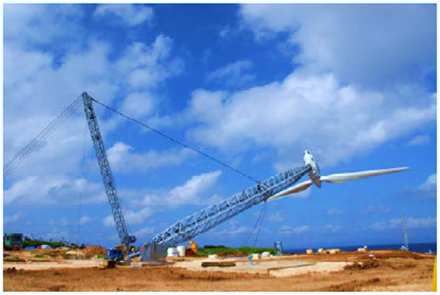
Number of incoming tourists(3/3)

 Although the number of incoming tourists has been decreasing due to the novel coronavirus, the
  numbers of accommodation facilities and guest rooms have kept increasing in Okinawa Prefecture.
 Going forward, multiple accommodation facilities are planned to open.

Major Plans for Opening Accommodations

  Okinawa Main Island                                                           Miyako Island

                                                                               Ishigaki Island

                                                     [Opening Timing]
                                                      ● 2021
                                                      ■ After 2022
                                                      ◆ Pending

   Source: Compiled by OEPC based on newspaper reports, etc. *Planning more than 200 rooms          6
Management Reference Materials - May 2021 The Okinawa Electric Power Company, Inc.
Urban Development of the Returned
                           former U.S. military base sites and Others
     By actively engaging in urban development projects including the returned U.S. military bases and
      supplying energy in the entire area, the Company will achieve the continued expansion of energy sales.

Former Onna Communication Site
development project (Onna-son)
 ○Development area: 60ha
                                                                                     Camp Zukeran
                                                                                        151ha

                                                                    Nishi-futenma residential area
                                                                    Former base site utilization
                                                                    project(Ginowan-shi)
                                                                    ○Development area: 46ha                                                           Okinawa City east coast land
                                                                                                                                                      development project (Okinawa-shi)
                                                                         Futenma Airport                                                               ○Development area: 95ha
                                                                             481ha
                                                Makiminato Service Area
                                                        274ha
        Urasoe west coast development project
        (Urasoe-shi)
         ○Development area: 200ha

                                                                                                                                       Legend:
                                                                                 Large-scale MICE project                                  ︓Swift return
                                                                                 (Yonabaru-cho,Nishihara-cho)                              ︓Return after function transfer within the prefecture
                                                                                  ○Development area: 14ha                                  ︓Return after U.S. Marine Corps is transferred to a foreign location
                                                                                                                                            ︓Use of returned former U.S. military base sites
                                                                                                                                            ︓Urban Development

        * Source: The material of the Okinawa Revitalization Council Chair and Specialized Committee Meeting (third session) presented on the Cabinet Office website, and Survey of
                  Consideration of Ripple Economic Effects from Utilization of Former U.S. Forces Sites posted on the Okinawa Prefectural Government website
                                                                                                                                                                                                          7
Management Reference Materials - May 2021 The Okinawa Electric Power Company, Inc.
Full liberalization of the Electricity Market

     As a voluntary initiative to develop the competitive environment in the Okinawa area, which has an independent system,
      the Company is cutting out part of J-POWER's Ishikawa Coal Thermal Power Station, and offering routinely backing up
      and the wholesale electricity menu for supply-demand adjustment.
     Liberalization is in progress also in the Okinawa area, PPS’s* share in the electricity sales volume reached 8.5% in the
      total of all voltages (as of February 2021).
     In FY 2021, further progress in competition is expected, such as the start of operation of biomass power plants by PPS.
                                                                                                           * new suppliers, officially called power producer and suppliers

                    Usage Status of Switching Support System                                             Trend of PPS’s Share in Electricity Sales Volume
(Number)
                              (Cumulative amount)                                                                         (By voltage)
75,000                                                                                     15.0%
                                                                                  68,600                                                                  High voltage: 12.1%
70,000                                                                                     15.0%
65,000                                                                   58,800
60,000
55,000                                                          51,200                                                                                 High voltage : 12.7%
                                                                                           10.0%
50,000
                                                                                           10.0%
45,000                                                 39,400
                                                    33,400                                                                                               Low voltage : 7.6%
40,000
35,000                                     25,900

30,000                            19,300                                                   5.0%
25,000                                                                                     5.0%                                                            Low voltage: 3.9%
                         12,900
20,000
                      8,400
15,000           5,000
             2,800
10,000
 5,000
            600                                                                                                                                  Extra High
                                                                                                                                                    Extra   voltage
                                                                                                                                                          High       : 2.6%
                                                                                                                                                               voltage: 1.6%
           100                                                                             0.0%
                                                                                           0.0%
     0

           Source : “Usage Status of Switching Support System”.                                    Source : “Electricity Trading Report”.                                    8
Gas supply business

     Commenced gas supply business through subsidiary PEC in 2015.
     The OEPC Group will further promote sales of LNG by supplying LNG based on LNG supply center, capturing demand
      along newly constructed gas pipelines, and collaborating with other energy companies.
Pipeline supply (5 cases)                          Lorry supply (9 cases)                             LNG Supply Center (7 cases)
Supplies gas to customers in the vicinity of       Supplies LNG by tank lorry to customers in         At former U.S. military base site and industrial
the Yoshinoura thermal power plant through         areas where pipelines are difficult to be          parks, PEC*1 constructs supply centers*2 and
gas pipelines after vaporizing and odorizing       developed.                                         supplies gas through pipelines.
liquefied natural gas (LNG).
                                                                                                                                     PEC’s*¹
Yoshinoura                                         Yoshinoura                            Customer’s   Yoshinoura                     Satellite
thermal power Vaporization             Customers   thermal power                         Satellite    thermal power                  Facility            Customers
plant         and adding                           plant                                 Facility     plant
              odor                                                      Tank lorry                                    Tank lorry
                               Gas meter                                                                                                         Gas meter

                                                                                                      *1: Progressive Energy Corp.
                                                                                                      *2: Awase Natural Gas Supply Center,
                                                                                                          Suzaki Natural Gas Supply Center
                                                                   Promote expanding sales                and Makiminato Natural Gas Supply Center
                                                                   other than former general
                                                                   gas utilities                                          Principal customers

                                                                                                         Okinawa Gas Co. (Wholesale)
                                                                                                         TAKUNAN STEEL CO., LTD
                                                                                                         Okinawa Watakyu shingu Co.
                                                                                                         ORION BREWERIES,LTD
                                                                                                         Chubu Tokushukai Hospital
                                                                                                         ITO EN, LTD.
                                                                                                         Hyatt Regency Seragaki Island, Okinawa
                                                                                                         Royal Hotel OKINAWA ZANPAMISAKI
                                                                                                         Musashino Okinawa
                                                                    Forecast               Target        *Customers to whom we supply over 500t of gas per year

                                                                                                                                                                 9
Energy Service Provider (ESP) Business

      We have established a new company called The Reliance Energy Okinawa, Inc., which is an energy
       service provider (ESP) in December 2017.
      We own electric and heat source facilities on behalf of customers, and process and supply energy.

[Increase in new energy demand]                                                           [Advancement and diversification of energy needs]
 •   Large-scale development of urban areas (e.g. former U.S. military bases)               •   Reduce initial investment in energy use (e.g. electricity and gas)
 •   Construction of hotels in response to an increase in the number of tourists            •   Reduce burdens involved in facility operation/maintenance and
 •   Construction of large-scale retail stores                                                  emergency response

         Okinawa                                                                                                                Customer
         Prefecture

                                               The Reliance Energy Okinawa, Inc.,
                       •   It owns energy facilities on behalf of customers.
                       •   It provides electricity and gas in the forms of, for example, air-conditioning water (cold / hot), hot-water supply and steam.

< Examples of businesses adopting ESP>

 SAN-A Urasoe West Coast PARCO CITY                      Lab 4 of the Okinawa Institute of Science and           San-A Nishihara City (Existing renovation)
                Service launch date: June 2019          Technology Graduate University                                            Service launch date: April 2020
                                                                           Service launch date: April 2020

 Yuuaikai Yuuai Medical Center                           San-A Ishikawa City                                     San-A Naha Main Place (Existing renovation)
                  Service launch date: May 2020                       Service launch date: August 2020                          Service launch date: April 2021

                                                                                                                                                                10
Power Generation Facilities
                                     (Power Supply Composition)

 The composition of electric power source is highly reliant on fossil fuel, as developing nuclear or hydroelectric power
  generation is difficult in Okinawa due to the reasons of geographic condition and the small scale of demand. Accordingly,
  fossil fuels; petroleum, coal and LNG, are the only source for the composition.

 We have secured long-term power supply capacity, the improvement of energy security, and effective countermeasures
  for global warming issues by commencing the operation of Yoshinoura Thermal Power Plant(since 2012), our first plant
  using LNG.

                                    Power Supply Composition Ratio

                                                                                                      再エネ・その他
                                                                                                      New Energy, Others

                                                                                                      石油
                                                                                                      Oil

                    (9%)                           (6%)                       (7%)                    LNG
                                                                                                      LNG

                                                                                                      石炭
                                                                                                      Coal

                                                                                          Note 1: The figures include other companies
                                                                                                 (but excluding demand shifted to new power
                                                                                                  suppliers)
                                                                                          Note 2: The figures include both the main land and
                                                                                                  remote islands.
                                                                                          Note 3: The percentage in brackets () for oil refers to
                                                                                                  the percentage for remote islands stated again.

         (Before starting operation of
     Yoshinoura LNG Thermal Power Plant)                                                                                                     11
Response to the Fade-out of Inefficient Coal-fired Thermal
                     Power Generation
  For Okinawa, where thermal power generation has to be the mainstay, coal-fired thermal power generation is indispensable not only
   for stable supply but also for maintaining electricity rates. On the other hand, it is necessary to respond appropriately in light of the
   direction of the national government, such as the 2050 Carbon Neutral Declaration.

< The policy package for the Fade-out of Inefficient Coal-Fired Thermal Power Generation>
① Regulatory measures (Energy Saving Act)                                             ③ Fade-out plan (Annual submission)
   New thermal power indicator (Conceptual diagram)                                                   (Diagram) Outlook of the inefficient coal-fired thermal power
                                                                                                                         generation fade-out
                (New)
                                                                                                                          FY2019 results                                                  FY2030 outlook
                 Coal                        (Current)
              indicator                 Indicators A and B                                                            Total demand: 988.4 billion kWh                              Total demand: 980.0 billion kWh
                                                                                                                      Coal: 306.7 billion kWh (31%)                                Coal: 260.0 billion kWh (26%)
                Coal-fired      Coal-fired    LNG-fired   Oil-fired and other
              thermal power   thermal power thermal power thermal powers
                                                                                                                            USC, IGCC and
                                                                                                                                others

                                                                                               Major electric power
                                                                                                                                 14%
                                                                                                                                                  22,670,000 kW
                                                                                                                             (136.6 billion

                                                                                                   companies
                                                                                                                                                     (30 units)                              USC, IGCC and
   Target level: Power generation efficiency of 43%                                                                              kWh)                                                            others
  * Corrective measures for calculation of power generation efficiency                                                                                                                            16%                              About
     Correction of biomass co-firing, etc.                                                                                                                                                   (160.0 billion                  27,000,000 kW
                                                                                                                               Sub C/SC
                                                                                                                                                                                                  kWh)                           (35 units)
     Correction of ammonia/hydrogen co-firing                                                                                     9%
     Correction of reduction in power generation efficiency due to                                                           (88.4 billion
                                                                                                                                 kWh)             16,100,000 kW                                                                   About
      adjusting operation                                                                                                                            (39 units)                                                               9,000,000 kW
                                                                                                                                                                                            (About 30 billion kWh)

                                                                                                   power generation by
                                                                                           Other

                                                                                                    manufacturers, etc.
                                                                                                    *including in-house
                                                                                       companies
                                                                                                                                                                                                                                (20 units)
② Guidance by the capacity market                                                                                                                 9,140,000 kW                                                                     About
                                                                                                                                                    (80 units)                                                                12,000,000 kW
     ⇒ Not applicable to Okinawa                                                                                            (81.7 billion kWh)
                                                                                                                                                                                            (About 70 billion kWh)               (90 units)

                                                                                *Estimation are based on transmission end power generation.
                                                                                *The remaining SCs and Sub-Cs in FY2030 will be important facilities for stable supply and local employment, for which it is also necessary to take measures
 * "As coal-fired thermal power generation plays a role in supporting           such as reduction of the operating rate and co-firing.

    local employment, the local economy, and the stable supply of                            
    electric power, it is important to continue making efforts while                                                                                                        Power
    listening to the opinions of relevant parties, in light of concerns                                                                            Maximum                                          Start of
                                                                                                            Power station/unit                                            generation
                                                                                                                                                    output                                         operation
    expressed about the impact of its suspension and abolition."                                                                                                           system
                                                                                              Gushikawa                           No. 1 Unit        156,000 kW                                               1994.3
                                                                                            Thermal Power
Source: Interim Report of Coal-fired Power Study WG (April 23, 2021)                            Plant                             No. 2 Unit        156,000 kW                                               1995.3
                                                                                                                                                                              Sub-C
                                                                                               Kin Thermal                        No. 1 Unit        220,000 kW                                               2002.2
                                                                                               Power Plant                        No. 2 Unit        220,000 kW                                               2003.5
                                                                                                                                                                                                                                          12
Demand - Supply balance

      A high generation reserve margin is necessary because of OEPC’s isolated system and the
       responsibility to provide stable supply as a public utility.
      The reserve capacity exceeding of the largest unit is secured so that it is possible to provide stable
       supply even if the largest unit breaks down.

      We would ensure long-term and stable supply.

     Demand-supply balance of maximum electric power (August)                                                                    (Unit : Thousand kW, %)

                                   2020         2021        2022         2023        2024         2025        2026    2027    2028    2029      2030
                                  (Reference)

                Supply capacity     2,072        2,063       2,256        2,290        2,336          2,167   2,288   2,291   2,294   2,295      2,299
Demand-supply

                Peak load           1,501        1,501       1,518        1,537        1,549          1,557   1,565   1,573   1,580   1,588      1,596
   balance

                Reserve supply
                capacity
                                       571         562          738          753         787           610      723     718     714      707       703
                Reserve supply
                rate               38.0%        37.5%       48.6%        49.0%       50.8%        39.2%       46.2%   45.7% 45.2%     44.6%     44.0%

     Note: Based on FY2021 Supply Plan Notification. (general transmission / distribution business)

                                                                                                                                                       13
Remote Islands
                (Efforts to Improve Income and Expenditure)
 The region has a high cost structure because of such reasons as having small islands scattered about a vast sea area
  and the narrow scale of the economy.
 Remote island business occupies about 10% of electricity sales and residential, commercial and industrial use charges.

                                                                       Aguni
                                                           Kume
                                                                                     The main island of Okinawa
                                                                Tonaki                                                            Kitadaito

                                                                                                                                Minamidaito

                                   Tarama
                                              Miyako
        Yonaguni                  Ishigaki
                       Hateruma

  Electricity Sales Volume                         Electricity Sales
      (FY2020 results)                            (FY2020 results)                             (Efforts to improve remote island income and
 (Total : 7,137 million kWh) Remote Islands   (Total : 154.4 billion yen)   Remote Islands     expenditure)
                           690 million kWh                                  16.0 billion yen    Reducing fuel consumption by introducing renewable
                               (9.7%)                                          (10.4%)           energies (Tiltable wind power generators, etc.)
                                                                                                Effective utilization of waste oil
                                                                                                Reducing the fuel consumption rate by introducing
                                                                                                 high-efficiency units
      Main Island                                 Main Island
   6,447 million kWh                            138.4 billion yen
        90.3%                                       89.6%

                                                                                                                                                14
Efforts to Global Warming Countermeasures (1/2)

 Expanding the introduction of renewable energy
                                                                                                  Wood biomass     Wood biomass distribution
    Introduction of Miyako Island Mega Solar Power Demonstration Research Facility                 (pellets)
                                                                                                                        facility (NEW)
    Introduction of Abu Mega Solar Power Demonstration Research Facility                                                        Four storage silos
    Introduction of Ogimi Wind Power Generation Demonstration Research Facility               Pellet delivery truck
    Introduction of tiltable wind power generators and motor power generators               pellets
    Regional micro-grid construction project in Kurima Island, Miyakojima City.
    Free photovoltaic power generation and storage battery installation service "KarE-                                  Receiving
     roof" (PV-TPO business)                                                                                             hopper

                                                                                             Pellet production at BRC
 Initiatives for thermal power generation equipment                                       Coal yard
                                                                                                                                   Conveyor
                                                                                                                                                      Receiving hopper

 Expanded use of LNG
                                                                                           Coal

  Introduction of Yoshinoura Thermal Power Plant (Gradual increase in LNG use)            Mixing

  City gas and satellite supply of LNG fuels (Change of fuels in the industrial sector)
  Deployment of LNG to remote islands (Decision to introduce dual-fuel generators
   that can use heavy oil and LNG)
  Construction of Makiminato Gas Engine Power Plant
                                                                                                                                                        Silo Conveyor
                                                                                              Coal bunker      Coal pulverizer
                                                                                                                                         Boiler
 Expanded use of biomass                                                                       Generator No.1 / 2

                                                                                                            ▲Wood biomass distribution facility
  Implementation of biomass co-firing at Gushikawa Thermal Power Plant
  Construction of a new woody biomass supply facility at Kin Thermal Power Plant
   to expand biomass co-firing                                                               Wood biomass consumption : approx. 30,000 t/year*
                                                                                             CO2 reduction: approx. 40,000 t/year*
   *Reduction of environmental footprint through effective and expanded use of
                                                                                              (*Total of Gushikawa and Kin Thermal Power Plants)
   waste materials from buildings in the prefecture                                          Amount of possible mixed combustion : approx. 3%
  Introduction of the Yoshinoura Multi Gas Turbines (biofuels can be used)                   (weight ratio)

 Operational reinforcement
 Reinforcing the operation of thermal power plants to ensure the system stability of natural variability against the introduction of renewable
  energy
  (Implementation of daily start stop (DSS) and adjustment of load zones, etc. of power plants)
                                                                                                                                                                         15
                                                                                                                                                                         19
Efforts to Global Warming Countermeasures (2/2)
The following results have been achieved through our efforts to date:
      Achievement of peaking out energy-derived CO2 emissions                                                                            No
Amid growing demand for electric power due to economic development in Okinawa, we succeeded in peaking                                revision of
out energy-derived CO2 by expanding the introduction of renewable energy and introducing LNG fuel. The                                 electricity
increased costs were absorbed by corporate efforts.                                                                                     charges
                                 Peaking out of energy-
    [10,000 tons]                    derived CO2                            [million kWh]
                       10,000 tons of CO2                        7,649                      FY2010: Start of biomass co-firing at Gushikawa Thermal Power
        800                                      7,346   7,521           7,316      8,000
                       million kWh                                                                  Plant (coal-fired)
        700                           6,626                                        7,000    FY2012: Introduction of Yoshinoura Thermal Power Plant (LNG-
                          5,854                          704                                        fired)
        600
                                                 689                               6,000    FY2018: Introduction of Hateruma Island tiltable wind turbine
                                       588                       614                                and MG set
        500
               4,725                                                     583       5,000    FY2019: DSS at the Gushikawa Thermal Power Plant (coal-fired)
                           522
                                                                                                    exceeded 100 annually.
        400                                                                        4,000
                                                                                            FY2020: Start of biomass co-firing at Kin Thermal Power Plant
               409
        300                                                                        3,000            (coal-fired)
               1990        1995        2000      2005    2010    2015    2019               FY2021: Start of PV-TPO business
                                                                                [year]

     Achievement of supplying renewable energy 100% (Hateruma Island)*
Combining tiltable wind power generation and a system stabilizer "Motor generator (MG Set)", 100% of the                             100% power
electric power on Hateruma Island was supplied with renewable energy.                                                                supply with
                              Continued for about 10 days(229hours27minutes)                                                       this technology
                                            100% supply
                                            of renewable
                                                energy                                                           Hateruma Island:
                                                                                                                 Located about 24 km south of Iriomote
                                                                                                                 Island in Okinawa Prefecture, it is the
           Hateruma Tiltable Wind                                                                                southernmost inhabited remote island
           Power Plant                                                                                           in Japan.
                                                                                                                 Area: about 13 km2
                                                                                                                 Number of households and population:
                                                                                                                 about 275 households and 514 people
    * Okinawa Electric Power Company was commissioned and implemented the "Project for maximum introduction of renewable energy
      on small remote islands" in Okinawa Prefecture.                                                                                                 16
Partnership Agreement with Okinawa Prefecture

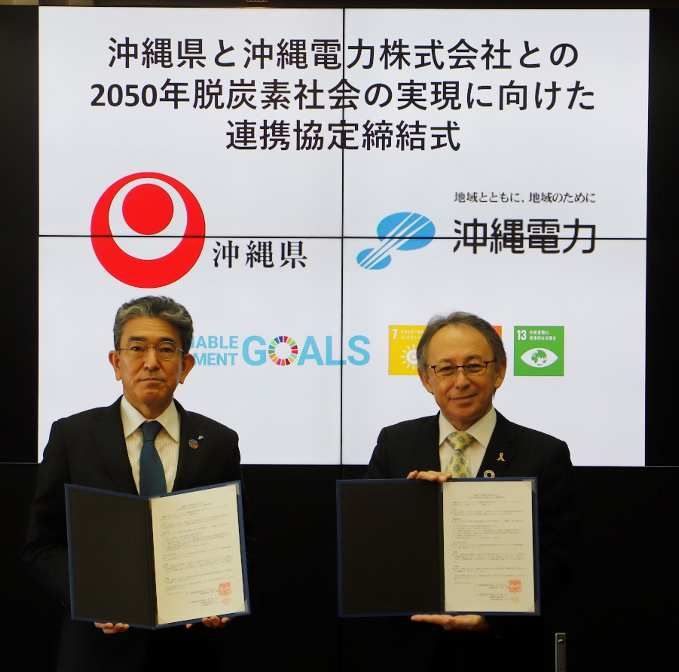
  In December 2020, the "Agreement on Partnership between Okinawa Prefecture and the Okinawa Electric
   Power Company, Incorporated for the Realization of A Decarbonized Society in 2050" was concluded.

 Outline of the Partnership Agreement

Purpose        Under the philosophy of SDGs, Okinawa Prefecture
               and the Company should closely collaborate and
               cooperate for the realization of a sustainable
               decarbonized society in this prefecture by 2050.

Matters for collaboration
(1) Matters concerning the securing of stable and appropriate
    supply of electricity
(2) Matters concerning the expansion of the introduction of
    renewable energy
(3) Matters concerning the promotion of conversion to power
    generation that does not emit CO2 or emits less
(4) Matters concerning the promotion of the recovery and
    utilization of CO2 emitted from coal-fired power plants, etc.
(5) Matters concerning the promotion of electrification of
                                                                                Ceremony to conclude a partnership agreement with the prefecture
    transportation, etc.                                                                  (At Okinawa Prefectural Government Office)

<Reference> Okinawa Clean Energy Initiative 〜For the Realization of A Decarbonized Society in 2050〜
           https://www.pref.okinawa.jp/site/shoko/seisaku/kiban/initiative/okinawacleanenergyinitiative.html
                                                                                                                                                   17
Introduction status of renewable energy Facilities

        The OEPC Group has introduced various forms of renewable energy such as wind power, solar power,
         biomass, and small hydroelectric power, maintaining and operating facilities for 27,928 kW in total.
【 OEPC 】                                                                      【 OEPC 】
                           Name                  No. of   Output     Remark                              Name                 No. of    Output     Remark
                                                 Units                                                                        Units
               Ogimi Wind Power                      2    4,000 kW                          Mix combustion of coal and wood
                                                                                            biomass (at Gushikawa Thermal         2           ―      *3
               Yonaguni Wind Power                   1     600 kW                           Power Plant)
 Wind Power

               Aguni Tiltable Wind Power             1     245 kW      *1                   Mix combustion of coal and wood

                                                                               Others
                                                                                            biomass (at Kin Thermal Power         2           ―      *4
               Minamidaito Tiltable Wind Power       2     490 kW      *1                   Plant)

               Tarama Tiltable Wind Power            2     490 kW      *1                   Miyako Small Hydroelectric
                                                                                                                                  1       60 kW
                                                                                            Power
               Hateruma Tiltable Wind Power          2     490 kW      *1
                                                                                                    subtotal(3)                   5       60 kW
                      subtotal(6 )                  10    6,315 kW
                                                                              【 Group company 】
               Abu Mega Solar Power                 ―     1,000 kW
               Kitadaito Daini Solar Power          ―       100 kW     *2                                 Name                No. of    Output     Remark
                                                                                                                              Units
               Miyako Mega Solar Power              ―     4,000 kW     *2
 Solar Power

               Miyako Branch Solar Power            ―        10 kW                          Sosu Wind Power                        2    3,600 kW
               Tarama Solar Power                   ―       250 kW     *2                   Nakijin Wind Power                     1    1,995 kW
               Yaeyama Branch Solar Power           ―        10 kW                          Gushikawa Wind Power                   1    1,950 kW

                                                                               Wind Power
               Hateruma Solar Power                 ―        10 kW                          Sashiki Wind Power                     2    1,980 kW
               Yonaguni Solar Power                 ―       150 kW     *2                   Iejima wind Power                      2    1,200 kW
                      subtotal(8)                   ―     5,530 kW                          Iejima Daini wind Power                2    1,490 kW
                                                                                            Karimata Wind Power                    2    1,800 kW
 (As of March 31, 2021)
*1 Tiltable Wind Power                                                                      Sadefune Wind Power                    2    1,800 kW
*2 Micro grid (a combination of system stabilizing technologies such as                             subtotal(8)                  14    15,815 kW
   storage batteries)
*3 Mix combustion of coal and wood biomass (The total output of the                         Iejima Solar Power                    ―       10 kW
                                                                              Power
                                                                              Solar

   Gushikawa Thermal Power Plant is 312 thousand kW).                                       Tokashiki Solar Power                 ―      198 kW
*4 Mix combustion of coal and wood biomass (The total output of the                                 subtotal(2)                   ―      208 kW
   Kin Thermal Power Plant is 440 thousand kW).                                                                                                             18
Challenges for the introduction of renewable energies(1/3)

  1          Wind power generation

 With wind turbines becoming larger in order to reduce
  costs through economies of scale, the capacity of the
  mainstream wind power generation equipment these
  days is 3,000 kW.
                                                                                                                     Reference wind speed
 Examination criteria tightened for construction of wind                                                            across Japan
  power generation facilities more than 500kW in Japan                                                               Reference wind speed Vo
                                                                                                                     (m/sec)
  (2016).
 "Extreme wind speed"* ,which is the construction
  standards in Okinawa, is "90 m/s".
 At present, we have not been able to identify any wind
  turbine manufacturers around the world is producing wind
  power generation facilities more than 500kW that meet
  these standards. As a result, it is practically impossible to
  introduce new ones.
 The Company is considering measures to expand the
  introduction of wind power generation.

* Extreme wind speed
  Extreme mean wind speed that may be experienced in the next 50 years
                                                                         [Design reference wind speed distribution]
                                                                          *Image of "Building Standards Act Notice No.1454" categories
Extreme wind speed (90 m/s)
= Reference wind speed (46 m/s) × a × b × c
                                                                          Source: Japan Exterior Industry Association website
 a: Coefficient corresponding to the terrain
 b: Coefficient corresponding to the hub height, etc.
 c: Coefficient corresponding to the maximum instantaneous wind speed
                                                                                                                                               19
Challenges for the introduction of renewable energies(2/3)

2       Solar power generation

 The amount of solar PV generation interconnection in the Okinawa area has increased rapidly since
  the implementation of the feed-in tariff scheme (FIT scheme) in July 2012.
 With the revision of the "Regulation for Enforcement of the Act on Special Measures Concerning
  Procurement of Electricity from Renewable Energy Sources by Electricity Utilities", all solar power
  generation and wind power generation facilities connected after April 1, 2021 will be subject to
  unrestricted and uncompensated output control.

                  [Connection of renewable energies(As of March 31, 2021)]
                                                                                                      (MW)

                                                Amount              Connection
                                                already             application               Total
                                               connected             amount
              Main island of Okinawa               362                   144                   505
                               Miyako               31                     9                   41
               Remort         Ishigaki              22                     6                   28
                island
                               Kume                  3                     0                    3
                                         *The figures may not exactly match the figures because of rounding.

                                                                                                               20
Challenges for the introduction of renewable energies(3/3)

3       Supply and demand situation

 Due to expanded introduction of renewable energies, the lower operating limit of thermal power
  generation which is necessary for a stable supply is approaching.
 There is an increasing possibility of controlling the output of renewable energies in order to maintain
  the balance between supply and demand.

    Supply and demand situation         ①Area demand                                                       Renewable
              752,000 kW                                                        energy output

                                                ②Solar PV
                                                249,000 kW

                                                                        25,000 kW to the lower operating
                                                                        limit of thermal power generation
                                      ③Thermal power output       Lower limit of thermal power generation
                                                503,000 kW        478,000 kW

                                                                  *The lower operating limit of thermal power generation
                                                                   may vary depending on the parallel generator.

    0   1   2   3   4   5   6     7    8   9 10 11 12 13 14 15 16 17 18 19 20 21 22 23 (Time)
                                                                                                                           21
Q6. Efforts to base on TCFD Recommendations

   In September 2019, Expressing to support the Recommendations adopted by the Task Force on
    Climate-related Financial Disclosures(TCFD).
   At the same time, deciding to participate in TCFD consortium.

     The Company has been tackling with the issue of global warming and with the reduction of environmental load based
      on the “Okiden Group‘s Policy on the Environment”.
     In recognition of the fact that our business activities are significantly related to the issue of global environment, the
      Company agrees with the purpose of the TCFD recommendations, which is “analyzing the risks and opportunities
      related to climate change that affect business and promoting climate-related financial disclosures”.
     At present, the Company is considering about "Governance" and "Risks and Opportunities“ on the TCFD
      recommendations. The Company plans to disclose them on Integrated Report* in 2021.
     Also, Scenario analysis will be progressively disclosed by 2022.
     The Company will continue to enhance information disclosure on climate change, improve corporate value, and
      contribute to the realization of sustainable society.
      * Through CSR reports and environmental action reports, we have been endeavoring to disclose information on environmental,
       social and governance initiatives(ESG).
       After 2021, the Company will effort to disclose information more easy to understand such as by shifting to Integrated Report.

       TCFD︓Task Force on Climate-related Financial Disclosures
            This task force was established by the Financial Stability Board (FSB), which is an international agency that has central
            banks, financial regulatory authorities and other organizations from major countries as members. In June 2017, a proposal
            was published regarding the ideal disclosure of information on climate-related risks and opportunities by companies.
       TCFD Consortium ︓
              TCFD Consortium consists of companies and financial institutions supporting TCFD recommendations, where these
              organizations work together through discussing a path to effective disclosure by companies and adequate utilization of
              disclosed information in investment decisions by financial institutions. Established on May 27, 2019                      22
Q&A
Q1. Topics of Okinawa’s Economy

   1         Current Status and Future Forecast of Okinawa's Economy

 The current state
  Recently, there are staying to be more difficult in the prefectural economy by the impacts of the novel coronavirus.
Trends in Main Economic Indicators of Okinawa Prefecture                                                                                          (Unit: %, X)
                                                                                          FY2020
          Indicators
                                  Apr.      May       Jun       Jul     Aug.      Sep.     Oct.      Nov.     Dec.      Jan.     Feb.      Mar.        FY
    Sales by large-scale
                                 -16.1       -6.9      2.5      -2.7     -8.1    -11.8       0.8       0.8     -0.3     -1.4      -0.6            -    -4.0
          retailers

   No. of new car sold           -39.3     -54.0    -32.7     -18.7    -14.9     -11.4      23.1       3.3     -0.2       4.9   -15.6        1.0      -16.0

 No. of incoming tourists -90.9            -94.7    -83.4     -71.2    -80.1     -71.9    -59.9     -52.3    -56.8     -80.2    -79.9     -24.5       -72.7

  Value of public works
                                   37.2      -9.5     44.5    -14.1       0.3       0.7      0.7    -12.0    -21.9        7.9      5.8      -4.5       -0.1
        contracts
     New residential
                                   -2.1     44.1    -44.2     -36.9    -41.0     -63.4    -20.9     -23.7    -35.4      19.1    -15.0     -33.2       -27.4
   Construction starts
  Total unemployment
                                    3.4       3.4      3.6       3.2      3.5       3.7      4.0       3.0      3.4       3.6      3.7       4.4        3.6
           rate

     Job Opening Ratio             0.91     0.78      0.68     0.67      0.67     0.64      0.66     0.71      0.72     0.71      0.69     0.69       0.72

 Note 1: The figures for ‘Sales by large-scale retailers’ are calculated on an all-store base. The values in February 2021 are preliminary figures.
         The values for the fiscal year are the total figures from April 2020 to February 2021.
 Note 2: The figures for ‘Total unemployment rates’ are raw data, whereas The figures for ‘Job Opening Ratio’ are a seasonally adjusted value for the current month.
         ( The values for the fiscal year are both raw data which use the number of job openings by prefecture. )
 Source: Okinawa General Bureau, Okinawa Prefecture, Ryugin Research Institute, and others.

 Prospect
  The prefectural economy is expected to continue to be affected by the novel coronavirus.
                                                                                                                                                                       23
Q1. Topics of Okinawa’s Economy

  2         Economic Growth of Okinawa Prefecture under the Okinawa Promotion Plan

  With implementation of a variety of action plans under the Okinawa Prefectural government’s “Basic Plan of Okinawa 21st
   Century Vision (Okinawa Promotion Plan)” which started in FY2012, the prefecture’s GDP posted growth rate increase of
   outpacing the national average growth rate.
  Recently, the prefectural economy continue to be affected by the novel coronavirus, but the demand for electricity is
   expected to increase in the medium to long term because it's expected to grow the prefectural economy.

Prefectural GDP and National GDP
                                                                                                                                                (billion yen)

                                 FY2014                FY2015                FY2016                FY2017                FY2018                FY2019

          Prefectural                 -0.4%                  5.4%                  3.2%                  1.5%                  2.0%                   0.1%
             GDP                     3,861.2               4,071.0               4,203.2               4,266.4               4,351.4               4,354.0
            National                  -0.4%                  1.7%                  0.8%                  1.8%                  0.3%                  -0.3%
             GDP                   530,191.6             539,409.3             543,462.5             553,171.1             554,749.1             552,921.5
Sources: “Prefectural Accounts for FY2017”, “Prefectural economic outlook for FY2019” and Cabinet Office “List of Statistical Tables” (Second Preliminary Data for the
          October-to-December 2020 period)
Note   : Prefectural GDP's for FY2018 and FY2019 are estimates. Figures in the upper row are growth rates on a Y to Y basis.

Basic Plan of Okinawa 21st Century Vision (Okinawa Promotion Plan)
 In May 2012, the “Basic Plan of Okinawa 21st Century Vision (Okinawa Promotion Plan)” was formulated under the initiative by the Okinawa Prefectural
 government (revised in May 2017).
 Through the implementation of various measures that are developed based on this plan to take advantage of regional characteristics of Okinawa
 Prefecture, gross production in Okinawa(nominal)in FY2021 is estimated to increase about 1.4 times compared with that in FY2010 to 5,100 billion yen.
 As the plan is scheduled to expire in FY2021, the national and prefectural governments conducted a comprehensive inspection of the implementation
 status in March 2020, and are currently making efforts to formulate the next promotion plan.
                                                                                                                                                                         24
Q2. What is the Current State of U.S. Military Bases?

  Outline of the U.S. military Forces
  in Okinawa                                            Principal electricity supply destination facilities *1
                                                                                                                                        *2
    No. of Facilities                     33                                    Name                                       Location                         Area
                                                        Camp Gonsalves                 [ US Marine Corps ]   Kunigamison, Higashison                       36,590k㎡
    Area                          186,973km2            Okuma Rest Center              [ US Air Forces ]     Kunigamison                                      546k㎡
                                             Iejima Auxiliary Air Base      [ US Marine Corps ]   Ieson                                          8,015k㎡
  No. of employees working for the U.S.                 Yaedake Communication Site     [ US Air Forces ]     Motobucho, Nago-shi                               37k㎡
  Armed Forces in Okinawa: 8,957                        Camp Schwab                    [ US Marine Corps ]   Nago-shi, Ginozason                           20,626k㎡
  *As of the end of March 2020.
                                                        Camp Hansen                    [ US Marine Corps ]   Nago-shi, Ginozason, Onnason, Kincho          48,728k㎡
  Sources ︓ Japan Ministry of Defense “US Forces and
                                                                                                             Onnason, Uruma-shi, Okinawa-shi, Kadenacho,
  SDF Bases in Okinawa March 2021”, Military Base       Kadena Ammunitions Storage Area[ shared use ]
                                                                                                             Yomitanson                                    26,584k㎡
  Affairs Division, Executive Office of the Governor,
  Okinawa Prefecture                                    Camp Courtney                  [ US Marine Corps ]   Uruma-shi                                      1,339k㎡
  The U.S. Armed Forces’ share of total                 Camp Mc Tureous                [ shared use ]        Uruma-shi                                        379k㎡
  electricity demand(FY2020)                            Camp Shields                   [ shared use ]        Okinawa-shi                                      700k㎡
                    Total Demand︓                       Torii Station                  [ US Army ]           Yomitanson                                     1,895k㎡
                  7,317 million kWh                     Kadena Airbase                 [ US Air Forces ]     Okinawa-shi, Kadenacho, Chatancho, Naha-shi   19,855k㎡
                                                        White Beach Naval Facility     [ shared use ]        Uruma-shi                                      1,568k㎡
                                                        Camp Kuwae                     [ US Marine Corps ]   Chatancho                                        675k㎡
                                                                                                             Uruma-shi, Okinawa-shi, Kitanakagusukuson,
                                                        Camp Zukeran                   [ US Marine Corps ]
                                                                                                             Chatancho, Ginowan-shi                        5,341k㎡
                                                        Futenma Airport                [ US Marine Corps ]   Ginowan-shi                                   4,759k㎡      *3

   Facilities Expected to
                                                        Makiminato Service Areas       [ US Marine Corps ]   Urasoe-shi                                    2,676k㎡
                                    Total Demand of
        be Returned                   U.S. Armed        Naha port facilities           [ US Army ]           Naha-shi                                        559k㎡
           1 - 3%*                       Forces          *1 Professional use and large-demand customers
    of the total demand              (approx. 9%)        *2 Areas where facilities exist on a cross-area basis
    * Range in figures due to planned                    *3 Facilities south of Kadenacho are scheduled to be returned (Partial return applies to Camp Zukeran )
      return of facilities includes partial return.

                                                                                                                                                                   25
Q3. What is the Current State of Promotion of Electrification?

  Approach for the promotion and growth in the household sector
  (1) Starting to offer the "Rikka Denka Lease“, a new lease service plan of the electrical appliance.
  (2) Strengthening cooperation with local home appliance stores and housing equipment manufacturers.
  (3) Expanding sale channels further.
  (4) Implementing a campaign to give a gift of Amazon Prime.

  Approach for sales promotion in the corporate sector
  (1) Offering customers comprehensive proposals for electrification (air-conditioning systems, kitchens,
      and water heaters) appropriate for their power usage.
  (2) Strengthening of cooperation with sub-users including manufacturers, contractors, design offices, etc.
  (3) Utilization of public subsidy system, etc.

                                                                                     Trends of the Total Number and Penetration
                   Acquired demand and target                             (Houses)
                                                                                      Rate of All-Electric Houses in main island
                                                                                                                                   (%)
  (GWh)
400                                                                       50,000                                                    9.0
                                                               (Target)
                                                                330
                                                                                                        7.7               7.8
300                                                                       45,000                                                    8.0
                                                                                      7.5
                                                  (Forecast)
                                                                                                                         44,003
                                                    198                                               42,516
200                                      164                              40,000                                                    7.0
                                                                                     40,918
                                140
                        89
100                                                                       35,000                                                    6.0
                 53                      155
          22                           (Target)
  0                                                                       30,000                                                    5.0
          2016   2017   2018    2019     2020       2021        2025                 2018              2019               2020
                                                                                                                                   26
Q4. What is the enrichment of electricity rate menus?
 The electricity rate menu for all electrification
 ◆Ee Home Holiday                                                                                                              ◆Ee Home Flat
 Suitable for double-income households who use less                                                                            Suitable for households of full-time housewives and senior
 electricity on weekdays.                                                                                                      citizens who use more electricity during the daytime on
                                                                                                                               weekdays.
    23:00                                                                         23:00                                                 23:00
                                                       Approx. 60% savings
                                  Night time
                                        time           than meter-rate lighting                            Night time
                                  Night                                                                                                                         Night time
                                  11.18 yen/kwh                                                            11.18 yen/kwh
    Living time                                                                                                                                                 11.18 yen/kwh
                                                                                                Sat,Sun,                                                                                 Approx. 60% savings than
   27.20 yen/kwh
                     Mon to Fri
                                                                                                national                                                All                              meter-rate lighting
                                                       Lower than meter-rate                    holidays
                                                                                                                                                       days
                                                                                                  etc.
                                                       lighting

                   Daytime           Living
                                                                                          Living time
                                                                                                                                                Daytime
17:00     Summer   39.37 yen/kwh
                                      time      7:00                                      27.20 yen/kwh                 7:00                    29.15 yen/kwh                   7:00
          Others   35.88 yen/kwh                       Higher than meter-rate
                                                       lighting
                                      10:00

  Good Value Plan                                                                          au Denki                                                  Meter-rate lighting plus
The plan that is more advantageous than meter-
rate lighting by setting the unit price to be the same
as meter-rate lighting or cheaper.              1.13 yen/kWh
                                                                       lower
                                                                  than meter-rate
                                                                      lighting
                                             0.48 yen/kWh
                                           lower than meter-                                                                                                                                           Unit
                                                                                                                                                                                                                  Unit price
  Minimum                                                                                     This is a service for customers using au.                                                                            (yen)
    charge                         First-tier rate lighting                                                                                         Minimum
                                                                                                                                                                Up to the first 10 kWh             One contract     402.40
   402.40                            rate                                                     OEPC supplies electricity as before.                  charge
                                    22.95                     Third-tier                                                                                        Over 10 kWh up to 120 kWh             1kWh          22.95
  yen/month
                                   yen/kWh       Second-tier Rate 29.34                       The electricity tariff is equivalent to the           Electric
                                                                                                                                                                Over 120 kWh up to 300 kWh            1kWh          28.49
                                                    rate 28.01         yen/kWh                 electricity tariff charged at the meter-rate          charge
                                                     yen/kWh                                                                                                    For portions over 300 kWh             1kWh          30.47
                                                                                               lighting plan by OEPC.
                                                                                                                                                   The menu that is an economical to be able to earn
                          10kWh                120kWh           300kWh
                                                                                              The au WALLET points corresponding to               more points at the same charge as meter-rate
                                               Electricity charges                             up to 5% of electricity tariff are returned.        lighting.
                                                                                                                                                                                                                      27
Q5. What are the efforts to fuel cost reduction?(1/2)

■ Efforts toward stable procurement of fuels and
  reduction of fuel costs.
                                                                            ($/bbl)                             Trend in原油通関CIF価格の推移
                                                                                                                         the CIF Customs Cleared Price of Oil
                                                                            120.00

 Making Ishikawa Thermal Power Plant the base of distributing fuel oil      100.00
                                                                                           FY2018 Average
                                                                                           Price 72.14$/bbl
                                                                                                                          FY2019 Average                           FY2020 Average
                                                                                                                          Price 67.77$/bbl                         Price 43.35$/bbl
 to remote islands
                                                                             80.00

                                                                             60.00

 Reduction of fuel costs through measures including purchasing               40.00
 fuel oil on the spot market
                                                                             20.00
                                                                                  2018.4 2018.7 2018.10 2019.1 2019.4 2019.7 2019.10 2020.1 2020.4 2020.7 2020.10 2020.11 2020.12 2021.1 2021.2 2021.3

                                                                             ($/t)                              Trend in石炭通関CIF価格の推移
                                                                                                                         the CIF Customs Cleared Price of Coal
 Stable procurement through long-term coal purchase contracts                140.00

                                                                             120.00                                                                               FY2020 Average
                                                                                                                                                                   Price 79.10$/t

 Continued use of sub-bituminous coals that are low in not only prices       100.00
                                                                                           FY2018 Average
 but also transport costs                                                     80.00
                                                                                           Price 120.54$/t
                                                                                                                        FY2019 Average
                                                                                                                        Price 101.28$/t
                                                                              60.00
                                                                                   2018.4 2018.7 2018.10 2019.1 2019.4 2019.7 2019.10 2020.1 2020.4 2020.7 2020.10 2020.11 2020.12 2021.1 2021.2 2021.3

 Stable procurement through long-term LNG purchase contracts
                                                                              ($/t)                             Trend inLNG通関CIF価格の推移
                                                                                                                         the CIF Customs Cleared Price of LNG
                                                                             700.00
                                                                                                                                                                  FY2020 Average
                                                                                                                                                                  Price 389.69$/t
                                                                             600.00
 Efficient operation of coal-fired plants by reducing consumption of fuel
 oil and LNG                                                                 500.00

                                                                             400.00
                                                                                            FY2018 Average
                                                                             300.00         Price 545.69$/t              FY2019 Average
                                                                                                                         Price 492.54$/t
                                                                             200.00
                                                                                   2018.4 2018.7 2018.10 2019.1 2019.4 2019.7 2019.10 2020.1 2020.4 2020.7 2020.10 2020.11 2020.12 2021.1 2021.2 2021.3
  Achieving stable fuel supply and pursuing cost reductions

                                                                                                                                                                                             28
Q5. What are the efforts to fuel cost reduction?(2/2)

      Efficient operation of coal-fired plants by reducing consumption of fuel oil and LNG.
                                                                                                     * AFC=Automatic Frequency Control
    ○ Reduction of oil consumption by shifting AFC* that oil-fired plants took charge of to LNG-fired plants.
    ○ A shift to coal-fired plants that have much lower power unit costs by reducing the volume of LNG.

(10,000 kl)   Trend in Fuel Oil Consumption by Main Island           (10,000 t)       Trend in LNG Purchase Volumes

                    Reduction of fuel oil in the main island by a
                    shift from oil to LNG through measures                           After FY2017, LNG purchase volume will be about 240,000
                                                                                     to 270,000 tons a year for a certain period of time.
                    including AFC operation by LNG plants.

                                                                    (FY)                                                                       (FY)

                                                                                                                                               29
Q6. The Fuel Cost Adjustment System
      The fuel cost adjustment system was introduced for the purpose of clarifying the “internal factors” such as the results of
       efforts to promote management efficiency at electric power companies and reflecting “external factors” onto electricity
       rates such as exchange rates and oil and coal and LNG prices that alter the economic situation.

  [ Range of fuel cost adjustment ]                                          [ Conceptual drawing of the fuel cost adjustment system ]
                                                                           E.g. The average fuel price during the period between December and February of the
  ○We will calculate the average fuel price based on the prices                 following year will be applied to fuel cost adjustment for the electricity charge for
     of crude oil, coal and LNG on the trade statistics during the              May in the following year.
                                                                                The average fuel price during the period between January and March will be
     period between five months and three months prior to the                   applied to fuel cost adjustment for the electricity charge for June in the same year.
     fuel cost adjustment, and electricity charge will be                                                 3-month average fuel price      2-month time-lag
     automatically adjusted each month by comparing the above                                     Nov.       Dec.       Jan.      Feb.     Mar.     Apr.     May      Jun.

     price with the standard fuel price at the time of electricity
     rate revision.                                                              Fuel price                                                Official announcement of trade
  ○The maximum level of fuel cost adjustment will be 50%.
  ○There will be no lower adjustment limit.
                                                                                 Fuel cost adjustment                                    Fuel cost will be adjusted each month.
 [ Trend of Average Fuel Price and Standard Fuel Price
                                            (Since July 2006) ]
                                                                                 * Electricity charge for May will be applied to the electricity use starting as early as April 1.
         (Yen/kl)
40,000
                        38,000                                                                Jul. 2006                Sep. 2008                    Standard Fuel Price
                                                                                              Revision              Revision (present)
35,000
                                                        Standard Fuel Price (Yen/kl)           18,700                    25,100                     Average Fuel Price

30,000

25,000

20,000                                                                                                                                                                 19,200

15,000
                      * September 2008 Revision   * From May 2009, the fuel cost adjusted unit price was revised each month
10,000

                                                                                                                                                                             30
Q7. What is the approval that it's possible to engage in
    electricity transmission and distribution on concurrent?
   After April 2020 when the amended Electricity Business Act comes into effect, the general electricity transmission and
    distribution utilities must not engage in electricity retail or electricity generation on concurrent business. (Restrictions on
    Concurrent Business)
   As an exception to the restriction on Concurrent Business, OEPC became the “the approved general electricity
    transmission and distribution utility” which can operate power retail business and power generation business, and this
    means that OEPC can continue maintaining the integrated system for power transmission and distribution.
   On the other hand, OEPC implemented the organizational revision to respond conduct regulations aimed at ensuring
    neutrality of the transmission/distribution sector.

      Reasons for exceptions to Restriction on Concurrent Business
      There is a particularly high need for flexible power supply operation because OEPC's power grid is small-scale power
       system and independent from the mainland.
      There is a particularly high need for the transmission and distribution, retail and power generation divisions to work
       together in disaster response.
                                                       Board of Directors
   Conduct regulations
                                                              Transmission and Distribution Division        Power System Management
      Prohibition of use/provision of                                                                      Department
       information for other purposes                         Branches in the main island
                                                                                                            Distribution Department
      Prohibition of discriminatory treatment
                                                                                      After April 1, 2020
      Prohibition of competitive inhibition acts
      Establishment of appropriate information                                                             Transmission and Distribution
                                                       Board of Directors                                   Administration Department
       management system, etc.
                                                              Transmission and Distribution Division        Power System Management
                                                                                                            Department
  Further ensuring neutrality of the transmission/distribution sector by establishing                       Distribution Department
  Transmission and Distribution Administration Department in Transmission and
                                                                                                            Branches in the main island
  Distribution Division, and transferring each branches in the main island.
                                                                                                                                          31
Q8. What are the Special Tax Measures?

   We consider that special taxation measures are necessary for promoting business in Okinawa Prefecture and improving
    the lives of Okinawa residents on the grounds that disadvantages inherent in Okinawa’s electricity business have
    remained unchanged. For example, there are many small and isolated systems and Okinawa is dependent on thermal
    power.
   The amount of tax exemption based on the special taxation measures is deducted from the cost of electricity charge.

 Currently Applied Special Tax Measures
                                                                             Exemption from the Oil and Coal Tax Relating to
               Preferential Measure for Standard Taxable Values
                                                                            Specific Coal, etc. (Coal and LNG) Used for Power
                        Relating to Fixed Property Tax
                                                                                          Generation in Okinawa
                                                                            (1) Exemption from the Oil and Coal Tax for coal
  Details     Alleviation to 2/3 of Standard Taxable Values
                                                                            (2) Exemption from the Oil and Coal Tax for LNG
                                                                            (1) October 1, 2003 – March 31, 2022
              April 1, 1982 - March 31, 2022                                    * Extended for 2 years from April 1, 2020
  Period
              * Extended for 2 years from April 1, 2020                     (2) April 1, 2012 – March 31, 2022
                                                                                * Extended for 2 years from April 1, 2020
                                                                            Special Measures Law for the Promotion of Okinawa
   Basic      Supplementary Provisions of the Local Tax Law
                                                                            (Article 65.2)
   Law        (Article 15.5)
                                                                            Special Taxation Measures Law (Article 90.4.3.1)

 Revision of the Act on the Special Measures for the Promotion and                     Value of Tax Alleviation Due to the Special
 Development of Okinawa                                                                Measures
  The Act on the Special Measures for the Promotion and Development of Okinawa          The value of the alleviation measures in
   was revised in March 2012, and the revised law came into effect on April 1, 2012.      FY2020 : about 3.4 billion yen.
  Under the revised law, etc., OEPC receives favorable treatment based on               The value of the alleviation measures for
   “Preferential Measure for Standard Taxable Values Relating to Fixed Property           FY2021 : expected to be 3.3 billion yen.
   Tax” and “Exemption from the Oil and Coal Tax Relating to Specific Coal, etc.
   (Coal and LNG) Used for Power Generation in Okinawa”.

                                                                                                                                      32
Q9. What are the efforts to typhoon measures?
  Since many typhoons approach Okinawa every year, the we are taking basic measures by thoroughly inspection patrol
   electricity transmission/distribution facilities and regularly cutting trees, and is also taking various other precautionary measures.
  After the Electric Power Resilience WG compiled the verification results concerning the power failure restoration and others, we
   have implemented new measures, such as maximizing the number of patrol personnel in the distribution division to quickly
   grasp the damage situation.
             Replace to abrasion-resistant                            The measures to prevent the                              Use of electric wires to
                    electric wires                                 continuous collapse of utility poles                        reduce wind pressure

                                                                          Utility poles to reinforce

                                                                                                                        Electric wire that reduces wind pressure

                                                                                                                      Reduce the wind pressure load by
                                                                                                                      providing grooves on the surface of
                                                                                                                      the electric wire.
                                                             Strengthened       Reinforcing            Reinforcing
              Abrasion-resistant electric wires                utility pole        wire                wire / pole

 Abrasion-resistant electric wires resist to                  It's possible to prevent the continuous                         Public relations activities
 damage from trees contacting them and prevent                collapse of utility poles by reinforcing
 disconnection caused by abrasion.                            utility poles.                                         We are making an effort to prevent the
                                                                                                                     spread of damage by disseminating typhoon
     Design standard for transmission towers                  Maximizing the number of patrol personnel              measures at home on TVCM, Radio, SNS
                                                                     in power distribution department                before the typhoon approaches.
Transmission towers need to be designed to withstand a
                                                             We get the most out of the personnel in power           Moreover, we also disseminate information
wind speed of up to 40 m/s based on the “Ministerial Order
                                                             distribution department and construction                using the website and SNS among others on
to Provide Technical Standards for Electrical Equipment
                                                             companies as patrol personnel in order to               power outages, damages, the state of
(Ministry of Economy, Trade and Industry)”. However, we
                                                                                                                     restoration works, and restoration prospects.
design transmission towers that can withstand a wind         quickly grasp damages after pass typhoons. In
speed of up to 60 m/s in consideration of the maximum        addition, we utilize the personnel other than
typhoon wind speed in the past.                              power distribution department as drivers.                                                        33
Reference 1:
Trends of Ordinary Income and ROE

(billion yen)                                   Trends of Ordinary Income and ROE (Consolidated)                                                                                             (%)
   18.0                                                                                                                                                                                      18.0
                                                                      Rate                              Rate
                                                                      Revision                          Revision                                   Ordinary Income          ROE
   16.0                                                               -3.27%           15.4             -0.45%                                                                               16.0
                                                                                              Rate
   14.0                                                                                       Revision           13.6                                                                        14.0
                                                     Rate                                     -3.24%
                                                     Revision
                                                     -3.78%
                                                                   Rate                       11.7
   12.0                                                                     11.3                                                                                                      11.3   12.0
                                               11                  Revision                          10.9 10.7           11
                                                                   -5.79%                                                      10.2
   10.0                     Rate                             9.6                       10.9                                                                                                  10.0
                                                                                                                                                                                9.3
                            Revision                                     8.8
                            -3.72%                                 8.3                                                                                              8.3
                                                                                 9.2                                                              7.6
     8.0                                                                                                                                                      7.5                            8.0
                                                       7     8.6                              6.5                                           6.9
             Rate                6.4    6.4                                                                        7.8
             Revision                                                                                                                 6.3
             -5.96%                            7.1                 7.1   7.1
     6.0                                                                                             6.8                 6.6                            5.2               5.2                6.0
                                                       5.5
            3.9                                                                                            5.2                 5.4                                                    5.3
     4.0          3.4   3.3       4.7                                                                                                                                                        4.0
                                                                                                                                                                                4.4
            3.8                                                                                                                                                     4.1
                                        3.5                                                                                                                   3.7
                                                                                                                                      3.2   3.4   3.4
     2.0          2.6                                                                                                                                   2.5               2.5
                                                                                                                                                                                             2.0

                        1.1
     0.0                                                                                                                                                                                     0.0
           1994 1995 1996 1997 1998 1999 2000 2001 2002 2003 2004 2005 2006 2007 2008 2009 2010 2011 2012 2013 2014 2015 2016 2017 2018 2019 2020 (FY)

Gushikawa Thermal Power       Effects due to cost processing at    Kin Thermal Power Plant      Reduction in                          Yoshinoura Thermal Power
                              the time of accounting standard                                   retirement benefit
Plant Start of operations                                          Start of operations                                                Plant Start of operations
                              changes in association with the                                   costs due to revision of the
Generator No.1: FY 1993       introduction of retirement benefit   Generator No. 1: FY 2001     retirement benefit                    Generator No. 1: FY 2012
Generator No.2: FY 1994       accounting. (FY 2000)                Generator No. 2: FY 2003     system. (FY 2005)                     Generator No. 2: FY 2013

                                                                                                                                                                                              34
Reference 2:
Trends of the Total Assets and Shareholder’s equity

(billion yen)                 Trends of the Total Assets and Shareholder’s equity (Consolidated)                                                                                                  (%)
  600.0                                                                                                                                                                                             60.0
                                                                                                                                                               Total Assets
                                                                                                                                                               Shareholder's equity
  500.0                                                                                                                                                        Capital adequacy ratio                   50.0

                                                                                                                                        435.5 428.3
                                                           426.2 421.0                                                                              421.8                                       427.0
                                                   411.4                                                                                                      409.8                     408.7
                                                                         402.4                                                  400.6                                 400.2 402.0 399.1
                                           392.7                                 392.1                                 385.1
  400.0                                                                                  378.6 376.0                                                                                                    40.0
                                                                                                     369.8 365.5 365.2

           336.6 339.7 328.4       344.5                                                                                                                               38.1 37.7 37.8 37.7 37.8
                             326.7
                                                                                                                                                               35.9
                                                                                                                                                       34.9
  300.0                                                                                                               32.5 32.6 32.8            32.7                                                    30.0
                                                                                                                                         31.1
                                                                                                               30.2
                                                                                                        28.7
                                                                                                 27.1
                                                                                          25.6
  200.0                                                                           22.2                                                                                                                  20.0
                                                                          19.7                                                                                152.3 151.5 151.0 154.2 161.4
                                                    17.7                                                                                135.2 140.2 147 147.1
                           17.1 16.5                                                                                              131.5
            16.0 16.0 16.4           16.0 16.0 16.5                                                                   118.6 125.4
                                                                                                      106.1 110.3
                                                                                           96.8 101.9
  100.0                                                        86.9                                                                                                                                     10.0
                                                     74.3 79.4
                                      62.9 65.6 70.2
             53.7 54.3 53.9 55.7 56.7

     0.0                                                                                                                                                                                                0.0
           1994 1995 1996 1997 1998 1999 2000 2001 2002 2003 2004 2005 2006 2007 2008 2009 2010 2011 2012 2013 2014 2015 2016 2017 2018 2019 2020 (FY)

Gushikawa Thermal Power                                    Kin Thermal Power Plant                                                       Yoshinoura Thermal Power
Plant Start of operations                                  Start of operations                                                           Plant Start of operations
Generator No.1: FY 1993                                    Generator No. 1: FY 2001                                                      Generator No. 1: FY 2012
Generator No.2: FY 1994                                    Generator No. 2: FY 2003                                                      Generator No. 2: FY 2013

                                                                                                                                                                                                        35
Reference 3:
Trends of the Capital Expenditure and Free Cash Flows

(billion yen)            Trends of the Capital Expenditure and Free Cash Flows (Consolidated)
   70.0
                                                                                                                                                    Purchases of Capital Assets
                                              58.8
   60.0
                                                                                                                                                    Free Cash Flows

   50.0    47.9                                       46.9
                                                                                                                                    42.4
                                                                                                                             39.7           39.6
   40.0           36.6                                                                                                                             37.3
                                                              34.5
                                                                                                                                                                                                   31.2
                         28.2          28.7                                                                           28.9
   30.0                                                              26.3          25.8                                                                                                     25.4
                                23.9                                                             24.1                                                     23
                                                                            19.3                               20.1                                             20.9 19.3      20.5
                                                                                          18.3          17.5                                                              18.2
   20.0
                                 8.7                                               15.6 15.8                          8.6                                       16.7          17.3
   10.0                                                                                                        13.7                                       7.7
                                                                            13.4                                                                                       12.1
                                                                     3.0                                11.6                                       2.3                                      10.1
                          0.1                                                                    7.1
    0.0
                                                                                                                                                                                                   2.2
                  -0.5                 -0.7                                                                                                                                          -0.7
  -10.0                                                       -6.1                                                           -7.8
                                                                                                                                            -9.9
          -13.5                                                                                                                     -11.8
  -20.0
                                                      -19.6
  -30.0                                       -26.6

  -40.0
           1994 1995 1996 1997 1998 1999 2000 2001 2002 2003 2004 2005 2006 2007 2008 2009 2010 2011 2012 2013 2014 2015 2016 2017 2018 2019 2020 (FY)

 Gushikawa Thermal Power                                      Kin Thermal Power Plant                                                       Yoshinoura Thermal Power
 Plant Start of operations                                    Start of operations                                                           Plant Start of operations
 Generator No.1: FY 1993                                      Generator No. 1: FY 2001                                                      Generator No. 1: FY 2012
 Generator No.2: FY 1994                                      Generator No. 2: FY 2003                                                      Generator No. 2: FY 2013

  * Based on “Income and Expenditure Statement (Non-consolidated)” on and before 1998, and “Statement of Cash Flow (Consolidated)” on and after 1999, respectively.

                                                                                                                                                                                                          36
Reference 4:
Change in Okinawa Electric Power’s Stock Price
       Recent stock price changes: from January 6, 2020 to March 31, 2021
                                                                     Okinawa Electric Power Company, Inc.                                                         Nikkei Average
        Stock price as of January
        6, 2020 (closing price)                                  1,917 yen                                                          23,204 yen
        All-time high (closing price)                            2,031 yen ( +6.0% ) as of May. 12, 2020                            30,467 yen (+31.3%) as of Feb. 16, 2021
        All-time low (closing price)                             1,365 yen (-28.8%) as of Dec. 22, 2020                             16,552 yen (-28.7%) as of Mar. 19, 2020
        Stock price as of March 31,
        2021 (closing price)                                     1,551 yen (-19.1%)                                                 29,178 yen (+25.7%)
         (Note) The Company implemented a stock split of 1 to 1.05 effective June 1, 2020 and its stock price prior to May 31 has been adjusted accordingly.
                Figures in bracket indicate percentage change in the stock price from its closing price on January 6, 2020.
             Changes in the Stock Price of the Company and the Nikkei                                                            Changes in the Highest and Lowest Prices of
                    Stock Average (month-end closing price)                                                                              the Stock of the Company
         * Each stock price indexed to the closing price at the time of listing of
         the Company (March 1, 2002) as 100                                                                  (yen)
500                                                                                                       3,000
                                                                     End of March, 2021
                                                                                                                                                                                                      2,590
                                            OEPC                     OEPC = 253
                                                                                                                                         2,463
                                                                     Nikkei Average = 269                                                                                                       2,312
400                                                                                                                                 2,205                                                                 2,118
                                                                                                                                                         2,078                                                    2,073
                                                                                                                                                 2,063
                                                                                                          2,000                  1,841
                                                                                                                                                                                            1,864

300                                                                                                                                                       1,650                      1,586            1,891
                                                                                                                                                                                                                    1,624

                                                                                                                                     1,735                                                       1,707
                                                                                                                         1,293           1,573                   1,282    1,276
                                                                                                                                                    1,435                      1,190                     1,452
200                                                                                                                                                                    1,105
                                                                                                                                                                                              1,222
                                                                                                                                                                                                             1,357 1,377

                                                                                                          1,000                  1,167
                                                                                                                        821                      1,065    1,071                          1,113
                                                                                                                  738                                            927               908
                                                                                                                              780                                            823
100
                                                                                                                  600 632                                              616

                 Nikkei Average                                                                                                                                                                                   (year)
  0                                                                                                          0
      02/3   04/3       06/3        08/3       10/3       12/3       14/3       16/3        18/3   20/3           2002 2004 2006 2008 2010 2012 2014 2016 2018 2020

        (Note)    The stock split was implemented seven times in the indicated period (Record date :End of March 2005, End of March 2007, End of May 2015 ,End of May 2016, End of
                  May 2017, End of May 2018 and End of May 2020), and adjustment has been made for the figures before the end of May 2020.

                                                                                                                                                                                                                            37
You can also read