COVID-19 and Digital Resilience: Evidence from Uber Eats* - arXiv
←
→
Page content transcription
If your browser does not render page correctly, please read the page content below
COVID-19 and Digital Resilience: Evidence from Uber Eats*

 Manav Raj,† Arun Sundararajan,‡ Calum You.§

 This draft: June 12, 2020

 Abstract
We analyze how digital platforms can increase the survival rate of firms during a crisis by
providing continuity in access to customers. Using order-level data from Uber Technologies, we
study how the COVID-19 pandemic and the ensuing shutdown of businesses in the United States
affected independent, small business restaurant supply and demand on the Uber Eats platform.
We find evidence that small restaurants experience significant increases in total activity, orders
per day, and orders per hour following the closure of the dine-in channel, and that these increases
may be due to both demand-side and supply-side shocks. We document an increase in the
intensity of competitive effects following the shock, showing that growth in the number of
providers on a platform induces both market expansion and heightened inter-provider
competition. Our findings underscore the critical role that digital will play in creating business
resilience in the post-COVID economy, and provide new managerial insight into how
supply-side and demand-side factors shape business performance on a platform.

*
 The authors are listed alphabetically by last name. This study was conducted as an independent research
collaboration between the authors. Manav Raj and Arun Sundararajan are not and have not been affiliated with
Uber Technologies, and Calum You is not and has not been affiliated with NYU. No consulting fees, research
grants or other payments have been made by Uber Technologies to the NYU authors, or by NYU to the Uber
Technologies author. We thank Emilie Boman, Libby Mishkin, Sabrina Ross and Allison Wylie for thoughtful
feedback, and Uber Technologies for access to data. All errors are our own.

Author emails: mraj@stern.nyu.edu; digitalarun@nyu.edu; calum@uber.com.
†
 NYU Stern School of Business
‡
 NYU Stern School of Business
§
 Uber Technologies

 1
1. INTRODUCTION

The restaurant business is among the industries most acutely impacted by the COVID crisis. As
cities and states initiated shelter-in-place orders and consumers pulled back their presence in
public spaces, restaurants that rely exclusively or primarily on dine-in (serving consumers face-
to-face) have been especially affected. Numbers from the Advance Monthly Retail Trade Survey
by the U.S. Census Bureau indicate a 48.7% year-over-year decline for food services and
drinking places (NAICS 722) in April 2020, reflecting revenue losses of over $30 billion that
month alone, and of over $50 billion in March and April 2020 (US Census Bureau Monthly and
Annual Retail Trade, 2020). According to the National Restaurant Association, the average
establishment saw a 78% decline in its revenues in the first 10 days of April 2020 compared to
the same period in April 2019, and revenue losses over the month are projected to exceed $50
billion (Grindy, 2020).

Within the restaurant industry, small businesses have been especially vulnerable to this crisis.
While larger restaurant chains may have the resources to weather a prolonged economic
downturn, independent establishments and mom-and-pop restaurants may struggle to stay alive
as revenues fall, and it is believed that up to 75% of independent restaurants closed during the
pandemic may not survive the crisis (Severson and Yaffe-Bellany, 2020). Further, independent
restaurants are more heavily impacted by recessions and economic shocks than the larger
national chains as they have limited access to credit and alternative financing options during such
crises (Dietrich, Schneider, and Stocks, 2020). The unfavorable economic environment will thus
further exacerbate the credit constraints (Evans and Jovanovic, 1989) that typically disadvantage
small businesses.

Faced with the current crisis, restaurants have been forced to utilize alternative channels to reach
customers, maintain revenue, and stay alive. A bright spot for some restaurants has been the
growth of access to alternative digital channels over the last few years. For an independent
restaurant, food delivery platforms like Uber Eats and Doordash can now make the difference
between survival and shutdown. Our study takes a close look at the economic effects of access to
this platform-enabled channel during the COVID-19 shutdown in March and April 2020.

 2
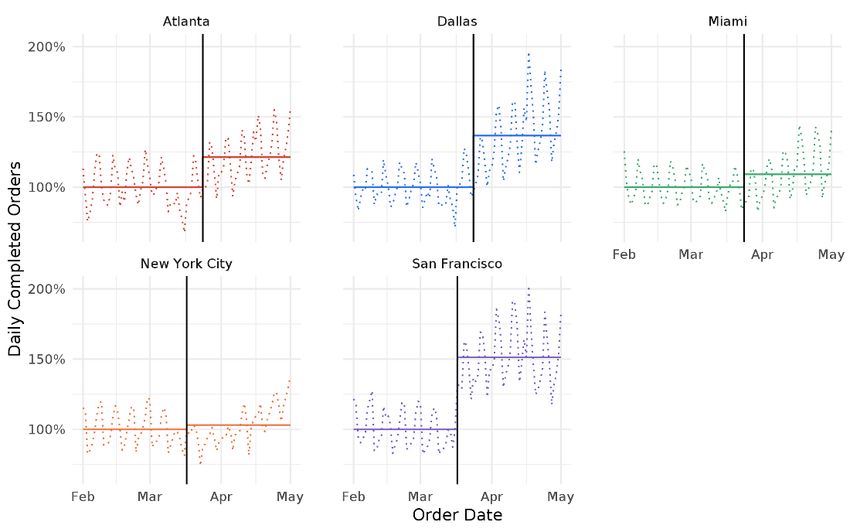
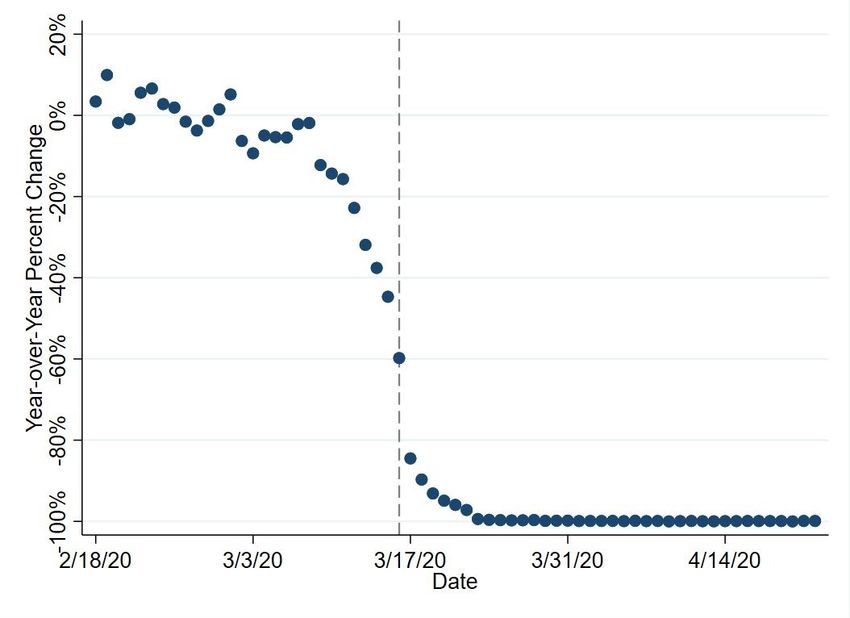
Figure 1: Year-over-Year Percent Change in Seated Diners in Response to the COVID-19
 Pandemic

Note: Illustrates the year-over-year percent change in seated diners at restaurants on the OpenTable network in the
United States The dashed line represents March 16.

Prior research has explored the challenges and opportunities that such alternative distribution
channels pose to incumbent firms that have traditionally operated in different markets (e.g.,
Chen, Hu, and Smith, 2019a; Danaher et al., 2010; Smith and Telang, 2009). For example,
Airbnb is now an increasingly important channel, not just for sharing one’s spare bedroom or
apartment, but also for bed-and-breakfasts and full-time vacation rental properties (Guttentag,
2015). Similarly, e-commerce platforms such as eBay and Amazon.com are increasingly
important for small businesses and individual sellers (Bailey et al., 2008).

These digital distribution channels that have ended up being a source of small business resilience
exhibit different characteristics than traditional markets, altering the nature of competition in
markets (Farronato and Fradkin, 2018; Hall and Krueger, 2018; Zervas, Proserpio, and Byers,
2017). Such changes provide opportunities for businesses that may struggle in other market
settings. On the supply side, platforms and digital distribution channels lower the costs of entry
for small providers, enabling smaller providers to reach buyers more easily and providing them
with flexibility (Chen et al., 2019b; Einav, Farronato, and Levin, 2016). Digital markets greatly
reduce the costs of consumer search and discovery using recommendation tools that leverage
large data on consumer behavior with a wide inventory of products (Brynjolfsson, Hu, and
Simester, 2011; Oestreicher-Singer and Sundararajan, 2012). In conjunction with the decreased
 3
costs of maintaining inventory and the ability to aggregate demand across a wider consumer
base, such recommendation and search tools create a market in which “niche” offerings can find
an audience and thrive (e.g., Brynjolfsson et al., 2006, 2011; Oestreicher-Singer and
Sundararajan, 2012; Zhang, 2018).

Building on such work, we analyze and document the stabilizing and sustaining effects of food
delivery platforms in the weeks following the shutdown in the United States due to the COVID-
19 pandemic in mid-March 2020. We use order-level data from the Uber Eats food delivery
platform for five major US cities (New York City, San Francisco, Atlanta, Miami, and Dallas)
from February 1st 2020 through May 1st 2020 to examine changes in restaurant demand and
performance on the Uber Eats platform following the shutdown. We find evidence that small
restaurants take advantage of the online on-demand channel to partially offset the revenue losses
from shuttering their dine-in channel. Across our five sample cities, we see a sharp increase in
the rate at which new restaurants join the Uber Eats platform. In addition, we see that restaurants
that remain open for delivery appear to experience significant and economically meaningful
increases in the count of orders that they receive.

This increase in orders exists despite the fact that many restaurants have cut the number of hours
that they supply on the platform. Probing deeper, our analysis reveals that the impact of the
COVID-induced economic shock has many facets which collectively influence observed changes
in restaurant demand and performance. There is a demand-side shock comprised of many parts
with countervailing effects: the absence of dine-in options may shift demand towards the online
channel; variability in the availability of groceries and fears of going to a grocery store may
induce consumers to order in rather than cook themselves; an increase in the hours people have
been spending at home coupled with health concerns associated with food prepared and
delivered by people outside their homes could induce an increased propensity and ability to
prepare one’s own meals. More saliently, there is also a supply-side shock induced by the
shuttering of many restaurants, the cutting back of operating hours for those that remain open,
and the greater availability of resources to dedicate to the delivery side of operations as dine-in
dries up.

Our analysis of the competitive effects of this supply-side shock reveals that the intensity of
competitive effects (as measured by the percent of restaurants within a cuisine categorization that

 4
remain open on a given day) have grown following the shock. As one might expect, the
performance of an individual restaurant on the Uber Eats platform is better when a larger fraction
of its competitors (defined as those in the same city offering the same cuisine) are closed.
However, overall demand on the platform is larger when more restaurants are open. These dual
effects of market expansion and substitution suggest an interesting tension between what is
optimal for the platform and what is optimal for the complementors hosted on the platform.

Our work contributes to multiple streams of literature. Over the last decade, the emergence of
platforms has spawned a growing body of literature that focuses on the strategy and performance
of the firms that create and organize the platforms (e.g., Boudreau, 2010; Cennamo and Santalo,
2013; Eisenmann, Parker, and Alstyne, 2011; Tucker and Zhang, 2010; Zhu and Iansiti, 2012).
However, much less attention has been paid to understanding the performance and strategy of
providers on digital markets, despite the fact that such providers are critical to value creation and
represent the vast majority of firms within a platform ecosystem (Kapoor and Agarwal, 2017).
Our work aims to fill that gap by showing how digital channels can stabilize firm performance
when other distribution channels are limited.

By showing that digital channels can serve as a substitute when traditional brick-and-mortar
settings are disrupted, we contribute to the body of research that examines cannibalization and
opportunities from alternative digital distribution channels (Chen et al., 2019a; Danaher et al.,
2010; Deleersnyder et al., 2002; Smith and Telang, 2009). Further, by exploring the moderating
effect of competition on performance on the digital platform, we add to a body of literature that
explores substitution and spillovers in the sharing economy (Sundararajan, 2016) and on digital
platform markets (Haviv, Huang, and Li, 2020; Reshef, 2019). Lastly, by highlighting the dual
effects of market expansion and business stealing, we contribute to literature that discusses the
tension between strategies that are optimal for the platform and strategies that are optimal for
complementors hosted on the platform (e.g., Filippas, Jagabathula, and Sundararajan, 2019;
Venkatraman and Lee, 2004; Zhu and Liu, 2018).

The rest of this paper is organized as follows. Section 2 describes our empirical setting. Section 3
outlines our data and provides some preliminary model-free results. Section 4 provides our
models, their results, and discusses their implications. Section 5 concludes and outlines
directions for additional inquiry.

 5
2. EMPIRICAL SETTING

The focus of our study is on how digital channels can substitute for brick-and-mortar sales when
traditional channels are disrupted. We take advantage of the worldwide COVID-19 pandemic,
also known as the coronavirus pandemic, that began at the end of 2019. The pandemic has
involved the outbreak of a viral infection that can cause acute respiratory issues in affected
individuals (Liu, Kuo, and Shih, 2020). The virus was first identified in December 2019 in
Wuhan, China, and has since then spread across the world, resulting in a global pandemic (Hui et
al., 2020). The virus is primarily transmitted through close contact and is highly contagious (Liu
et al., 2020).

As of June 11, 2020, more than 7.4 million cases have been reported resulting in greater than
420,000 deaths (COVID-19 Map, 2020), and there are no vaccines, drugs, or medicines that
demonstrably prevent or cure the disease (WHO Q&A on Coronavirus, 2020). Accordingly,
countries across the world have adopted dramatic non-pharmaceutical interventions to prevent
the spread and transmission of the virus. Across the United States, states and cities have
requested or required that residents avoid any non-essential travel or activity (Mervosh, Lu, and
Swales, 2020). Such “stay-at-home” or “shelter-in-place” orders have devastated economies,
leading to rising unemployment rates, falling consumer activity, and stifled growth (Lee, 2020).

As discussed earlier, the restaurant industry is among the most acutely impacted, and we see
dramatic changes in consumer and supplier behavior on alternative distribution channels in
response to these interventions, as illustrated in Figure 2. Panel A shows how consumer sessions
with demand intent have increased post-shutdown across our five sample cities, with an increase
in average daily consumer activity that ranges from 25% in Miami to nearly 75% in San
Francisco.

In Figure 2, Panel B, we show the monthly average number of SMB restaurants that joined the
Uber Eats platform in the months prior to and following the onset of the pandemic. Relative to
February 2020, across the five cities, signups increased by 128% in March 2020 and by 51% in
April 2020. Among our five cities, in March 2020 compared to February 2020, Atlanta displayed
the largest single-city increase — by 492% or a 5.92x increase, while San Francisco displayed
the largest within-city increase — by 107% or a 2.07x increase in April 2020 relative to February
2020. Signups slowed in April 2020 relative to March 2020, except in San Francisco, which saw
a 1.91x increase in March 2020 and a 1.09x increase in April 2020 relative to March.

 6
Figure 2: Consumer and Supplier Activity in Response to the COVID-19 Pandemic on the
 Uber Eats Platform

 A. Consumer Sessions with Demand Intent

 B. Monthly Rate of SMB Restaurants joining the Uber Eats platform

Note: In Panel A, the dotted curves plot the daily number of consumer sessions with demand intent between
February 1 and May 1 across our five cities, normalized in a way that makes the average pre-lockdown value equal
to 1. The dashed vertical line represents the day on which the shelter-in-place guidance was issued. The solid
horizontal lines depict the average daily number of consumer sessions with demand intent in the pre-lockdown and
post-lockdown time windows. The differences in averages pre- and post- are statistically significant in each of our
cities. In Panel B, the first four bars depict the monthly average number of restaurants that joined Uber Eats in 2016,
2017, 2018 and 2019. The next four bars depict the actual number of restaurants that joined Uber Eats in the first
four months of 2020.

 7
3. DATA AND MODEL-FREE ANALYSIS

We rely on data from the Uber Eats platform, a digital food service delivery platform offered by
the ridesharing company Uber. Consumers can review menus and order food for delivery or
takeout from participating restaurants using an application provided by the platform or through a
web browser. In exchange for hosting the transaction and connecting consumers to restaurants,
Uber Eats collects a commission on the orders placed on the platform from restaurants and
collects delivery charges from customers.

We use order-level data to examine how restaurant demand and performance on the Uber Eats
platform changes following the shutdown. Our sample consists of activity on all “Small or
Medium Business” (SMB) restaurants, defined as restaurant chains with 50 or fewer locations on
the Uber Eats platform, across five major US cities (New York City, San Francisco, Atlanta,
Miami, and Dallas) from February 1st 2020 through May 1st 2020. A vast majority of these
restaurants (90% of the SMBs in our sample) have just a single location. We measure restaurant
demand and performance using the daily count of orders a restaurant receives.1

To identify the effect of the closure of dine-in restaurants on restaurant performance on the Uber
Eats platform, we take advantage of the enactment of shelter-in-place guidance in each of our
five sample cities. For each city, we define a “pre-lockdown” and “post-lockdown” period
depending on the date the city enacted shelter-in-place guidance (for all cities, this occurred in
mid-March 2020). For example, for New York City, the pre-shutdown period comprises the days
February 1 through March 16, and the post-lockdown period comprises the days March 17
through May 1. Table 1 summarizes.2

1
 Because of the proprietary nature of the Uber Eats data, we are limited in the outcome measures we can consider at
part of this research study, and do not have access to restaurant revenues or order sizes.
2
 Dallas and Miami prohibited in-restaurant dining a week before instating shelter-in-place guidance. We use the
shelter-in-place guidance for pre- and post-dates in these cities for consistency. Results are robust to using the date
of restaurant closure as well.

 8
Table 1: Pre- and Post-Lockdown Periods by Sample City
 City Pre-Lockdown Period Post-Lockdown Period
 3
 Atlanta February 1 – March 23 March 24 – May 1

 Dallas4 February 1 – March 23 March 24 – May 1

 Miami5 February 1 – March 23 March 24 – May 1

 New York City6 February 1 – March 16 March 17 – May 1

 San Francisco7 February 1 – March 16 March 17 – May 1

 Note: Date ranges are inclusive. Pre- and post-lockdown dates are defined by the date that the city announced
 “shelter-in-place” or “stay-at-home” guidance.

For data anonymity purposes as well as to ease interpretation of coefficients, order counts at the
restaurant-day level are scaled by the pre-period mean count of daily orders across all restaurants
within the city. This scaling will later allow us to interpret our coefficients as percentage changes
in daily orders relative to pre-period activity levels within the city.

In an ideal natural experiment, we would have a set of control cities that were unaffected by the
pandemic.8 Unfortunately, the pandemic has affected nearly all major cities across the globe, and
we do not have an appropriate sample of control cities. Nevertheless, even though limited to just
comparing within-city changes pre-lockdown vs. post-lockdown, we believe that the exogenous
nature of the global pandemic provide clear insights into how a change in the availability of a
traditional channels affects supply and demand through alternative digital channels. In general,
all our analysis compares outcomes post-lockdown with outcomes pre-lockdown. We provide
each model specification at the appropriate point in the following section

3
 https://www.atlantamagazine.com/news-culture-articles/atlantas-latest-coronavirus-updates-tuesday-march-24/
4

https://static.texastribune.org/media/files/ed4763065cc11702a343bbaa3e67570b/Dallas%20County%20Shelter%20i
n%20Place.pdf?_ga=2.204951833.80763332.1590860856-1233562438.1590098631
5
 https://www.miamigov.com/Notices/News-Media/City-of-Miami-Orders-Residents-to-Shelter-in-Place
6
 https://www.nytimes.com/2020/03/15/nyregion/new-york-coronavirus.html
7
 https://www.sfdph.org/dph/alerts/files/HealthOrderC19-07-%20Shelter-in-Place.pdf
8
 For example, if such a set of control cities existed, we could use a difference-in-differences identification strategy
to evaluate the causal impact of restaurant closure by comparing trends from the pre-period to the post-period for
treatment vs. control cities.

 9
Figure 3: Changes in Total Daily Orders on the Uber Eats Platform in Response to the
 COVID-19 Pandemic

Note: The figure displays the daily number of orders fulfilled by restaurants between February 1 and May 1 across
our five cities. The dashed vertical line represents the day on which the shelter-in-place guidance was issued. The
solid horizontal lines depict the average daily number of completed orders in the pre-lockdown and post-lockdown
time windows.

Before proceedings to our main results, we first provide model-free evidence aligned with the
demand-side and supply-side shocks discussed in the introductory section. First, as illustrated in
Figure 3, following the lockdown, all five cities experienced an increase in the total number of
Uber Eats orders placed across all restaurants. The average total number of orders per day was
significantly higher in the post-lockdown period across all cities except New York City, with the
highest difference in San Francisco (51.2%, p < 0.01) and the lowest difference in New York
City (3.1%, p = 0.27).

What is especially interesting is that these increases in total daily orders have occurred despite
widespread restaurant shutdowns and cutbacks on operating hours. Many restaurants have
shuttered entirely, either temporarily or permanently. Of those that remain, many have cut back
on the number of hours they operate because of the dramatic decrease in on-site dining activity.
As illustrated by Figure 4, following the lockdown, all five cities witnessed a substantial
reduction in both the number of restaurants open for business on the platform (Panel A) and the
average number of supply hours (Panel B).

 10
When we say that a restaurant “offers supply hours,” we mean that the restaurant indicated to the
Uber Eats platform at some point during the day that is was available to take orders. Restaurants
have the ability to mark themselves as available or unavailable to order from on the Uber Eats
platform; the platform then logs data on the windows of available time. We quantify the
windows of time that a restaurant indicates availability in this manner by measuring, for each
restaurant on each day, its number of supply hours. For example, on a given day, if a restaurant
indicates availability between 12:00pm and 4:30pm and then again between 6:30pm and
10:00pm, this corresponds to the restaurant having eight supply hours on that day.

The decrease in the number of restaurants open for delivery was greatest in New York City
(38%, p
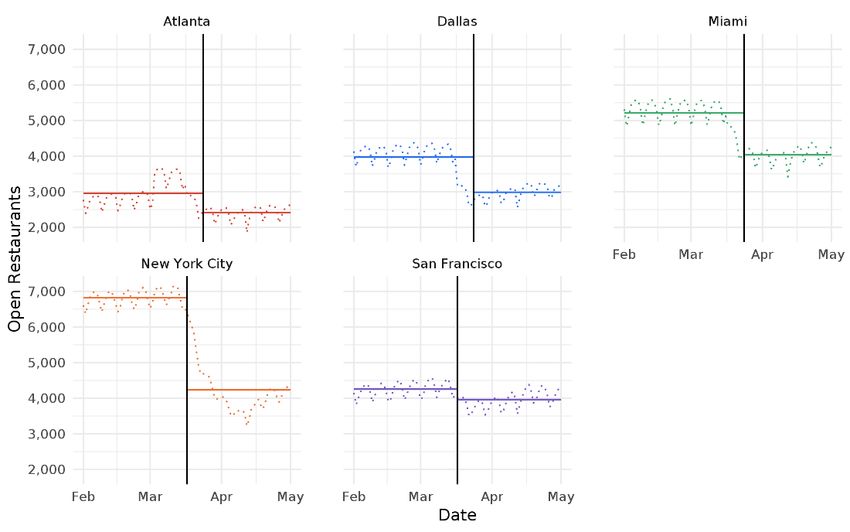
Figure 4: Supply-Side Response to COVID-19 Pandemic on the Uber Eats Platform

 A. Number of Open Restaurants.

 B. Average Daily Supply Hours for Open Restaurants.

Note: In Panel A, the dotted curves plot the average number of restaurants that offer at least one hour of supply on
the Uber Eats platform on any given day. In Panel B, the dotted curves plot the average number of daily supply
hours per restaurant, only counting restaurants that offer supply on the Uber Eats platform on any given day. In both
charts, the solid horizontal lines depict the average in the pre-lockdown and post-lockdown windows. The
differences in pre-lockdown and post-lockdown averages are statistically significant in each of our cities.

 12
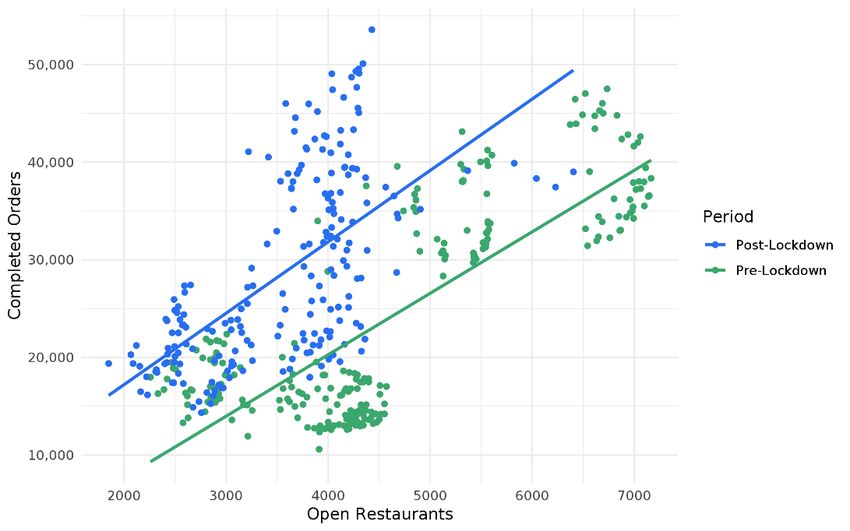
Figure 5: Changes in Order Velocity on the Uber Eats Platform in Response to the
 COVID-19 Pandemic

Note: The dotted curves plot the daily number of orders/supply hour (normalized velocity) fulfilled by restaurants
between February 1 and May 1 across our five cities, normalized in a way that makes the average pre-lockdown
value equal to 1. The solid horizontal lines depict the average normalized velocity in the pre-lockdown and post-
lockdown time windows. The differences in averages pre-lockdown and post-lockdown values are statistically
significant in each of our cities.

Put differently, the simultaneous increases in demand and decreases in supply have dramatically
raised the rate at which active restaurants are receiving and fulfilling orders post-pandemic. The
velocity increases are most dramatic in New York City and Dallas, where on average, restaurants
that were still operating post-lockdown have more than doubled the number of orders they are
fulfilling per available hour, but are by no means small in other cities: close to double in San
Francisco, 71% higher in Miami and 69% higher in Atlanta.

Finally, we investigate the overall relationship between supply and demand, that is, the number
of restaurants offering supply in a city on any given day, and the total number of order placed in
that city on that day. This is summarized in Figure 6. Not surprisingly, an increase in supply is
corelated with a net expansion in demand. While this is clearly positive for the platform, the
impacts of supply expansion on the providers is not immediately clear, and we explore its
competitive effects towards the end of Section 4.

 13
Figure 6: Open Restaurants and Completed Orders on the Uber Eats Platform

Note: The dots plot the relationship between the count of restaurants offering supply in a city on a given day and the
total count of completed orders within the city on that same day. The solid lines plot a simple linear relationship
between restaurant supply and completed orders at the city-day level.

4. MODEL AND RESULTS
Our model-free analysis reveals significant increases in total transaction activity coupled with a
fairly dramatic change in the supply landscape. The analysis that follows aims to better
understand restaurant-level impacts, towards unpacking the effects that the availability of the
digital channel has on SMB restaurants. We quantify this impact by focusing on one key
dependent variable – the daily number of orders received by a restaurant. While acknowledging
that daily revenue would have been an informative metric, confidentiality concerns precluded the
analysis of this measure.

4.1 Baseline model: Impact of lockdown on digital orders

Our first model assumes the following form:
 !" = # !" + ! + " + (1)

In this equation, i indexes the restaurant and t indexes the date. Y is the count of orders a
restaurant receives in a day, our dependent variable, and Post is the main independent variable
which indicates whether or not the city has enacted a shelter-in-place order on a given day. Post
is equal to zero on all pre-lockdown days and is equal to one in all post-lockdown days.

 14
Table 2: Regression Estimate of the Change in Daily Restaurant Orders on the Uber Eats
 Platform in Response to the COVID-19 Pandemic

Note: The table presents regression results that assess the impact of shutdown orders on daily order counts on the
Uber Eats platform. The variable Post takes the value 0 for all observations February 1 through the declaration of
shelter-in-place guidance in a given city, and the value 1 for all observations following the declaration of shelter-in-
place guidance through May 1. The data set in Column 1 is a balanced panel consisting of all restaurants that offered
supply on at least one day between February 1 through May 1. The data set in Column 2 is an unbalanced panel
consisting of only those restaurant-days for which the restaurant offered positive supply on that day. The dependent
variable is scaled by the within-city pre-period mean. Both regressions use fixed effects to control for unobserved
heterogeneity by restaurant and by day-of-week.

To account for restaurant-specific heterogeneity that may drive our result (including restaurant
popularity, cuisine, and the choice of whether or not to remain open for delivery following the
shelter-in-place order) we include restaurant fixed effects. We also include day-of-week fixed
effects to account for any cyclical variation in order density.

In Table 2, we present results from the regression analysis examining the effect of the shelter-in-
place orders and subsequent dine-in restaurant shutdown on orders on the Uber Eats platform. In
Column 1, the sample includes all restaurants that offered some positive level of supply
(availability to take orders) on Uber Eats platform in the pre-lockdown or post- lockdown period.
In Column 2, we focus on days on which a restaurant remains active on Uber Eats and display
results for a sample of all restaurant-days for which a restaurant offers supply on the Uber Eats
platform.

In both samples, we find that restaurants receive significantly more orders in the post-period than
in the pre-period, even controlling for restaurant and day-of-week fixed effects. In Column 1, in

 15
the sample of all restaurants that offered supply in either the pre- or post-period, we find that
restaurants on average received 11.4 percent more orders a day in the post-period relative to the
pre-period (p
Table 3: Regression Estimate of the City-Specific Change in Daily Restaurant Orders on
 the Uber Eats Platform in Response to the COVID-19 Pandemic

Note: The table presents regression results that assess the variation across cities in the impact of shutdown orders on
daily order counts on the Uber Eats platform. The variable Post takes the value 0 for all observations February 1
through the declaration of shelter-in-place guidance in a given city, and the value 1 for all observations following the
declaration of shelter-in-place guidance through May 1. The Post variable is interacted with an indicator variable for
each city to construct a city-specific effect. The data set is an unbalanced panel consisting of only those restaurant-
days for which the restaurant offered positive supply on that day. The dependent variable is scaled by the within-city
pre-period mean. Both regressions use fixed effects to control for unobserved heterogeneity by restaurant and by
day-of-week.

 17
Figure 7: City-Specific Impact of Shelter-in-Place Guidance on Daily Orders on the Uber
 Eats Platform

Note: The figure displays a bar chart displaying the city-specific marginal effect of shelter-in-place guidance on
daily orders for restaurants offering supply on a given day. Each bar depicts, for the respective city, the percentage
increase in average daily orders per restaurant in the post-lockdown period, relative to the average number of orders
received by restaurants in that city during the pre-lockdown period. The error bars depict the 95% confidence
interval. Estimates are derived from the regression results presented in Table 3.

The changes we document in Uber Eats ordering activity may be due to a number of reasons.
The absence of dine-in options may shift demand towards the online channel; variability in the
availability of groceries and fears of going to a grocery store may induce consumers to order in
rather than cook themselves. In contrast, an increase in the hours people have been spending at
home coupled with health concerns associated with food prepared and delivered by people
outside their homes could induce an increased propensity and ability to prepare one’s own meals;
the lack of availability from one’s favorite restaurants on the platform could add to this negative
demand effect. Our evidence indicates that, in the aggregate, these and other negative demand
effects are significantly outweighed by the positive.

4.2 Supply Squeeze and Competitive Effects

The changes in restaurant supply on the platform is likely to influence whether and how a
restaurant experiences the demand shock caused by the current pandemic. Restaurants may see

 18
particularly large increases in demand and orders if their direct competitors are unable to stay
open or provide less supply.

In traditional markets, entry or expansion by new firms is generally associated with an increase
in competition and profit erosion of incumbent firms (e.g., Porter, 1979). However, digital
platform markets, such as the Uber Eats platform, are characterized by indirect network effects
as a higher number of providers increase platform activity (Katz and Shapiro, 1985; Rochet and
Tirole, 2003; Weyl, 2010), which may benefit providers in the market even as competition on the
platform increases. A small but growing body of literature has attempted to identify competitive
dynamics in digital channels by examining the effects of competitor entry or expansion on
incumbent performance. Considering competition between providers on the Yelp! Transactions
Platform, Reshef (2019) finds that entry of new firms increases incumbent performance,
especially for high-quality incumbents. Similarly, in the video game industry, Haviv et al. (2019)
find evidence that an increase in sales of platform-exclusive games increases the performance of
games in other genres on the platform. However, different business models across platforms may
shape these effects extant research has yet to explore how a contraction in competitor supply,
such as the one witnessed in our empirical setting, may affect demand.

We next analyze how restaurant supply hours and competitive conditions influence the effect of
the COVID-19 induced demand shock. To assess the potential moderating effect of competition
in determining whether and how the closure of dine-in restaurants affects restaurant performance
eon the Uber Eats platform, we first must create a measure of competition. We define each
restaurant’s competitive set as the other restaurants within the same primary cuisine
categorization within the city that also provide supply on the Uber Eats platform at some time
between February 1, 2020 and May 1, 2020. Our measure of competition is the percent of
restaurants within a category that are open on a given day. A higher value in this measure
suggests that a consumer would have more options on the Uber Eats platform to choose from
within that cuisine category. Figure 8 displays the distribution of the city-cuisine-day-level
competition index pooled across all sample cities. We see the highest density of the index above
75%.

 19
Figure 8: Distribution of Competition Index

Note: The figure displays the distribution of the cuisine-level competition index. The competition index is measured
as the percent of restaurants in a city within a cuisine that are open on a given day. This figure charts this
distribution of observations at the city-cuisine-day level.

We use a model of the following form to estimate the role of competition in determining the
effect of the COVID shock on restaurant performance:
 !" = # !" + $ !" + % !" × !" +
 ! + " + (2)
By interacting the measure of competition with the post indicator variable, we can identify how
the level of competition on a given day moderates the effect of dine-in restaurant closure on
restaurant performance on the Uber Eats. By comparing the effect of our competition indicator in
the pre- vs. post-period, we can identify whether and how the relative supply of peer restaurants
and competitors affects the increase in restaurant demand. Our results are presented in Table 4
below.

 20
Table 4: Regression Estimate of the Effect of Competition on Daily Orders on the Uber
 Eats Platform in Response to the COVID-19 Pandemic

Note: The table presents regression results that assess the effect of competition on order counts on the Uber Eats
platform pre- and post-shelter-in-place guidance due to the COVID-19 pandemic. The variable Post takes the value
0 for all observations February 1 through the declaration of shelter-in-place guidance in a given city, and the value 1
for all observations following the declaration of shelter-in-place guidance through May 1. The Percent Index
variable measures the percent of sample restaurants within a given restaurant’s cuisine category that are open on a
given day. The Post variable and the Percent Index variable are interacted to construct a pre- and post-period effect
of competition. The data set is an unbalanced panel consisting of only those restaurant-days for which the restaurant
offered positive supply on that day. The dependent variable is scaled by the within-city pre-period mean. Both
regressions use fixed effects to control for unobserved heterogeneity by restaurant and by day-of-week

The results indicate that predictably, competition has a negative effect in both the pre- and post-
period. However, the effects of competition are stronger in the post-period. In Column 2, our
results suggest that a ten percent increase in the number of restaurants open within a cuisine
category decreases the orders a restaurant receives by 5.14% in the pre-period (at p
Figure 9: Effect of Competition on Daily Orders on the Uber Eats Platform in Response to
the COVID-19 Pandemic

Note: The figure displays the effect of competition on daily restaurant orders pre- and post-shelter-in-place
guidance. Competition as measured as the percent of sample restaurants within a cuisine category that are offer
supply on the Uber Eats platform on a given day. The y-axis measures the percent change in daily orders, and the
zero value of the y-axis represents the count of orders that a restaurant would receive in the pre-period with no
competition. Estimates are derived from the regression results presented in Table 4.

Figure 9 illustrates that the increase in orders associated with the post-period differs depending
on the level of competition within a cuisine category. For example, if twenty-five percent of
restaurants are open within a cuisine category in both the pre- and post-period, per-restaurant
daily order levels grow by 34.88% post-shelter-in-place guidance compared to pre-shelter-in-
place guidance. On the other hand, if seventy-five percent of restaurants are open within a
cuisine category in both the pre- and post-period, per-restaurant daily order levels grow by
28.82% in the post- vs. pre-period. The increase in orders received thus reflects changes both to
restaurant supply (i.e., competition) as well as consumer demand for delivery.

These results suggest an interesting contrast between what is best for the platform and what is
best for providers on the platform. As shown in Figure 6, the more restaurants that are on the
platform, the greater total consumer activity on the platform is. However, as demonstrated in
Table 4, it is clear that more competition on the platform appear to decrease the count of orders
each restaurant can expect to receive. An open question regards whether this substitution across
competition may be offset over longer periods of time by indirect network effects if a greater
number of providers brings more consumers to the platform. Nevertheless, digital platforms must

 22
navigate this tension in attempting to manage both the consumer and supplier-side of the
platform, and this represents a promising area for future work.

5. DISCUSSION AND CONCLUDING REMARKS
As the COVID-induced lockdown of Spring 2020 winds down, “business-as-usual” has been
transformed. In particular, there is likely to be a significant and permanent shift away from in-
person commerce and towards digital interaction. The impacts have been across sectors---the
apparel and accessories stores experienced a year-over-year decline of 89.3% in April 2020,
which while understandable given shelter-in-place and people working from home, is still
staggering, perhaps the biggest YoY decline in any sector ever, and an inflection point that
signals the future dominance of ecommerce in this sector.

While numerous restaurants have already closed their doors for good, those that emerge from the
shutdown will be the ones which were able to best leverage digital channels. The connection
between platform-sourced demand and survival will be indelible, likely leading the survivors to
double down on digital, seeing it as a critical source of resilience. Because of social distancing,
enhanced cleaning protocols, and consumer hesitancy, the costs of dine-in will increase
significantly, making a digital channel all but essential for restaurant survival.

All of these factors point to the heightened importance of platforms like Uber Eats in the
economy of the future. Our findings provide insight into the details and dynamics of the role that
such platforms play in mitigating the adverse effects of negative economic shocks, underscoring
the risks associated with policy that may curtail their growth or reach, while also shedding new
light on the different economic factors at play when a business sells through a platform.

We are currently analyzing heterogeneity in restaurant impacts following the onset of the
COVID-19 pandemic---how performance on the platform prior to the onset of the pandemic
moderates the shock, and whether there is a “long tail” effect that amplifies benefits to niche or
less popular restaurants. Longer term, unpacking the relative impacts of the supply-side and
demand-side shocks that we have documented, perhaps as part of a more detailed modeling
exercise, represents an interesting direction for deeper analysis.

 23
References
Bailey J et al. 2008. The Long Tail is Longer than You Think: The Surprisingly Large Extent of
 Online Sales by Small Volume Sellers. SSRN Scholarly Paper, Social Science Research
 Network, Rochester, NY. Available at: https://papers.ssrn.com/abstract=1132723.
Boudreau K. 2010. Open Platform Strategies and Innovation: Granting Access vs. Devolving
 Control. Management Science 56(10): 1849–1872.
Brynjolfsson E et al. 2006. From niches to riches: Anatomy of the long tail. Sloan Management
 Review.
Brynjolfsson E, Hu Y (Jeffrey), Simester D. 2011. Goodbye Pareto Principle, Hello Long Tail:
 The Effect of Search Costs on the Concentration of Product Sales. Management Science
 57(8): 1373–1386.
Cennamo C, Santalo J. 2013. Platform competition: Strategic trade-offs in platform markets.
 Strategic Management Journal 34(11): 1331–1350.
Chen H, Hu YJ, Smith MD. 2019a. The Impact of E-book Distribution on Print Sales: Analysis
 of a Natural Experiment. Management Science 65(1): 19–31.
Chen MK, Chevalier JA, Rossi PE, Oehlsen E. 2019b. The Value of Flexible Work: Evidence
 from Uber Drivers. Journal of Political Economy. The University of Chicago Press
 127(6): 2735–2794.
COVID-19 Map. 2020, May 13. Johns Hopkins Coronavirus Resource Center. Available at:
 https://coronavirus.jhu.edu/map.html [13 May 2020].
Danaher B, Dhanasobhon S, Smith MD, Telang R. 2010. Converting Pirates Without
 Cannibalizing Purchasers: The Impact of Digital Distribution on Physical Sales and
 Internet Piracy. Marketing Science 29(6): 1138–1151.
Deleersnyder B, Geyskens I, Gielens K, Dekimpe MG. 2002. How cannibalistic is the Internet
 channel? A study of the newspaper industry in the United Kingdom and The Netherlands.
 International Journal of Research in Marketing 19(4): 337–348.
Dietrich J, Schneider K, Stocks C. 2020. Small business lending and the Great Recession.
 Consumer Financial Protection Bureau. Available at:
 https://www.consumerfinance.gov/about-us/blog/small-business-lending-and-great-
 recession/.
Einav L, Farronato C, Levin J. 2016. Peer-to-Peer Markets. Annual Review of Economics.
 Annual Reviews 8(1): 615–635.
Eisenmann T, Parker G, Alstyne MV. 2011. Platform envelopment. Strategic Management
 Journal 32(12): 1270–1285.
Evans D, Jovanovic B. 1989. An Estimated Model of Entrepreneurial Choice under Liquidity
 Constraints. Journal of Political Economy. University of Chicago Press 97(4): 808–27.
Farronato C, Fradkin A. 2018. The Welfare Effects of Peer Entry in the Accommodation Market:
 The Case of Airbnb. Working Paper, National Bureau of Economic Research. Available
 at: http://www.nber.org/papers/w24361.
Filippas A, Jagabathula S, Sundararajan A. 2019. Managing Market Mechanism Transitions:
 Evidence from a Field Experiment. https://ssrn.com/abstract=3382614
Grindy B. 2020, April 20. Restaurant sales and job losses are widespread across segments.
 National Restaurant Association. Available at:
 https://restaurant.org/Articles/News/Restaurant-sales-and-job-losses-are-widespread [13
 May 2020].

 24
Guttentag D. 2015. Airbnb: disruptive innovation and the rise of an informal tourism
 accommodation sector. Current Issues in Tourism. Routledge 18(12): 1192–1217.
Hall JV, Krueger AB. 2018. An Analysis of the Labor Market for Uber’s Driver-Partners in the
 United States. ILR Review. SAGE Publications Inc 71(3): 705–732.
Haviv A, Huang Y, Li N. 2019. Intertemporal Demand Spillover Effects on Video Game
 Platforms. SSRN Scholarly Paper, Social Science Research Network, Rochester, NY.
 Available at: https://papers.ssrn.com/abstract=3048087.
Haviv A, Huang Y, Li N. 2020. Intertemporal Demand Spillover Effects on Video Game
 Platforms. Management Science. INFORMS. Available at:
 https://pubsonline.informs.org/doi/10.1287/mnsc.2019.3414.
Hui DS et al. 2020. The continuing 2019-nCoV epidemic threat of novel coronaviruses to global
 health — The latest 2019 novel coronavirus outbreak in Wuhan, China. International
 Journal of Infectious Diseases 91: 264–266.
Kapoor R, Agarwal S. 2017. Sustaining Superior Performance in Business Ecosystems: Evidence
 from Application Software Developers in the iOS and Android Smartphone Ecosystems.
 Organization Science 28(3): 531–551.
Katz ML, Shapiro C. 1985. Network Externalities, Competition, and Compatibility. The
 American Economic Review 75(3): 424–440.
Lee YN. 2020, April 24. 7 charts show how the coronavirus pandemic has hit the global
 economy. CNBC. Available at: https://www.cnbc.com/2020/04/24/coronavirus-
 pandemics-impact-on-the-global-economy-in-7-charts.html [13 May 2020].
Liu Y-C, Kuo R-L, Shih S-R. 2020. COVID-19: The first documented coronavirus pandemic in
 history. Biomedical Journal. Available at:
 http://www.sciencedirect.com/science/article/pii/S2319417020300445.
Mervosh S, Lu D, Swales V. 2020, March 31. See Which States and Cities Have Told Residents
 to Stay at Home. The New York Times. Available at:
 https://www.nytimes.com/interactive/2020/us/coronavirus-stay-at-home-order.html.
Oestreicher-Singer G, Sundararajan A. 2012. Recommendation Networks and the Long Tail of
 Electronic Commerce. MIS Quarterly 36(1): 65–84.
Porter ME. 1979. The Structure within Industries and Companies’ Performance. The Review of
 Economics and Statistics 61(2): 214–227.
Reshef O. 2019. Smaller Slices of a Growing Pie: The Effects of Entry in Platform Markets.
 Working Paper. Available at:
 https://www.dropbox.com/s/kkk91ppp7h88yzn/JMP_Reshef.pdf?dl=0.
Rochet J-C, Tirole J. 2003. Platform Competition in Two-Sided Markets. Journal of the
 European Economic Association 1(4): 990–1029.
Severson K, Yaffe-Bellany D. 2020, March 20. Independent Restaurants Brace for the Unknown.
 The New York Times. Available at: https://www.nytimes.com/2020/03/20/dining/local-
 restaurants-coronavirus.html.
Smith MD, Telang R. 2009. COMPETING WITH FREE: THE IMPACT OF MOVIE
 BROADCASTS ON DVD SALES AND INTERNET PIRACY 33(2): 18.
Sundararajan, A. 2016. The Sharing Economy: The End of Employment and the Rise of Crowd-
 Based Capitalism. Boston: MIT Press
Tucker C, Zhang J. 2010. Growing Two-Sided Networks by Advertising the User Base: A Field
 Experiment. Marketing Science 29(5): 805–814.

 25
US Census Bureau Monthly & Annual Retail Trade. 2020, May. US Census Bureau. Available
 at: https://www.census.gov/retail/index.html [20 May 2020].
Venkatraman N, Lee C-H. 2004. Preferential Linkage and Network Evolution: A Conceptual
 Model and Empirical Test in the U.S. Video Game Sector. The Academy of Management
 Journal 47(6): 876–892.
Weyl EG. 2010. A Price Theory of Multi-sided Platforms. American Economic Review 100(4):
 1642–1672.
WHO Q&A on Coronavirus. 2020, May 13. World Health Organization. Available at:
 https://www.who.int/news-room/q-a-detail/q-a-coronaviruses [13 May 2020].
Zervas G, Proserpio D, Byers JW. 2017. The Rise of the Sharing Economy: Estimating the
 Impact of Airbnb on the Hotel Industry. Journal of Marketing Research 54(5): 687–705.
Zhang L. 2018. Intellectual Property Strategy and the Long Tail: Evidence from the Recorded
 Music Industry. Management Science 64(1): 24–42.
Zhu F, Iansiti M. 2012. Entry into platform-based markets. Strategic Management Journal 33(1):
 88–106.
Zhu F, Liu Q. 2018. Competing with complementors: An empirical look at Amazon.com.
 Strategic Management Journal 39(10): 2618–2642.

 26
You can also read