COVID-19 Mortality Underreporting in Brazil: Analysis of Data From Government Internet Portals
←
→
Page content transcription
If your browser does not render page correctly, please read the page content below
JOURNAL OF MEDICAL INTERNET RESEARCH                                                                                      Veiga e Silva et al

     Original Paper

     COVID-19 Mortality Underreporting in Brazil: Analysis of Data
     From Government Internet Portals

     Lena Veiga e Silva1,2, MSc; Maria Da Penha de Andrade Abi Harb1, MSc; Aurea Milene Teixeira Barbosa dos Santos1,
     MSc; Carlos André de Mattos Teixeira1, BSc; Vitor Hugo Macedo Gomes1, BSc; Evelin Helena Silva Cardoso1, MSc;
     Marcelino S da Silva1, PhD; N L Vijaykumar3,4, PhD; Solon Venâncio Carvalho4, PhD; André Ponce de Leon Ferreira
     de Carvalho5, PhD; Carlos Renato Lisboa Frances1, PhD
     1
      Federal University of Pará, Belém, Brazil
     2
      University of Amazon, Belém, Brazil
     3
      Federal University of São Paulo, São José dos Campos, Brazil
     4
      National Institute for Space Research, São José dos Campos, Brazil
     5
      University of São Paulo, São Carlos, Brazil

     Corresponding Author:
     Lena Veiga e Silva, MSc
     Federal University of Pará
     R Augusto Corrêa, 01
     Guamá
     Belém, 66073-040
     Brazil
     Phone: 55 91 3201 7634
     Email: lenaveiga@gmail.com

     Abstract
     Background: In Brazil, a substantial number of coronavirus disease (COVID-19) cases and deaths have been reported. It has
     become the second most affected country worldwide, as of June 9, 2020. Official Brazilian government sources present contradictory
     data on the impact of the disease; thus, it is possible that the actual number of infected individuals and deaths in Brazil is far
     larger than those officially reported. It is very likely that the actual spread of the disease has been underestimated.
     Objective: This study investigates the underreporting of cases and deaths related to COVID-19 in the most affected cities in
     Brazil, based on public data available from official Brazilian government internet portals, to identify the actual impact of the
     pandemic.
     Methods: We used data from historical deaths due to respiratory problems and other natural causes from two public portals:
     DATASUS (Department of Informatics of the Unified Healthcare System) (2010-2018) and the Brazilian Transparency Portal
     of Civil Registry (2019-2020). These data were used to build time-series models (modular regressions) to predict the expected
     mortality patterns for 2020. The forecasts were used to estimate the possible number of deaths that were incorrectly registered
     during the pandemic and posted on government internet portals in the most affected cities in the country.
     Results: Our model found a significant difference between the real and expected values. The number of deaths due to severe
     acute respiratory syndrome (SARS) was considerably higher in all cities, with increases between 493% and 5820%. This sudden
     increase may be associated with errors in reporting. An average underreporting of 40.68% (range 25.9%-62.7%) is estimated for
     COVID-19–related deaths.
     Conclusions: The significant rates of underreporting of deaths analyzed in our study demonstrate that officially released numbers
     are much lower than actual numbers, making it impossible for the authorities to implement a more effective pandemic response.
     Based on analyses carried out using different fatality rates, it can be inferred that Brazil’s epidemic is worsening, and the actual
     number of infectees could already be between 1 to 5.4 million.

     (J Med Internet Res 2020;22(8):e21413) doi: 10.2196/21413

     KEYWORDS
     Brazil; COVID-19; mortality; underreporting; respiratory system diseases; public health; pandemic; time series; forecasting

     http://www.jmir.org/2020/8/e21413/                                                          J Med Internet Res 2020 | vol. 22 | iss. 8 | e21413 | p. 1
                                                                                                               (page number not for citation purposes)
XSL• FO
RenderX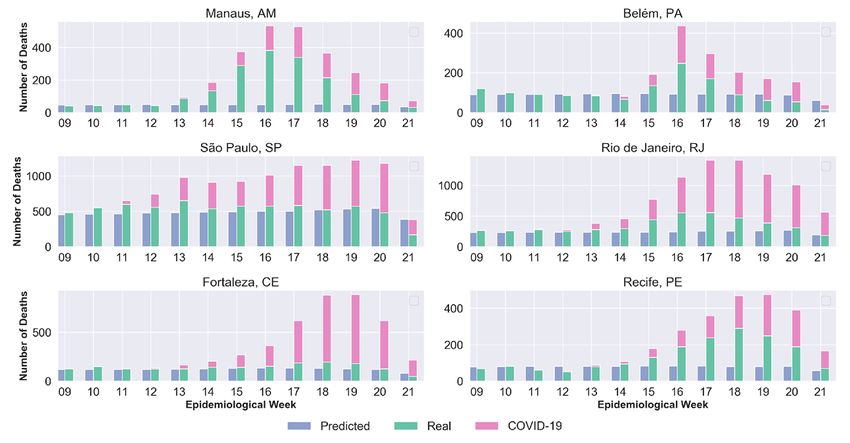
JOURNAL OF MEDICAL INTERNET RESEARCH                                                                                           Veiga e Silva et al

                                                                            of 2020 [10]. Public measures tailored to these populations are
     Introduction                                                           necessary. On a positive note, Brazil has a government-funded
     Background                                                             Unified Healthcare System (Sistema Único de Saúde, SUS) that
                                                                            is responsible for 70% of the population [11].
     On December 31, 2019, the World Health Organization (WHO)
     received a report from China about cases of pneumonia of               Brazil has 27 states divided territorially into five major regions:
     unknown etiology in Wuhan, Hubei Province. By January 7,               North, Northeast, Midwest, Southeast, and South, with specific
     2020, Chinese scientists isolated the virus, identifying it as a       climatic, social, and economic characteristics. According to the
     novel coronavirus and initially referred to it as 2019-nCoV (later     IBGE [12], the North region has the lowest demographic density,
     named severe acute respiratory syndrome coronavirus 2                  with 4.72 inhabitants/km2 and a Human Development Index
     [SARS-CoV-2]) [1-3]. The virus, which causes coronavirus               (HDI) of 0.683. The Southeast region is more developed and
     disease (COVID-19) [4], ended up spreading to other countries          the most populous, with approximately 92 inhabitants/km2, and
     and, by late January 2020, the WHO declared it an Public Health        accounts for 55.2% of the national gross domestic product
     Emergency of International Concern; the outbreak was declared          (GDP) (HDI=0.784). There is greater social inequality in the
     a pandemic on March 11, 2020.                                          Northeast region (HDI=0.608).
     The global impact of the virus has been of great concern and           A proper estimation of underreported or wrongly reported cases
     has overburdened public health systems worldwide. It can be            is necessary for a better understanding of the actual epidemic
     considered the first true global epidemic of this magnitude in         scenario; this will allow for necessary and effective measures
     the digital era [5]. COVID-19 is an acute respiratory disease,         to be undertaken by the authorities. In Brazil, underreporting
     often severe, which may become fatal to those who are infected         is due to the low rate of testing per 1 million inhabitants.
     [1]. The disease occurs when one comes into contact with               Additionally, there is significant delay in the reporting of test
     contaminated secretions, in particular, large respiratory droplets,    results [13]. During the first weeks of the COVID-19 outbreak,
     as well as when in contact with contaminated surfaces [3]. It          Brazil had tested all suspected cases as well as those that had
     disseminates rapidly, compromising the health of a large number        been in contact with a confirmed case. However, low availability
     of people, and consequently overwhelms health care                     of RT-PCR (reverse transcription polymerase chain reaction)
     infrastructure and resources. Decision makers must act                 tests forced the Ministry of Health to recommend testing for
     immediately to minimize the effects of the disease and flatten         only serious cases [9]. This approach was also extended to those
     the contagion curve to control both spread and fatalities.             belonging to high-risk groups (eg, health care professionals).
     As the disease propagates, the burden to health care systems           Different grades of testing and reporting are observed in other
     increases, despite a large number of asymptomatic cases. Studies       countries [14] so it is difficult to understand what the actual
     in China show that 62% of COVID-19 transmissions occur as              situation in Brazil and its states looks like. According to
     a result of asymptomatic and presymptomatic individuals [6].           WorldoMeter [15], 1,182,581 tests have been conducted in
     Thus, there is a high chance that the actual number of infectees       Brazil so far, a rate of 5566 tests per 1 million inhabitants, which
     is far larger than that officially announced. Moreover, it is very     is much lower than that other countries like Spain (86,921 tests
     likely that the actual proliferation of the disease is being           per 1 million inhabitants), Portugal (78,030 tests per 1 million
     underestimated, with a very high number of underreported cases.        inhabitants), and the United States (53,156 tests per 1 million
     The Pandemic in Brazil                                                 inhabitants).
     Outside the Asian continent, the disease was initially                 This undersampling leads to a high degree of underreported
     concentrated in Western Europe and North America. In a short           cases, which affects estimates of the actual fatality rate of the
     period of time, however, it expanded to other parts of the world       disease [7]. Therefore, it is of fundamental importance to
     like Africa and Latin America [7]. Brazil’s first case and death       uncover the degree to which underreporting has occurred in
     were announced on February 26th and March 17th, respectively.          order to define and establish public health policies related to
     Since then, the disease has been spreading rapidly, devastating        pandemic response.
     almost all regions of the country; at present, Brazil has the fourth   It has been suggested that the reproduction number (R) must
     highest number of deaths and the second highest number of              be less than 1 in order to reduce the number of infected cases
     confirmed infections [8]. According to the coronavirus website         [7]. However, although several Brazilian states have adopted
     of Brazilian Ministry of Health [9], there were more than              isolation, social distancing, and even lockdown measures,
     700,000 confirmed cases and almost 40,000 deaths, as of June           noncompliance is an issue.
     9, 2020.
                                                                            Official Brazilian Government Internet Portals
     The country’s difficult situation is magnified due to social
     inequalities. According to the Brazilian Institute of Geography        With the increasing spread of SARS-CoV-2 in Brazil, there has
     and Statistics (IBGE) [10], Brazil has a population of                 been a considerable growth in the population's interest for
     approximately 204.5 million people, of which 85% are
JOURNAL OF MEDICAL INTERNET RESEARCH Veiga e Silva et al
“coronavirus update.” During this period, access to news about Mortality Information System (SIM) of DATASUS (Department
the virus increased by more than 5000% when compared with of Informatics of the Unified Healthcare System) [19] and the
the previous period. Additionally, tweets related to the novel Brazilian Transparency Portal of Civil Registry [20]. The aim
coronavirus were among those that were most commented on; is to systematize the contradictory information in these portals
in Brazil, topics such as chloroquine, Minister of Health, to provide a more representative picture of the pandemic and
quarantine, and treatment of coronavirus were the most sought estimate the possible number of death reports that were
after on Twitter [17]. incorrectly recorded. These data were used to build time-series
models (modular regressions) with the ability to predict the
To manage this increase in interest, several official internet
expected mortality rate for 2020. This was done to assess
portals were created by the Brazilian municipal, state, and
whether significant disagreement is present between the real
federal bodies for dissemination, monitoring, and guidance.
and expected number of deaths for this period. By estimating
However, the data presented by these public internet portals are
the actual number of COVID-19–related deaths, it is possible
contradictory and inaccurate. Some of the data released highly
to determine the number of infected people from officially
underreport the true number of cases, leading to false
published fatality rates.
perceptions that the contagion is under control.The population
must trust the data provided to them in order to accept proposed In this study, we used as case studies the capital cities of three
recommendations [18]. regions that were most affected by the pandemic: North (Belém
and Manaus), Northeast (Fortaleza and Recife), and Southeast
We believe that by aggregating officially available information
(São Paulo and Rio de Janeiro). The resulting mortality
into a single internet portal, removing contradictions, and using
underreporting scenario will be considered for the entire country
reliable sources, we can gather support from the Brazilian
as these cities represent around 47% of the total deaths in Brazil
populace to follow WHO-recommended guidelines, thus
as of June 9, 2020 [9].
reducing the contagion rate in Brazil. This portal is under
development as part of the work presented in this paper and
will enable policy and decision makers to base their assessments
Methods
on scientific evidences and guide citizens in adopting Overview
recommended measures and behaviors (eg, social distancing,
frequent hand sanitizing, and more attention to hygiene issues). We followed the Knowledge Discovery in Databases workflow
to extract new and relevant data to enable decision making
This Study (Figure 1). Two public databases with nationally consolidated
The work described in this paper conducts an investigation into data were consulted: DATASUS and the Brazilian Transparency
underreported deaths with respect to COVID-19 based on Portal of Civil Registry. In the analysis, these steps were
historical mortality data due to respiratory problems and other followed: data extraction, data processing, machine learning,
natural causes. These data are publicly available on the internet and data interpretation and validation. Health care specialists
through the two main portals of the Brazilian government: the aided in some of these steps.
Figure 1. Methodology diagram adapted from Fayyad et al [21]. DATASUS: Department of Informatics of the Unified Healthcare System; SIM:
Mortality Information System; ICD-10:International Statistical Classification of Diseases and Related Health Problems–10th Revision; COVID-19:
coronavirus disease.
was not considered since the data is not available yet. Each entry
Data Extraction in the SIM database is highly detailed, concisely presenting all
Data were collected from two government sources accessible the information contained in the death certificate.
for public use. The registers present in both databases follow
the international standards set by the WHO. Another source was the Brazilian Transparency Portal of Civil
Registry [20]. It comprises deaths registered due to COVID-19
Part of the data collected for this research was extracted from (confirmed or suspected) and respiratory diseases, such as severe
DATASUS (SIM) [19]. It is a system from which one can access acute respiratory syndrome (SARS), pneumonia, and respiratory
regular information on mortality rates in Brazil to assist public failure. The civil registry data website is based on death
health management sectors [19]. Data were extracted for the certificates sent by the registry offices countrywide for deaths
2010-2018 period for all capital cities of Brazilian states. It is that take place in hospitals, residences, public roads, etc. Data
important to clarify that SIM is updated annually; hence, 2019
http://www.jmir.org/2020/8/e21413/ J Med Internet Res 2020 | vol. 22 | iss. 8 | e21413 | p. 3
(page number not for citation purposes)
XSL• FO
RenderXJOURNAL OF MEDICAL INTERNET RESEARCH Veiga e Silva et al
were collected for the January 1 to June 1, 2020 period, as well can be presented. This removal of data was not substantial, and
as the same period for the year 2019. For the years 2019 and the entire data set was stored in a single database.
2020, the civil registry portal records another category—deaths
The time series of deaths due to the previously mentioned
from other causes (when these were unrelated to COVID-19
diseases were from DATASUS (SIM) and were duly processed
but related to respiratory problems). This last category was also
to be concatenated with those from the Transparency Portal of
considered in this study.
Civil Registry. Following the conditions used by the civil
The Brazilian civil registry portal presents the data duly registry portal, each occurrence of death was classified according
notarized by the civil registry offices and follows a series of to the International Statistical Classification of Diseases and
legal timelines established by the Brazilian Constitution—a Related Health Problems (ICD) [22] and based on the last,
family has 24 hours after the death of a member to notify the underlying, and immediate cause of death present in the death
registry office, and in turn the registry office has up to 5 days certificate. The fields used in the database for date of death and
to duly register the death; within 8 days the Information Center ICD are mandatory. The nested classification conditions are
of Civil Registry receives the report, which is published by the summarized in Table 1.
civil registry portal. Therefore, there may be a delay of 14-15
In order to classify each record of data from DATASUS (SIM)
days for the portal to publish a record.
based on the listed conditions, it was necessary to identify the
In addition to the large delay in the Transparency Portal of Civil ICDs [22]. Thus, the corresponding IDs for the causes of deaths
Registry death reports, it is important to highlight that the update from the civil registry portal are shown in Table 2. Health care
frequency might be different for each city. For certain regions, specialists contributed to identifying and classifying the ICDs.
the delays are even longer. In general, the data for capital cities
In order to merge the databases, data referring only to death
are updated more frequently. For this reason, although the data
records for capital cities were extracted from DATASUS (SIM).
were collected on June 1st, the analysis will be conducted using
These records were then aggregated on a daily basis. Therefore,
data made available up to May 21st. By adopting this procedure,
both the databases are now compatible with respect to their
we can mitigate the effect of late notifications in the analysis.
indices and columns, making it possible to concatenate the data
Data Processing and merge into a single data set, which was then used to conduct
Data were preprocessed by removing missing and duplicated this study.
information to improve quality, so that more significant results
Table 1. Conditions established by the Transparency Portal of Civil Registry to classify deaths.
Order Condition
1 If there is any mention of COVID-19a in the death certificate, suspected or confirmed, it was considered a death attributed to COVID-19.
2 If there is any mention of severe acute respiratory syndrome (SARS), it was considered the cause of death.
3 If there is any mention of pneumonia, it was considered the cause of death.
4 If respiratory failure is listed as the only cause, it was considered the cause of death.
5 If the certificate does not mention any of the above conditions, the cause of death was considered as “other”.
a
COVID-19: coronavirus disease.
Table 2. International Statistical Classification of Diseases and Related Health Problems–10th Revision (ICD-10) classification adopted by the
Transparency Portal of Civil Registry.
Disease ICD-10 classification
Severe acute respiratory syndrome (SARS) I260, U04, J22, J100, J110
Pneumonia J12, J13, J14, J15, J16, J180, J181, J182, J188, J189, B953, B960, B961
Respiratory failure J96
y (t) = g(t) + s(t) + h(t) + εt (1)
Time-Series Forecasting Model
where, according to the model by Harvey and Peters [24], g(t)
The models used for time-series prediction were adjusted to
represents a function of tendency used to capture nonperiodic
predict the expected number of deaths for 2020 based on a
changes in a historical series; s(t) refers to periodic seasonality,
historical series from 2010 to 2018 for six capital cities. In order
representing the annual, monthly, and weekly recurring
to conduct the experiment, training based on the modular
behavior; and h(t) represents the effects of holidays on the data.
regression model FbProphet [23] was employed. The resulting
The component εt is used to represent peculiar changes not
decomposed time-series model is shown in the following
equation: included in the model.
http://www.jmir.org/2020/8/e21413/ J Med Internet Res 2020 | vol. 22 | iss. 8 | e21413 | p. 4
(page number not for citation purposes)
XSL• FO
RenderXJOURNAL OF MEDICAL INTERNET RESEARCH Veiga e Silva et al
The main component of equation 1, g(t), is used to represent
the trend model. Equation 2 refers to this component when used
Results
in forecasting problems that exhibit a linear trend with change We conducted an exploratory analysis of the data to evaluate
points: patterns in the number of deaths during the pandemic.
g(t) = (k + a(t)Tδ)t + (m + a(t)T γ) (2) Subsequently, we employed a time-series model to estimate the
number of incorrectly reported figures.
where is the growth rate, δ is a vector containing adjustments
to the growth rate, is used as an offset parameter, and γ is used Exploratory Data Analysis
as an adjustment vector for the parameter . The vector a(t) is The historical series of deaths for 2010-2018 (extracted from
used to define the change points, allowing the growth rate to SIM [19]), 2019, and 2020 (extracted from civil registry portal
be adjusted accordingly. [20]) for a same period for all the mentioned years were
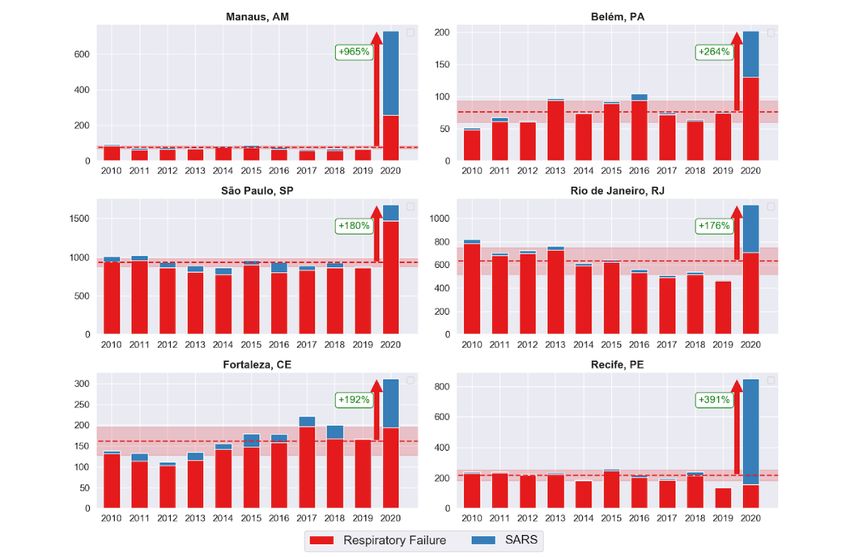
As previously mentioned, component s(t) of equation 1 is used considered. We observed an increase of 965% (from 75.8 to
to represent the seasonal influences and recurring behaviors 732) with respect to the average number of registered deaths
present in the time series. Those seasonal effects rely on a due to SARS and respiratory failure per year for Manaus, one
Fourier series representation (equation 3). It is possible to adjust of the most affected capitals (Figure 2). Due to a high
the parameter P, represented in days, in order to obtain the disagreement from the historical series of deaths for the
desired seasonality (eg, P=7 for weekly seasonality). mentioned period that coincides with the pandemic period, it is
necessary to investigate the cause of this large difference.
Recife, Belém, Fortaleza, São Paulo, and Rio de Janeiro also
presented a significant increase in the number of deaths in 2020.
In order to fit the model to the data, the time-series forecasting
Figure 2 illustrates the disagreement between the number of
is treated as a curve-fitting problem, taking the data seasonalities
deaths that occurred between the 13th and 19th weeks of the
and holiday effects into consideration [23]. The framework uses
epidemic in 2020 with respect to the average of the historical
an implementation of the Limited-memory
series for the same period in previous years for both the
Broyden-Fletcher-Goldfarb-Shanno algorithm, referenced by
diseases—respiratory failure and SARS—that presented a large
Zhu et al [25], in order to find a maximum a posteriori estimate.
variation. It is possible to observe distinct behaviors in the
Data Interpretation and Validation discrepancy in records for each city. In Recife, the substantial
For this analysis, we used data on COVID-19–related deaths increase in SARS cases draws a great deal of attention, while
of the six capital cities with the highest number of deaths Manaus presented a considerable increase for all causes of death.
recorded by the civil registry website: Belém (capital of Pará), Despite the increase being more significant for SARS and
Fortaleza (capital of Ceará), Manaus (capital of Amazonas), respiratory failure, we observed occasional discrepancies in
Recife (capital of Pernambuco), Rio de Janeiro (capital of Rio regard to pneumonia and deaths due to other causes. The mean
de Janeiro), and São Paulo (capital of São Paulo). number of deaths and standard deviations, along with the
percentage of increase with respect to the average of the
Once the processing workflow and data cleaning are completed, historical series for these diseases, are presented in Table 3.
it is possible to devise a system to predict trends in deaths caused
by respiratory issues, as well as to predict the expected behavior As previously mentioned, we observed a major discrepancy for
of diseases for 2020. Based on the number of deaths per year SARS-related deaths for all cities. A sudden increase of 6991%
for each disease for the capital cities under consideration, an (from 9.8 to 685) for SARS in Recife, for example, might be
estimate of deaths was calculated for normal conditions (ie, no associated with errors in reporting. SARS, first detected in China
pandemic). Thus, the difference between the number of expected in November 2002, is caused by a type of coronavirus called
cases for 2020 and recorded cases for 2020 was determined. severe acute respiratory syndrome coronavirus (SARS-CoV),
Next, this extrapolation was added to the deaths reported for with symptoms similar to COVID-19, causing a severe
COVID-19, allowing us to estimate the actual number of deaths respiratory viral infection [26]. Thus, it is possible that the
due to the pandemic. With this analysis, the actual cause of similarities between the diseases can compromise the accuracy
sudden increase in deaths, not only due to respiratory issues but of death records.
also other deaths, could be estimated.
http://www.jmir.org/2020/8/e21413/ J Med Internet Res 2020 | vol. 22 | iss. 8 | e21413 | p. 5
(page number not for citation purposes)
XSL• FO
RenderXJOURNAL OF MEDICAL INTERNET RESEARCH Veiga e Silva et al
Figure 2. Increases in the number of deaths due to respiratory failure and severe acute respiratory syndrome (SARS).
Table 3. Mean (SD) for the historical series and percent increase/decrease of deaths caused by respiratory failure, pneumonia, severe acute respiratory
syndrome (SARS), and other causes.
City Respiratory failure Pneumonia SARS Other causes
Belém
Mean (SD) 72.7 (15.62) 180.6 (42.09) 3.6 (2.54) 491.1 (72.5)
Increase/decrease (%) +78 +37 +1900 –1
Fortaleza
Mean (SD) 144.3 (29.09) 442.2 (147.90) 17.9 (10.12) 1474.6 (161.92)
Increase/decrease (%) +35 –1 +553 –11
Manaus
Mean (SD) 66.8 (9.01) 259.4 (41.80) 9.0 (2.16) 1162.6 (122.70)
Increase/decrease (%) +283 +192 +5188 +69
Recife
Mean (SD) 207.5 (32.2) 307.1 (39.3) 9.8 (6.98) 1963.2 (305.40)
Increase/decrease (%) –24 –43 +6991 –25
Rio de Janeiro
Mean (SD) 611.3 (108.85) 1501.1 (166.94) 22.7 (7.64) 6065.1 (495.47)
Increase/decrease (%) +15 +16 +1701 –5
São Paulo
Mean (SD) 861.8 (59.12) 2933.3 (247.11) 70.4 (30.82) 8418.1 (571.08)
Increase/decrease (%) +70 –2 +192 +6
http://www.jmir.org/2020/8/e21413/ J Med Internet Res 2020 | vol. 22 | iss. 8 | e21413 | p. 6
(page number not for citation purposes)
XSL• FO
RenderXJOURNAL OF MEDICAL INTERNET RESEARCH Veiga e Silva et al
Time-Series Prediction conducted for the remaining data for every 90-day cutoff at a
The exploratory analysis identified values that were much higher 470-day horizon. Table 4 shows the absolute errors for the
than the average of the historical series for registered deaths validation set predictions.
during the pandemic period. For this reason, in this section we The models were then used to predict data up to May 21, 2020,
further analyze the results obtained from the time-series models to be compared with the actual data presenting the observed
developed to compare the expected trend (predicted) and the anomalies. Figure 3 compares the number of registered deaths
actual trend. (actual) from civil registry website, including deaths due to
We trained the time-series models with data from January 2010 COVID-19, and the predicted deaths returned by the time-series
to May 2019. The model was adjusted to individually predict models. The results are grouped by epidemiological weeks and
the behavior of each of the three diseases and deaths over other considers data from the 9th week until the 21st week of 2020.
causes in each. Our results demonstrated that each city presented a different
trend with respect to the peak periods for disease activity within
To compute the error metrics, each model was initially trained the considered timeframe. Therefore, analysis must be performed
using 7 years of data. A cross-validation process was then considering their specific periods.
Table 4. Mean absolute error (MAE) and mean absolute percentage error (MAPE).
City Respiratory failure Pneumonia SARSa Other causes
Belém
MAE 1.61 2.64 0.40 5.15
MAPE 9.6 11.6 33.5 8.3
Fortaleza
MAE 1.81 2.34 0.57 6.59
MAPE 11.4 2.6 37.0 10.1
Manaus
MAE 0.75 1.88 0.34 4.47
MAPE 14.0 10.0 28.4 8.3
Recife
MAE 1.91 2.34 0.59 7.45
MAPE 12.3 7.8 40.0 6.0
Rio de Janeiro
MAE 2.77 4.99 0.50 13.38
MAPE 6.7 6.8 25.8 5.2
São Paulo
MAE 3.34 7.78 0.96 12.27
MAPE 2.4 3.1 36.4 2.3
a
SARS: severe acute respiratory syndrome.
http://www.jmir.org/2020/8/e21413/ J Med Internet Res 2020 | vol. 22 | iss. 8 | e21413 | p. 7
(page number not for citation purposes)
XSL• FO
RenderXJOURNAL OF MEDICAL INTERNET RESEARCH Veiga e Silva et al
Figure 3. Predicted and actual deaths per epidemiological week related to respiratory diseases. COVID-19: coronavirus disease.
Taking into account the peak periods for each city, predicted death confirmed by the Brazilian government occurred in the
figures are smaller than the actual values in terms of the days 11th week, the increase was 24.4% (from 7238 to 9004). For
with a high number of deaths due to respiratory and other causes. the other cities, the following increases were observed: 144.7%
The estimates of errors in death reports for each disease, per (from 1274 to 3117) for Manaus, 128.9% (from 575 to 1317)
city, are shown in Figure 4. The number at the end of each bar for Recife, 99.6% (from 485 to 968) for Belém, 41.2% (from
represents an estimate, in absolute numbers, of the number of 1279 to 1806) for Fortaleza, and 39.9% (from 3475 to 4863)
cases that deviate from the expected pattern, and most probably for Rio de Janeiro. These percentages refer to the increase in
were incorrectly recorded. death records that didn’t reference COVID-19. Thus, one can
see a significant increase in the number of deaths during the
Each city, with its own particularities (Figure 4), has its causes
epidemic period that attributed to causes that deviate from the
of death recorded differently. Table 5 presents the considered
expected pattern.
periods for each city and the difference between the number of
reported cases and the number of predicted cases both The discrepancy is clearly very large, in terms of percentage
quantitatively and percentagewise. The last column shows the values, with respect to the reports on deaths due to diseases
total difference in the number of deaths for the period not considered in this research and other causes, especially SARS,
covered in the historical series. which reported an increase of around 5820% (from 8.04 to 476)
in Manaus and 2880% (from 23.32 to 695) in Recife.
The predicted values show different increases for the
investigated cities. For São Paulo, where the first COVID-19
Figure 4. Estimated number of deaths wrongfully attributed to respiratory system diseases for the considered periods. SARS: severe acute respiratory
syndrome.
http://www.jmir.org/2020/8/e21413/ J Med Internet Res 2020 | vol. 22 | iss. 8 | e21413 | p. 8
(page number not for citation purposes)
XSL• FO
RenderXJOURNAL OF MEDICAL INTERNET RESEARCH Veiga e Silva et al
Table 5. Difference (∆) between real and predicted values.
Cities (epidemiological weeks) ∆ Deaths ∆ Total
deaths
Respiratory failure Pneumonia SARSa Other causes
Belém (15th to 17th )
Difference 88 90 178 125 481
Increase (%) 127.24 60 1715.56 49.41 99.61
Fortaleza (14th to 18th )
Difference 69 52 157 248 526
Increase (%) 52.69 23.47 815.20 27.33 41.17
Manaus (13th to 19th)
Difference 220 477 467 678 1842
Increase (%) 611.11 196.12 5820.40 68.75 144.74
Recife (14th to 19th)
Difference 18 11 671 41 741
Increase (%) 25 35.48 2880.27 9.13 128.92
Rio de Janeiro (13th to 19th)
Difference 319 483 391 194 1387
Increase (%) 96.28 42.49 2284.8 9.7 39.96
São Paulo (10th to 17th)
Difference 851 301 274 339 1765
Increase (%) 91.15 24.31 493.53 6.77 24.40
Therefore, the extrapolated (period not covered in the historical
Discussion series) values of the number of deaths were attributed to the
Principal Findings underreporting of the pandemic. Table 6 shows the estimates
of the percentage of underreporting of COVID-19–related deaths
It is reasonable to assume that the values presented in Table 5 for each city compared to the official number of deaths up to
were incorrectly reported, concealing the actual number of May 21, 2020.
deaths due to the pandemic. The reporting bias for COVID-19
(relating to respiratory diseases) may have occurred due to For the cities of this case study, an average underreporting of
delays in releasing the results, lack of tests, or even errors in 40.7% is estimated for deaths related to COVID-19. The values
identifying the disease. It is important to stress that even other vary between 25.9% to 62.7%, with emphasis on Manaus, which
causes of deaths increased significantly during the pandemic had the highest number of deaths underreported (62.7%), and
period (eg, an increase of 68% [from 677.92 to 1664] in Recife, with almost 50%. Fortaleza had the lowest number, with
Manaus). This study attributes some of these deaths to 25.9% of underreporting, in spite of its count being substantial.
COVID-19 as well.
Table 6. Underreported deaths due to coronavirus disease (COVID-19).
City Population, N Extrapolated number Official number Total number of Number of deaths Underreported deaths
(PNADa) of predicted deaths of deathsb estimated deaths per 1 million in- (%)
habitants
Belém 1,492,745 481 952 1433 959.98 33.57
Fortaleza 2,669,342 526 1503 2029 760.11 25.92
Manaus 2,182,763 1842 1094 2936 1345.08 62.74
Recife 1,645,727 739 747 1486 902.94 49.73
Rio de Janeiro 6,718,903 1387 2376 3763 560.06 36.86
São Paulo 12,252,023 1765 3238 5003 408.34 35.28
a
PNAD: Pesquisa Nacional por Amostra de Domicílios (National Household Sample Survey).
b
As of May 21, 2020,
http://www.jmir.org/2020/8/e21413/ J Med Internet Res 2020 | vol. 22 | iss. 8 | e21413 | p. 9
(page number not for citation purposes)
XSL• FO
RenderXJOURNAL OF MEDICAL INTERNET RESEARCH Veiga e Silva et al
The National Household Sample Survey (Pesquisa Nacional which confirms the hypothesis that there is a substantial
por Amostra de Domicílios, PNAD) of the IBGE compiles data underreporting not only in the number of deaths but also and
based on the socioeconomic characteristics of the Brazilian especially in the number of infections published by official
population [12]. By analyzing the number of deaths and government bodies.
population counts from the PNAD (Table 6), one can see the
Another relevant study, from Imperial College [7], estimated
differences in underreporting and number of deaths per 1 million
the COVID-19 impact in Brazilian states from February 25,
inhabitants for each city. The differences are also found in Table
2020 to May 6, 2020, using a hierarchical Bayesian model. This
5; there are several disagreements for underreporting bias for
model estimates the number of infections, deaths, and
COVID-19. The differences may have occurred due to the
reproduction. These fatality rates are estimated to be much more
distinct socioeconomic characteristics of each city, such as
optimistic than those from UFPel. The following fatality rates
demographic density, HDI, population age group, access to
were calculated: Belém (Pará: 0.9%), Fortaleza (Ceará: 1.1%),
health care, and number of intensive care unit (ICU) beds
Manaus (Amazon: 0.8%), Recife (Pernambuco: 1.1%), Rio de
available, etc.
Janeiro (Rio de Janeiro: 0.8%), and São Paulo (São Paulo:
São Paulo, for example, ended up with the least number of 0.7%).
deaths in terms of percentage (per population) and the least total
From the several fatality rates investigated (up to the time this
difference (percentagewise) in deaths for the period not covered
study was conducted), and considering the main countries
in the historical series (Table 5). Moreover, São Paulo has the
affected by the pandemic and number of predicted deaths in our
highest HDI (0.8) in Brazil. It has a one of the highest numbers
research, it is possible to estimate the number of infected cases
of ICU beds in the country—22.3 ICU beds per 100,000
and consequently estimate the percentage of underreporting of
inhabitants [27], which is much higher than necessary. On the
infected cases. Table 7 presents estimations of the numbers of
other hand, Manaus, one of the most affected cities in Brazil,
those that were infected in each city considering different fatality
showed the highest difference in records for the extrapolated
rates and also shows the estimated percentage of underreporting
period not covered in the historical series (Table 5) and the
of infected cases.
highest number of deaths (population wise) as well as
underreporting of deaths. Manaus has the lowest HDI (0.73) Depending on how high or low the fatality ratio is, there is
among the six capital cities and 9.63 ICU beds per 100,000 variation in the number of infected cases. For example, as seen
inhabitants, the smallest number among the considered cities. in Table 7, the number of cases for São Paulo is estimated to
be almost 76,000, considering the highest fatality ratio (Brazil,
In a recent study, EPICOVID19-BR, carried out by the Federal
6.6%), or approximately 715,000 when considering the lowest
University of Pelotas (UFPel) [28], researchers interviewed and
fatality ratio (Imperial College, 0.7%).
tested (for SARS-CoV-2) a group of people selected by lottery
in the cities identified as the most affected in the country. The Based on these differing fatality rates, underreported infection
objective was to estimate the number of infectees for each city. numbers may be monumental. For example, underreporting of
The first stage considered 133 cities from all Brazilian states infected cases in Manaus (using the fatality ratio from the
and took place between May 14-21, 2020. In this study, the Imperial College study [7]) and Belém (using the fatality ratio
authors reported the following percentage values of infection: from the EPICOVID19-BR study [28]) may reach 2880% and
Belém (15.10%), Fortaleza (8.7%), Manaus (12.5%), Recife 2837%, respectively. Such scenarios show, in both the cities, a
(3.2%), Rio de Janeiro (2.2%), and São Paulo (3.1%). count that is 30 times the number of confirmed cases. For other
capital cities, the numbers may be up to 11 (Recife), 12
In the context of EPICOVID19-BR, fatality rates were estimated
(Fortaleza), 17 (São Paulo), and almost 25 times (Rio de
using the total deaths predicted, along with the official figures
Janeiro).
of infections and the number of infections estimated by UFPel
[28]. The discrepancy between the official number of the fatality There were 739,503 confirmed cases and 38,406 official deaths,
rates—Belém (0.64%), Fortaleza (1.37%), Manaus (1.08%), as of June 9, 2020 [9]. If we consider the average percentage
Recife (2.82%), Rio de Janeiro (1.62%), and São Paulo of 40.7% for underreporting of deaths as shown in this study,
(2.22%)—becomes evident as there is much difference between Brazil would have around 64,746 deaths related to COVID-19.
official figures and counts reported by EPICOVID19-BR. These Considering the lowest and highest percentage of underreporting
rates are compatible with those found in several studies presented by the cities studied (Table 6), it would have around
[7,29,30]. Therefore, it is estimated that mortality values range 51,846 (25.9%) and 103,071(62.7%) deaths, respectively, thus,
from 0.64% (Belém) to 2.82% (Recife), and is much more estimating a much higher number of deaths than those officially
reliable with respect to officially published counts. Emphasis reported.
must be given to the results presented by UFPel (CI 4.8%),
http://www.jmir.org/2020/8/e21413/ J Med Internet Res 2020 | vol. 22 | iss. 8 | e21413 | p. 10
(page number not for citation purposes)
XSL• FO
RenderXJOURNAL OF MEDICAL INTERNET RESEARCH Veiga e Silva et al
Table 7. Estimated number of infection cases and percentage of cases underreported considering differing estimations in fatality rate.
Cities Official Fatality rate
(predicted number of deaths) counta
UFPelb [26] Imperial Col- China Brazil United Global
lege [7] (1.38%) [27] (6.6%) States (6%) (6.5%)
Belém (n=1433) 7675
Infections, n 225,404 159,222 103,841 21,712 23,883 22,046
Underreported (%) 2837 1975 1253 183 211 187
Fortaleza (n=2029) 1864
Infections, n 232,233 184,455 147,029 30,742 33,817 31,215
Underreported (%) 1146 889 689 65 81 67
Manaus (n=2936) 12,317
Infections, n 272,845 367,000 212,754 44,484 48,933 45,170
Underreported (%) 2115 2880 1627 261 297 267
Recife (n=1486) 11,584
Infections, n 52,663 135,091 107,681 22,515 24,767 22,861
Underreported (%) 355 1066 830 94 114 97
Rio de Janeiro (n=3763) 18,743
Infections, n 147,816 470,375 272,681 57,015 62,717 57,892
Underreported (%) 689 2410 1355 204 235 209
São Paulo (n=5003) 41,451
Infections, n 379,813 714,714 362,536 75,803 83,383 76,969
Underreported (%) 816 1624 775 83 101 86
a
As of May 21, 2020.
b
UFPel: Federal University of Pelotas.
Regarding the number of those infected by the pandemic, based number of daily new cases. We compared the evolution of
on the value previously calculated for the number of total deaths weekly confirmed cases from United States and Brazil, up to
(40.7%, 64,746 deaths), it can be inferred that Brazil’s count of June 9th. The reduction in the number of occurrences in the
infection ranges between 981,013 and 5,395,571 (considering United States indicates that the curve is flattening. In contrast,
respectively the highest and lowest lethality rate, 6.6% and the number of weekly confirmed cases in Brazil is still
1.2%, respectively [7]). Hence, it is reasonable to assume that increasing. This ascending curve indicates that the pandemic is
Brazil either is, or may become in the near future, the new still growing, tending to surpass the official number of infected
epicenter of the COVID-19 pandemic, surpassing the United Americans in the near future when considering the official
States, which of June 9, 2020, has the highest number of infected numbers. If we consider the highest lethality rates presented in
persons (n=1,933,560) [8]. this work, the actual number of infected Brazilian citizens would
have already surpassed that of the United States.
When comparing both countries, the United States currently
performs more tests for the disease than any other country in Conclusions
the world [31]. According to WorldoMeter [15], the United The significant rates of underreporting of deaths presented in
States has conducted 22,624,758 tests—70,799 tests per 1 our research indicate that the counts released by the official
million inhabitants. These numbers are well ahead of Brazil, Brazilian internet portals are much lower than the actual
which so far has conducted a total of 1,182,581 tests—5566 numbers, making it impossible for the authorities to take more
tests per 1 million inhabitants. Thus, with the testing coverage effective action. This is also confusing to citizens, who have
in the United States being much larger, the actual impact of the demonstrated failure to comply with social isolation measures.
pandemic can be more realistically analyzed in that country Therefore, a public access portal is being developed in order to
and, therefore, in comparison to Brazil, more effective actions disseminate more realistic and reliable data on the pandemic,
can be carried out to control the disease. in order to undo the contradictions of official data, guide the
It is also worth considering the tendency to flatten the evolution population, formulate policies, and estimate the R factor more
curve of COVID-19, which represents the reduction in the efficiently.
http://www.jmir.org/2020/8/e21413/ J Med Internet Res 2020 | vol. 22 | iss. 8 | e21413 | p. 11
(page number not for citation purposes)
XSL• FO
RenderXJOURNAL OF MEDICAL INTERNET RESEARCH Veiga e Silva et al
Our results suggest a growing pandemic and reveal a wide The number of deaths due to SARS was considerably higher
heterogeneity in the outbreak of the epidemic in the cities than the expected number for all six cities, indicating that a
considered in this case study, suggesting a greater number of large number of deaths related to COVID-19 were possibly
underreporting in deaths and infected cases in some cities. This mistakenly recorded as SARS. It is assumed that this is due to
demonstrates differing levels of the outbreak stage, more lack of confirmation and delays in testing or confusion in
advanced in some cities compared to others. However, in no diagnosis, since COVID-19 is a new disease. Furthermore,
city do the results indicate that herd immunity is close to being delays in disclosing test results also impact the effect and reach
achieved. In addition, the underreporting of deaths is not of the pandemic. Therefore, it is of paramount importance to
stationary over time and may increase during the pandemic increase testing in order to reduce underreporting and encourage
period. rapid dissemination of test results to allow for a closer view of
the real COVID-19 situation in Brazil.
Acknowledgments
The authors would like to thank CEPID CeMEAI and FAPESP (process 2013/07375-0) for supporting this work.
Conflicts of Interest
None declared.
References
1. Guo Y, Cao Q, Hong Z, Tan Y, Chen S, Jin H, et al. The origin, transmission and clinical therapies on coronavirus disease
2019 (COVID-19) outbreak - an update on the status. Mil Med Res 2020 Mar 13;7(1):11 [FREE Full text] [doi:
10.1186/s40779-020-00240-0] [Medline: 32169119]
2. Lu R, Zhao X, Li J, Niu P, Yang B, Wu H, et al. Genomic characterisation and epidemiology of 2019 novel coronavirus:
implications for virus origins and receptor binding. The Lancet 2020 Feb;395(10224):565-574. [doi:
10.1016/S0140-6736(20)30251-8]
3. Phelan AL, Katz R, Gostin LO. The Novel Coronavirus Originating in Wuhan, China: Challenges for Global Health
Governance. JAMA 2020 Jan 30;323(8):709-710 [FREE Full text] [doi: 10.1001/jama.2020.1097] [Medline: 31999307]
4. Coronavirus disease (COVID-19) situation reports - 51. World Health Organization. 2020 Mar 11. URL: https://www.
who.int/docs/default-source/coronaviruse/situation-reports/20200311-sitrep-51-covid-19.pdf?sfvrsn=1ba62e57_10 [accessed
2020-05-20]
5. Fagherazzi G, Goetzinger C, Rashid MA, Aguayo GA, Huiart L. Digital Health Strategies to Fight COVID-19 Worldwide:
Challenges, Recommendations, and a Call for Papers. J Med Internet Res 2020 Jun 16;22(6):e19284 [FREE Full text] [doi:
10.2196/19284] [Medline: 32501804]
6. Li R, Pei S, Chen B, Song Y, Zhang T, Yang W, et al. Substantial undocumented infection facilitates the rapid dissemination
of novel coronavirus (SARS-CoV-2). Science 2020 May 01;368(6490):489-493 [FREE Full text] [doi:
10.1126/science.abb3221] [Medline: 32179701]
7. Mellan T, Hoeltgebaum H, Mishra S. Report 21: Estimating COVID-19 cases and reproduction number in Brazil. Imperial
College COVID-19 Response Team. 2020 May 8. URL: https://www.imperial.ac.uk/media/imperial-college/medicine/
mrc-gida/2020-05-08-COVID19-Report-21.pdf [accessed 2020-05-15]
8. WHO Coronavirus Disease (COVID-19) Dashboard. World Health Organization. 2020. URL: https://covid19.who.int/
[accessed 2020-05-03]
9. Coronavírus Brasil COVID-19. Ministério da Saúde. 2020. URL: https://covid.saude.gov.br [accessed 2020-06-01]
10. Instituto Brasileiro de Geografia e Estatística. 2020. URL: https://www.ibge.gov.br/en/home-eng.html [accessed 2020-05-25]
11. Dana S, Simas A, Filardi B, Rodriguez R, Valiengo L, Neto J. Brazilian Modeling of COVID-19 (BRAM-COD): a Bayesian
Monte Carlo approach for COVID-19 spread in a limited data set context. medRxiv 2020:e [FREE Full text] [doi:
10.1101/2020.04.29.20081174]
12. Sistema agregador de informações do IBGE sobre os municípios e estados do Brasil (IBGE's aggregated information system
on Brazilian municipalities and states). Instituto Brasileiro de Geografia e Estatística Cidades. 2019. URL: https://cidades.
ibge.gov.br/ [accessed 2020-06-03]
13. Análise subnotificação (Underreporting analysis). COVID-19 Brasil. 2020 Apr 11. URL: https://ciis.fmrp.usp.br/covid19/
analise-subnotificacao/ [accessed 2020-05-14]
14. Our World in Data. 2020 May 19. URL: https://ourworldindata.org/covid-testing-us-uk-korea-italy [accessed 2020-05-25]
15. COVID-19 Coronavirus Pandemic. WorldoMeters. 2020. URL: https://www.worldometers.info/coronavirus [accessed
2020-05-25]
16. Coronavirus. Google Trends. 2020. URL: https://trends.google.com.br/trends/story/US_cu_4Rjdh3ABAABMHM_en_pt-BR
[accessed 2020-07-22]
17. Brazil - Trending Topics. Twitter Trending. 2020. URL: https://www.twitter-trending.com/brazil/en [accessed 2020-07-22]
http://www.jmir.org/2020/8/e21413/ J Med Internet Res 2020 | vol. 22 | iss. 8 | e21413 | p. 12
(page number not for citation purposes)
XSL• FO
RenderXJOURNAL OF MEDICAL INTERNET RESEARCH Veiga e Silva et al
18. Sesagiri Raamkumar A, Tan SG, Wee HL. Measuring the Outreach Efforts of Public Health Authorities and the Public
Response on Facebook During the COVID-19 Pandemic in Early 2020: Cross-Country Comparison. J Med Internet Res
2020 May 19;22(5):e19334 [FREE Full text] [doi: 10.2196/19334] [Medline: 32401219]
19. DATASUS - Ministério da Saúde. 2020. URL: http://www2.datasus.gov.br/DATASUS/index.php?area=0901 [accessed
2020-05-05]
20. Especial COVID-19. Portal da Transparência do Registro Civil. 2020. URL: https://transparencia.registrocivil.org.br/
especial-covid [accessed 2020-05-23]
21. Fayyad UM, Piatetsky-Shapiro G, Smyth P, Uthurusamy R. Advances in knowledge discovery & data mining (1st edition).
Menlo Park, California: American Association for Artificial Intelligence; 1996.
22. World Health Organization. ICD-10: international statistical classification of diseases and related health problems: tenth
revision. 2004. URL: https://apps.who.int/iris/bitstream/handle/10665/42980/9241546530_eng.pdf [accessed 2020-05-12]
23. Taylor A, Letham B. Forecasting at Scale. PeerJ Preprints 2017:e [FREE Full text] [doi: 10.7287/peerj.preprints.3190v1]
24. Harvey AC, Peters S. Estimation procedures for structural time series models. J Forecast 1990 Mar;9(2):89-108. [doi:
10.1002/for.3980090203]
25. Zhu C, Byrd R, Lu P, Nocedal J. BFGS-B: a limited memory FORTRAN code for solving bound constrained optimization
problems. Evanston, IL: EECS Department, Northwestern University; 1994.
26. Peiris JSM, Guan Y, Yuen KY. Severe acute respiratory syndrome. Nat Med 2004 Dec 30;10(12 Suppl):S88-S97 [FREE
Full text] [doi: 10.1038/nm1143] [Medline: 15577937]
27. Sistema com informações sobre Leitos de UTI, do SUS e da rede privada, associados a quantidade de habitantes e ao número
de casos confirmados e de óbitos por COVID-19 (System with information on ICU, SUS and private network beds, associated
with the number of inhabitants and the number of confirmed cases and deaths due to COVID-19). Instituto Brasileiro de
Geografia e Estatística e Fundação Oswaldo Cruz. 2020. URL: https://leitos-ibgedgc.hub.arcgis.com/ [accessed 2020-06-03]
28. COVID-19 no Brasil: várias epidemias num só país Primeira fase do EPICOVID19 reforça preocupação com a região Norte
(COVID-19 in Brazil: several epidemics in one country first phase of EPICOVID19 reinforces concern with the Northern
region). EPICOVID19. 2020 May 25. URL: https://wp.ufpel.edu.br/covid19/files/2020/05/
EPICOVID19BR-release-fase-1-Portugues.pdf [accessed 2020-05-26]
29. Russell T, Hellewell J, Abbott S, Golding N, Gibbs H, Jarvis CI, et al. Using a delay-adjusted case fatality ratio to estimate
under-reporting. CMMID Repository. 2020. URL: https://cmmid.github.io/topics/covid19/global_cfr_estimates.html
[accessed 2020-06-07]
30. Baud D, Qi X, Nielsen-Saines K, Musso D, Pomar L, Favre G. Real estimates of mortality following COVID-19 infection.
The Lancet 2020 Mar 12;20(7):P773 [FREE Full text] [doi: 10.1016/S1473-3099(20)30195-X] [Medline: 26745243]
31. How Does Testing in the U.S. Compare to Other Countries? Johns Hopkins University of Medicine. 2020 Jun 11. URL:
https://coronavirus.jhu.edu/testing/international-comparison [accessed 2020-06-09]
Abbreviations
COVID-19: coronavirus disease
DATASUS: Department of Informatics of the Unified Healthcare System
GDP: gross domestic product
HDI: Human Development Index
IBGE: Brazilian Institute of Geography and Statistics
ICD-10: International Statistical Classification of Diseases and Related Health Problems–10th Revision
PNAD: Pesquisa Nacional por Amostra de Domicílios (National Household Sample Survey)
R: reproduction number
RT-PCR: reverse transcription polymerase chain reaction
SARS: severe acute respiratory syndrome
SARS-CoV: severe acute respiratory syndrome coronavirus
SARS-CoV-2: severe acute respiratory syndrome coronavirus 2
SIM: Mortality Information System
SUS: Sistema Único de Saúde (Unified Healthcare System)
UFPel: Federal University of Pelotas
WHO: World Health Organization
http://www.jmir.org/2020/8/e21413/ J Med Internet Res 2020 | vol. 22 | iss. 8 | e21413 | p. 13
(page number not for citation purposes)
XSL• FO
RenderXJOURNAL OF MEDICAL INTERNET RESEARCH Veiga e Silva et al
Edited by G Eysenbach, G Fagherazzi; submitted 14.06.20; peer-reviewed by B Chen, A Rovetta; comments to author 18.07.20;
revised version received 25.07.20; accepted 26.07.20; published 18.08.20
Please cite as:
Veiga e Silva L, de Andrade Abi Harb MDP, Teixeira Barbosa dos Santos AM, de Mattos Teixeira CA, Macedo Gomes VH, Silva
Cardoso EH, S da Silva M, Vijaykumar NL, Venâncio Carvalho S, Ponce de Leon Ferreira de Carvalho A, Lisboa Frances CR
COVID-19 Mortality Underreporting in Brazil: Analysis of Data From Government Internet Portals
J Med Internet Res 2020;22(8):e21413
URL: http://www.jmir.org/2020/8/e21413/
doi: 10.2196/21413
PMID:
©Lena Veiga e Silva, Maria Da Penha de Andrade Abi Harb, Aurea Milene Teixeira Barbosa dos Santos, Carlos André de Mattos
Teixeira, Vitor Hugo Macedo Gomes, Evelin Helena Silva Cardoso, Marcelino S da Silva, N L Vijaykumar, Solon Venâncio
Carvalho, André Ponce de Leon Ferreira de Carvalho, Carlos Renato Lisboa Frances. Originally published in the Journal of
Medical Internet Research (http://www.jmir.org), 18.08.2020. This is an open-access article distributed under the terms of the
Creative Commons Attribution License (https://creativecommons.org/licenses/by/4.0/), which permits unrestricted use, distribution,
and reproduction in any medium, provided the original work, first published in the Journal of Medical Internet Research, is
properly cited. The complete bibliographic information, a link to the original publication on http://www.jmir.org/, as well as this
copyright and license information must be included.
http://www.jmir.org/2020/8/e21413/ J Med Internet Res 2020 | vol. 22 | iss. 8 | e21413 | p. 14
(page number not for citation purposes)
XSL• FO
RenderXYou can also read