Reliability and Generalizability of Similarity-Based Fusion of MEG and fMRI Data in Human Ventral and Dorsal Visual Streams
←
→
Page content transcription
If your browser does not render page correctly, please read the page content below
vision
Article
Reliability and Generalizability of Similarity-Based
Fusion of MEG and fMRI Data in Human Ventral and
Dorsal Visual Streams
Yalda Mohsenzadeh 1, *,† , Caitlin Mullin 1,† , Benjamin Lahner 1,2 , Radoslaw Martin Cichy 3
and Aude Oliva 1
 1    Computer Science and AI Lab., Massachusetts Institute of Technology, Cambridge, MA 02139, USA;
      crmullin@csail.mit.edu (C.M.); oliva@mit.edu (A.O.)
 2    Department of Biomedical Engineering, Boston University, Boston, MA 02215, USA; blahner@bu.edu
 3    Department of Education and Psychology, Freie Universität Berlin, Berlin 14195, Germany;
      rmcichy@zedat.fu-berlin.de
 *    Correspondence: yalda@mit.edu
 †    These authors contributed equally.

 Received: 22 October 2018; Accepted: 13 January 2019; Published: 10 February 2019

 Abstract: To build a representation of what we see, the human brain recruits regions throughout the
 visual cortex in cascading sequence. Recently, an approach was proposed to evaluate the dynamics
 of visual perception in high spatiotemporal resolution at the scale of the whole brain. This method
 combined functional magnetic resonance imaging (fMRI) data with magnetoencephalography (MEG)
 data using representational similarity analysis and revealed a hierarchical progression from primary
 visual cortex through the dorsal and ventral streams. To assess the replicability of this method,
 we here present the results of a visual recognition neuro-imaging fusion experiment and compare
 them within and across experimental settings. We evaluated the reliability of this method by
 assessing the consistency of the results under similar test conditions, showing high agreement
 within participants. We then generalized these results to a separate group of individuals and visual
 input by comparing them to the fMRI-MEG fusion data of Cichy et al (2016), revealing a highly
 similar temporal progression recruiting both the dorsal and ventral streams. Together these results are
 a testament to the reproducibility of the fMRI-MEG fusion approach and allows for the interpretation
 of these spatiotemporal dynamic in a broader context.

 Keywords: spatiotemporal neural dynamics; vision; dorsal and ventral streams; multivariate pattern
 analysis; representational similarity analysis; fMRI; MEG

1. Introduction
     To solve visual object recognition, the human brain has developed a particular cortical topology
within the ventral and dorsal streams, recruiting regions in cascading sequence, to quickly build a
representation of what we see (i.e., [1–9]).
     In order to reveal the complex neural dynamics underlying visual object recognition, neural
representations must be resolved in both space and time simultaneously [10–15]. Towards this aim,
Cichy and collaborators proposed a novel approach to combine functional magnetic resonance imaging
(fMRI) with magnetoencephalography (MEG) termed MEG-fMRI fusion [8,9,16–18]. The results
revealed the dynamics of the visual processing cascade. Neural representations first emerge in the
occipital pole (V1, V2, V3) at around 80 ms, and then progress in the anterior direction along the
ventral (i.e., lateral-occipital cortex LO, ventral occipital cortex VO, temporal occipital cortex TO

Vision 2019, 3, 8; doi:10.3390/vision3010008                                    www.mdpi.com/journal/vision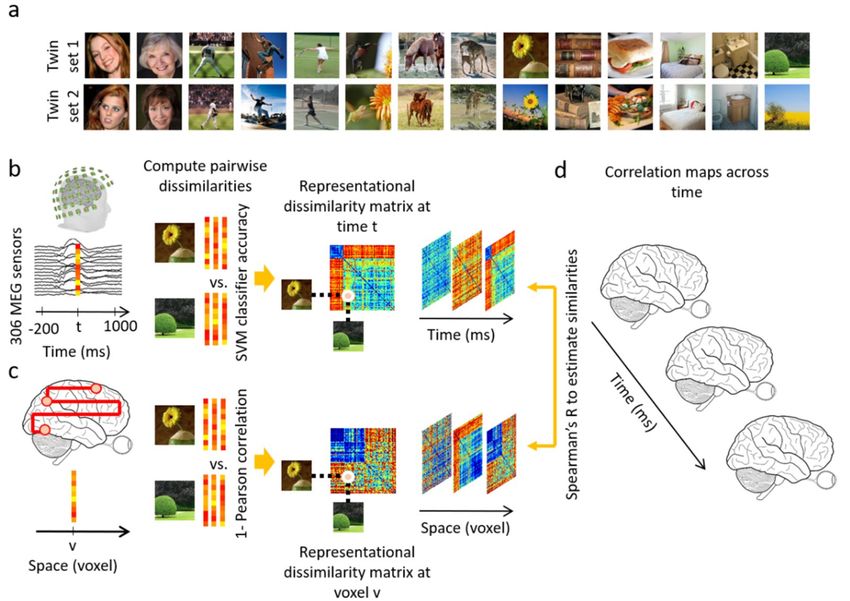
Vision 2019, 3, 8                                                                                     2 of 18

and parahippocampal cortex PHC) and dorsal (intraparietal sulcus regions) visual streams within
110–170 ms after image onset.
     The consistency of these results with established findings [19–26] suggests that fMRI-MEG
fusion is an appropriate analytical tool to non-invasively evaluate the spatiotemporal mechanisms
of perception. To assess the power of this technique to yield consistent results on visual recognition
dynamics in the human ventral and dorsal streams [27–29], here we replicate the standard design
and analysis protocol of fMRI-MEG fusion [9]. Specifically, we first evaluated the reliability of the
fusion method at capturing the spatiotemporal dynamics of visual perception by assessing the neural
agreement of visually similar experiences within individuals, asking: ‘Do similar visual experiences
obey similar spatiotemporal stages in the brain?’ Given the known variation across brain regions for
separate visual category input (e.g., [1,30–35]), our second objective was to determine the generalizability
of these patterns: ‘For a given task, which spatiotemporal properties are reproducible across diverse
visual input and independent observer groups?’
     The current results reveal that the established fusion method is reliable and generalizable within
and across image sets and participant groups. In addition, novel approaches to region-of-interest based
analyses validate the replicability of the spatio-temporal dynamics for highly similar visual content,
demonstrating the robustness of the technique for tracing representational similarity in the brain over
space and time.

2. Materials and Methods
     This paper presents two independent experiments in which fMRI and MEG data were acquired
when observers look at pictures of natural images. The fMRI and MEG data of Experiment 1 are
original to this current work. Data of Experiment 2 has been published originally in [9] (Experiment 2).

2.1. Participants
     Two separate groups of fifteen right-handed volunteers with normal or corrected to normal vision
participated in Experiment 1 (9 female, 27.87 ± 5.17 years old) and Experiment 2 (5 female, 26.6 ± 5.18
years old, see [9]). The participants signed an informed consent form and were compensated for their
participation. Both studies were conducted in accordance with the Declaration of Helsinki and approved
by the Institutional Review Board of Massachusetts Institute of Technology (Approval code: 1510287948).

2.2. Stimulus Set
     In Experiment 1, the stimulus set consisted of twin sets of 78 real-world natural images each
(156 images total) from the LaMem dataset [36]. Twin-set 1 and Twin-set 2 each contained an
image identifiable by the same verbal semantic description of the main object shown (based on
consensus among the authors; see Figure 1a for examples). The sets were not significantly different
on a collection of low level image statistics [37–39] (See Appendix A for more information about
stimulus set). The stimulus set of Experiment 2 consisted of 118 natural images of objects [9] from the
ImageNet dataset [40]. In both experiments, participants performed the same orthogonal vigilance
task. See Appendix A for details on the Experimental Design.

2.3. fMRI and MEG Acquisition
     MEG and fMRI data for Experiment 1 were acquired in separate sessions, similar to Experiment 2
in [9]. Images were presented 500 ms in all conditions. See Appendix B for data acquisition detail of
both experiments.

2.4. Data Analyses
     We performed several data analyses to test the robustness and generalizability of our results.
First, we performed a full brain fMRI-MEG fusion [8,9,16,17], which uses representational similarity
Vision 2019, 3, 8 3 of 18
analysis [41,42] to map MEG and fMRI data into a common space (see Appendix C for details).
To summarize, the MEG data were analyzed in a time-resolved manner with 1 ms resolution. MEG
sensor data at each time point were arranged in pattern vectors for each stimulus condition and
repetition. To overcome computational complexity and reduce noise, trials per image condition were
randomly sub-averaged in groups of 3 in Experiment 1, and groups of 5 in Experiment 2. These vectors
were then used to train support vector machines to classify each pair of conditions. The performance of
the binary SVM classifiers computed with leave-one-out cross validation procedure were interpreted as
a pairwise dissimilarity measure (higher decoding indicates larger dissimilarity) and used to construct
a condition by condition representational dissimilarity matrix (RDM) per time point (Figure 1b).
The fMRI data were analyzed with a searchlight approach to construct the representational dissimilarity
matrices in a voxel-resolved fashion. At every voxel in the brain, the condition-specific voxel patterns
in its vicinity were extracted and pairwise condition-specific dissimilarities (1-Pearson’s R) were
computed to create a condition by condition fMRI RDM assigned to that voxel (Figure 1c). Then,
in the similarity space of RDMs, MEG and fMRI data were directly compared (Spearman’s R) to
integrate high spatial resolution of fMRI with high temporal resolution of MEG. In detail, for a given
time point the MEG RDM was correlated with fMRI RDMs specified with the searchlight method
resulting in a 3D correlation map. Repeating the procedure for all time points as depicted in Figure 1d
resulted in a 4D spatiotemporal correlation map per individual. The correlation maps were averaged
over individuals and significant correlations were determined with permutation tests and multiple
comparison corrections over time and space with cluster correction method (N = 15 in each experiment;
cluster-definition threshold of 0.001 and cluster size threshold of 0.01). The detail on statistical tests are
presented in Appendix F.
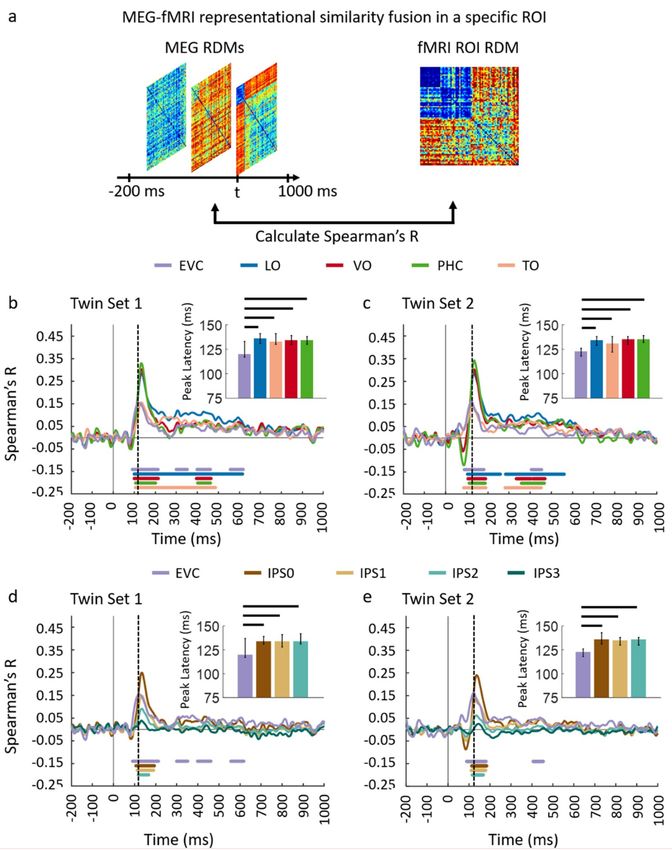
Figure 1. Examples of stimuli of Experiment 1 and analysis scheme. (a) Examples of experimental
condition: The stimulus set consisted of two sets (termed twin-sets 1 and 2) of 78 object images each
ordered in pairs, such that each set was of the same semantic content but different in appearance.
(b) MEG multivariate analysis. MEG data were extracted from −200 ms to 1000 ms with respect to
stimulus onset. The 306-dimensional MEG sensor data at each time point t were arranged in vectors.
For each pair of conditions, the performance of an SVM classifier in discriminating the conditions
based on vector patterns was used as a measure of dissimilarity between the pair of conditions.
A representational dissimilarity matrix at each time point t was populated using these pairwise
dissimilarities; (c) fMRI multivariate analysis. At each voxel v, the activation patterns in a sphere with
radius of 4 voxels were extracted and pairwise dissimilarities of conditions were computed (1-Pearson’s
R) yielding a representational dissimilarity matrix assigned to the voxel v at the center of the sphere;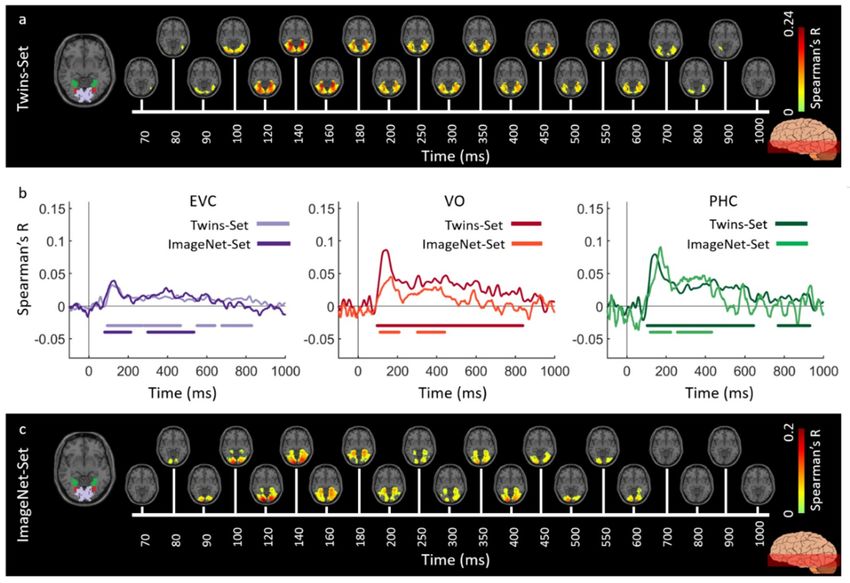
Vision 2019, 3, 8                                                                                      4 of 18

      (d) fMRI-MEG similarity-based fusion. The MEG RDM representation at each time point t were
      compared with the fMRI RDM representations at each voxel v by computing Spearman’s R correlations.
      These computations resulted in correlation maps over the whole brain and across time.

      Second, to quantitatively compare the spatiotemporal neural dynamics within and across the
experiments and show how reliable they are, we performed two types of anatomically-defined
region-of-interest (ROI) based analysis along ventral and dorsal streams (see Appendix D for detail):
(1) a spatially restricted searchlight voxel-wise analysis: in this analysis, the searchlight based MEG-fMRI
fusion correlation time series are averaged over voxels within an ROI; (2) the conventional ROI-based
analysis: in this analysis, the condition-specific voxel responses within an ROI are extracted, and the
pairwise condition-specific response dissimilarities are computed to create an ROI RDM which is then
compared with the time-resolved MEG RDMs resulting in correlation time series (as in [9]).

3. Results

3.1. Reliability of Similarity-Based fMRI-MEG Fusion Method
     We first assessed the reliability of the fMRI-MEG similarity-based data fusion method. For this we
applied fMRI-MEG fusion separately to the two sets of images making up the Twins-set (i.e., Twin-set 1
and Twin-set 2) and compared the results.
     Figures 2 and 3 show the spatiotemporal dynamics of visual perception in the ventral and
dorsal visual pathways respectively for the Twins-sets over the time course of 1000 ms. Qualitatively
examining these results reveal that the neural representations start at the occipital pole around 70–90 ms
after stimulus onset, followed by neural representations in the anterior direction along the ventral
stream (Figure 2a,c), and along the dorsal stream up to the inferior parietal cortex (Figure 3a,c).
     To quantitatively compare the spatiotemporal fusion maps between the Twin-sets we performed
spatially restricted voxel-wise fMRI-MEG fusion on five regions-of-interest (ROIs) (early visual cortex
(EVC), ventral occipital area (VO), parahippocampal cortex (PHC), and inferior parietal sulci (IPS0
and IPS1). We averaged the correlation values over the voxels within each ROI resulting in one
correlation time series per individual (see Appendix D, spatially restricted searchlight voxel-wise
fMRI-MEG fusion method). Figures 2b and 3b compare the ROI-specific time courses for Twin-set 1 and
2. We observe that the two sets result in similar temporal dynamics within the regions of interest across
ventral and dorsal pathways. While the analyses reported in Figures 2b and 3b tests for similarity of
time courses, we further investigated whether there are any significant dissimilarities. This explicit test
however revealed no significant differences (permutation tests, n = 15; cluster-definition threshold of
P < 0.01, and cluster size threshold of P < 0.01). This demonstrates the reliability of the fusion method
in reproducing similar patterns of neural activity across similar visual experiences.
     Next, we performed an ROI-based fMRI-MEG fusion following the method described in [8,9] (see
Figure 4a). Studied ROIs (see details in Appendix D) include EVC, ventral regions (VO, TO, PHC)
and dorsal regions (IPS0, IPS1, IPS2, and IPS3). As depicted in Figure 4b–e panels, the ROI-based
fMRI-MEG fusion results in visually similar time series. Comparison of peak latency times show a
peak of response around 120 ms in EVC and significantly later (two-sided hypothesis test, all P < 0.01,
FDR corrected), around 140 ms in ventral and dorsal ROIs. The peak latency and onset times with
their corresponding 95% confidence intervals are reported in Table 1.
     To assess reproducibility of the full brain 4D spatiotemporal maps (time x voxel x voxel x voxel)
between Twin set 1 and 2, for each participant separately, we compared the voxel-wise fMRI-MEG
correlation time series of Twin set 1 with Twin set 2. This resulted in one 3D reliability (correlation)
map per participant (see Appendix E). We assessed significance by permutation tests and corrected
for multiple comparisons using the cluster correction method (n = 15; cluster-definition threshold of
P < 0.01, and cluster size threshold of P < 0.01). This revealed significant clusters in the reliability map
across both the ventral and the dorsal stream (Figure 5).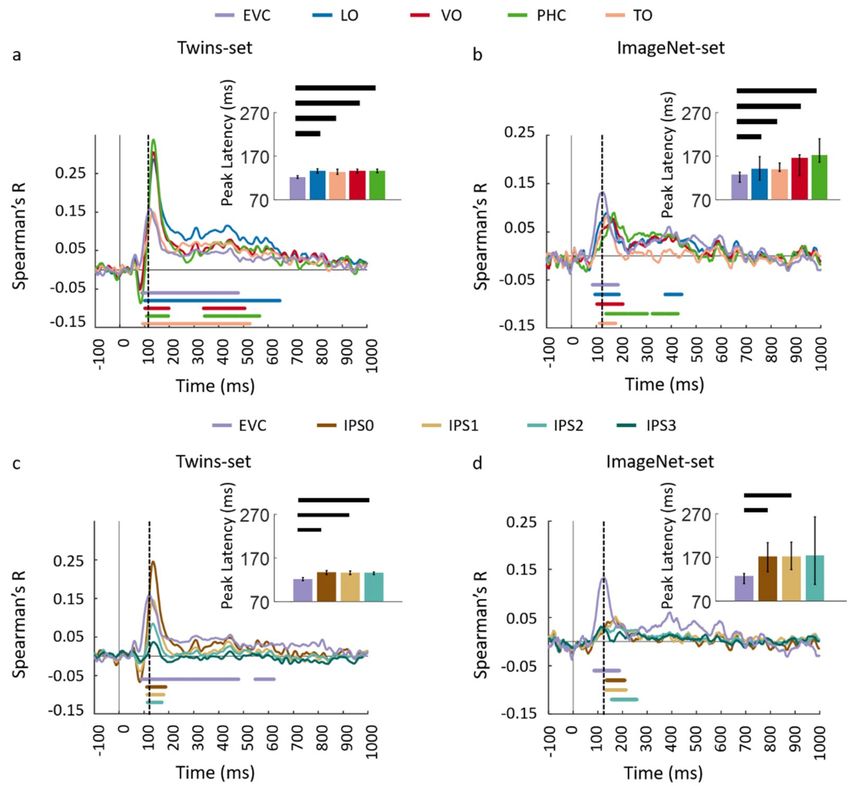
Vision 2019, 3, 8                                                                                        5 of 18

3.2. Generalizability of Similarity-Based fMRI-MEG Fusion Method
      We evaluated the generalizability of the fMRI-MEG similarity-based data fusion method
by comparing results across participant groups presented with different images (Twins-Set and
ImageNet-Set from Experiment 2 of [9]). We applied the fMRI-MEG similarity-based data fusion
method to Twins-set and ImageNet-set, separately. Figures 6 and 7 display the spatiotemporal
dynamics of visual perception for the two datasets along the ventral and dorsal visual pathways,
respectively, over the first 1000 ms from stimulus onset. In both cases, the significant signals emerge in
EVC around 70–80 ms after stimulus onset and then in the anterior direction along the ventral stream
(Figure 6a,c), and across the dorsal stream up to the inferior parietal cortex (Figure 7a,c). We determined
significant spatiotemporal correlations with sign-permutation tests (n = 15; P < 0.01 cluster-definition
threshold, P < 0.01 cluster threshold).
      Qualitatively, Figures 6b and 7b show similar MEG-fMRI time courses for the two datasets
(Twins-Set and ImageNet-Set) in EVC, ventral regions (VO and PHC) and dorsal regions (IPS0 and
IPS1). Further explicit testing revealed no significant difference between the two sets (permutation
tests, n = 15; cluster-definition threshold of P < 0.01, and cluster size threshold of P < 0.01).
      To further investigate the similarities and dissimilarities between these two sets of data
quantitatively, we performed ROI-based analyses. For each dataset, we correlated ROI-specific fMRI
RDMs with time-resolved MEG RDMs resulting in correlation time courses shown in Figure 8a–d.
We determined significant time points illustrated with color coded lines below the graphs with
sign-permutation tests (n = 15; P < 0.01 cluster-definition threshold, P < 0.01 cluster threshold).
We observed that in both datasets, correlation time series peak significantly earlier in EVC compared
to high level regions in ventral (VO and PHC) and dorsal (IPS0, IPS1, IPS2) pathways (two-sided
hypothesis test, all P < 0.01, FDR corrected) reflecting the established structure of the visual hierarchy.
Peak and onset latencies of curves in Figure 8a–d and their corresponding 95% confidence intervals
are reported in Table 2.

      Figure 2. Experiment 1 Twins-set spatiotemporal neural dynamics of vision in ventral stream: (a) An
      axial slice encompassing early visual cortex (EVC) and ventral ROIs, ventral occipital (VO) area and
      parahippocampal cortex (PHC).
Vision 2019, 3, 8                                                                                               6 of 18

      The significant correlation maps for Twin-set 1 in this axial slice depicted over time (n = 15,
      cluster-definition threshold P < 0.001, cluster threshold P < 0.01); (b) The correlation time series
      are computed based on spatially restricted searchlight voxel-wise fusion analysis (see Methods).
      The depicted curves from left to right compare these time series in EVC and ventral ROIs VO and
      PHC for Twin-set 1 and Twin-set 2. Significant time points depicted with color coded lines below
      the graphs are determined with sign-permutation tests (n = 15; P < 0.01 cluster-definition threshold,
      P < 0.01 cluster threshold); (c) The significant correlation maps for Twin-set 2 in the same axial slice as
      (a) depicted over time (n = 15, cluster-definition threshold P < 0.001, cluster threshold P < 0.01).

      Figure 3. Experiment 1 Twins-set spatiotemporal neural dynamics of vision in dorsal stream: (a) An
      axial slice encompassing early visual cortex (EVC) and dorsal ROIs, inferior parietal sulcus (IPS0
      and IPS1). The significant correlation maps for Twin-set 1 in this axial slice depicted over time
      (n = 15, cluster-definition threshold P < 0.001, cluster threshold P < 0.01); (b) The correlation time
      series are computed based on spatially restricted searchlight voxel-wise fusion analysis (see Methods).
      The depicted curves from left to right compare these time series in EVC and dorsal ROIs, IPS0 and IPS1
      for Twin-set1 and Twin-set2. Significant time points depicted with color coded lines below the graphs
      are determined with sign-permutation tests (n = 15; P < 0.01 cluster-definition threshold, P < 0.01 cluster
      threshold); (c) The significant correlation maps for Twin-set 2 in the same axial slice as (a) depicted
      over time (n = 15, cluster-definition threshold P < 0.001, cluster threshold P < 0.01).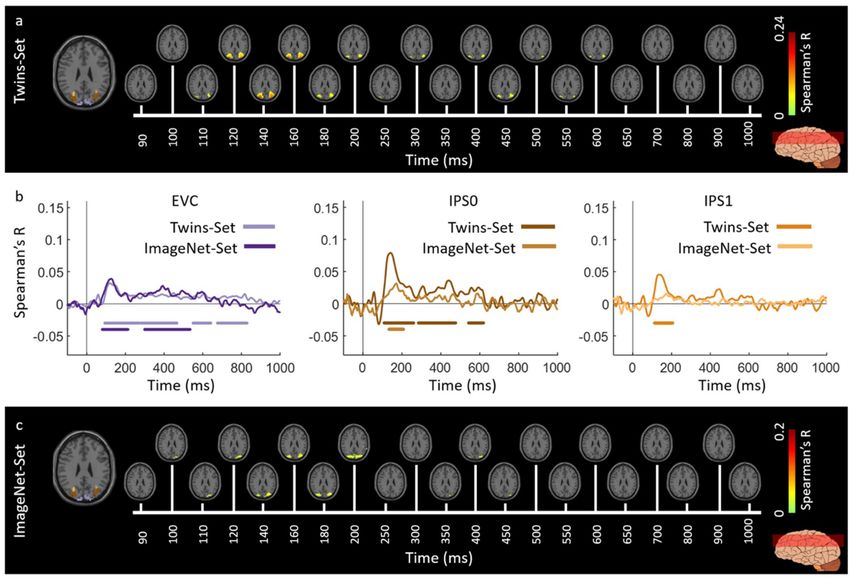
Vision 2019, 3, 8                                                                                               7 of 18

      Figure 4. Comparing dorsal and ventral stream neural representations through similarity-based ROI
      fMRI-MEG fusion. (a) The voxel patterns are extracted from each ROI to construct the fMRI ROI
      RDM. Then the ROI-specific fMRI RDM was compared with time-resolved MEG RDMs resulting in
      correlation time series for each region of interest; (b,c) The fMRI-MEG fusion time series are depicted in
      EVC and ventral ROIs, LO, VO, PHC, and TO for Set 1 and 2, respectively; (d,e) The fMRI-MEG fusion
      time series are depicted in EVC and dorsal ROIs, IPS0-3 for Twin-set 1 and Twin-set 2, respectively.
      The color-coded lines below the curves indicate significant time points (n = 15, cluster-definition
      threshold P < 0.01, cluster threshold P < 0.01) and the dashed vertical line in each plot indicates the
      peak latency in EVC time series. Peak latency times and their corresponding 95% confidence intervals
      for correlation time series in bcde are illustrated with barplots and error bars, respectively. Black lines
      above the bar indicate significant differences between conditions. 95% confidence intervals were found
      with bootstrap tests and barplots were evaluated with two-sided hypothesis tests; false discovery rate
      corrected at P < 0.05.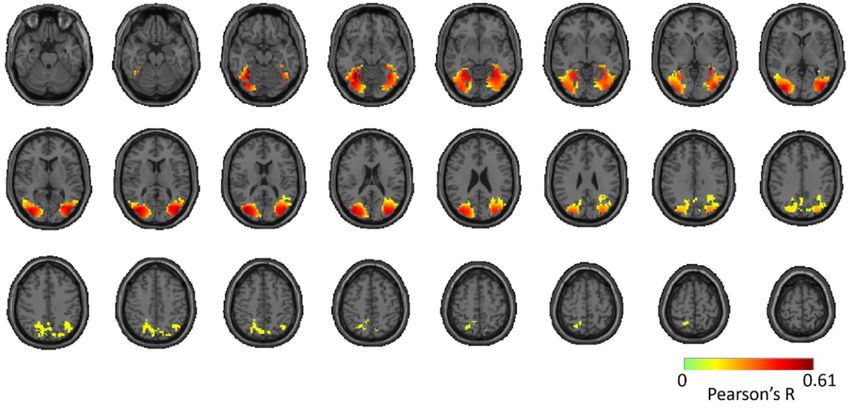
Vision 2019, 3, 8                                                                                                 8 of 18

      Figure 5. Reliability map of MEG-fMRI fusion time courses for Twin set 1 and Twin set 2. The figure
      shows significant clusters projected onto a standard T1 MNI brain. Significant correlations are
      determined with permutation tests and multiple comparison corrections using cluster correction
      method (n = 15; cluster-definition threshold of P < 0.01, and cluster size threshold of P < 0.01).

      Figure 6. Spatiotemporal neural dynamics of vision in ventral stream: (a) An axial slice encompassing
      early visual cortex (EVC) and ventral ROIs, occipital (VO) area and parahippocampal cortex (PHC).
      The significant correlation maps for Twins-set (Experiment 1) in this axial slice depicted over time
      (n = 15, cluster-definition threshold P < 0.001, cluster threshold P < 0.01); (b) The correlation time series
      are computed based on spatially restricted searchlight voxel-wise fusion analysis (see Methods).
      The depicted curves from left to right compare these time series in EVC and ventral ROIs VO
      and PHC for Twins-set (Experiment 1) and ImageNet-set (Experiment 2). Significant time points
      depicted with color coded lines below the graphs are determined with sign-permutation tests (n = 15;
      P < 0.01 cluster-definition threshold, P < 0.01 cluster threshold); (c) The significant correlation maps for
      ImageNet-set (Experiment 2) in the same axial slice as (a) depicted over time (n = 15, cluster-definition
      threshold P < 0.001, cluster threshold P < 0.01).
Vision 2019, 3, 8 9 of 18
Figure 7. Spatiotemporal neural dynamics of vision in dorsal stream: (a) An axial slice encompassing
early visual cortex (EVC) and dorsal ROIs, inferior parietal sulcus (IPS0 and IPS1). The significant
correlation maps for Twins-set (Experiment 1) in this axial slice depicted over time (n = 15,
cluster-definition threshold P < 0.001, cluster threshold P < 0.01); (b) The correlation time series
are computed based on spatially restricted searchlight voxel-wise fusion analysis (see Methods).
The depicted curves from left to right compare these time series in EVC and dorsal ROIs, IPS0
and IPS1 for Twins-set (Experiment 1) and ImageNet-set (Experiment 2). Significant time points
depicted with color coded lines below the graphs are determined with sign-permutation tests (n = 15;
P < 0.01 cluster-definition threshold, P < 0.01 cluster threshold); (c) The significant correlation maps for
ImageNet-set (Experiment 2) in the same axial slice as (a) depicted over time (n = 15, cluster-definition
threshold P < 0.001, cluster threshold P < 0.01).Vision 2019, 3, 8 10 of 18
Figure 8. Comparing dorsal and ventral stream neural representations through similarity-based
ROI fMRI-MEG fusion. The voxel patterns are extracted from each ROI to construct the fMRI ROI
RDM. Then the ROI-specific fMRI RDM was compared with time-resolved MEG RDMs resulting
in correlation time series for each region of interest; (a,b) The fMRI-MEG fusion time series are
depicted in EVC and ventral ROIs, LO, VO, PHC, and TO for Twins-set and ImageNet-set, respectively;
(c,d) The fMRI-MEG fusion time series are depicted in EVC and dorsal ROIs, IPS0-3 for Twins-set and
ImageNet-set, respectively. The color-coded lines below the curves indicate significant time points
(n = 15, cluster-definition threshold P < 0.01, cluster threshold P < 0.01) and the dashed vertical line in
each plot indicates the peak latency in EVC time series. Peak latency times and their corresponding
95% confidence intervals for correlation time series in bcde are illustrated with barplots and error
bars, respectively. Black lines above the bar indicate significant differences between conditions. 95%
confidence intervals were found with bootstrap tests and barplots were evaluated with two-sided
hypothesis tests; false discovery rate corrected at P < 0.05.
Table 1. Peak and onset latency for fMRI-MEG fusion time series in EVC, ventral, and dorsal regions
for Twin-Set 1 and Twin-Set 2 (Experiment 1).
Twin-Set 1 Twin-Set 2
Region of Interest
Peak latency (ms) Onset latency (ms) Peak latency (ms) Onset latency (ms)
EVC 120 (117–137) 92 (85–99) 123 (118–126) 90 (51–94)
Dorsal regions
IPS0 134 (131–139) 107 (97–116) 136 (131–143) 113 (107–118)
IPS1 134 (128–141) 113 (102–123) 135 (130–138) 111 (105–116)
IPS2 134 (131–142) 118 (95–156) 136 (130–138) 116 (107–126)Vision 2019, 3, 8 11 of 18
Table 1. Cont.
Twin-Set 1 Twin-Set 2
Region of Interest
Peak latency (ms) Onset latency (ms) Peak latency (ms) Onset latency (ms)
Ventral regions
LO 136 (131–141) 101 (95–107) 134 (129–138) 105 (100–108)
VO 134 (130–139) 100 (95–105) 135 (130–138) 104 (99–111)
TO 133 (130–141) 104 (92–111) 131 (122–138) 85 (73–101)
PHC 134 (130–138) 106 (99–113) 135 (132–139) 112 (107–116)
Values are averaged over n = 15 subjects with 95% confidence intervals reported in parentheses.
Table 2. Peak and onset latency for fMRI-MEG fusion time series in EVC, ventral, and dorsal regions
for Twins-Set (Experiment 1) and ImageNet-Set (Experiment 2).
Twins-Set ImageNet-Set
Region of Interest
Peak latency (ms) Onset latency (ms) Peak latency (ms) Onset latency (ms)
EVC 122 (119–125) 89 (56–95) 127 (110–133) 84 (71–91)
Dorsal regions
IPS0 137 (131–141) 111 (102–117) 172 (137–204) 133 (99–156)
IPS1 136 (132–140) 111 (103–119) 172 (142–205) 137 (99–158)
IPS2 136 (132–138) 112 (100–119) 174 (108–263) 103 (90–186)
Ventral regions
LO 136 (131–141) 102 (97–107) 141 (115–169) 96 (87–118)
VO 136 (131–139) 102 (95–109) 166 (125–173) 103 (95–125)
TO 134 (128–140) 90 (77–100) 139 (135–154) 115 (95–126)
PHC 136 (132–139) 109 (102–115) 172 (156–210) 121 (99–159)
Values are averaged over n = 15 subjects with 95% confidence intervals reported in parentheses.
4. Discussion
One of the central tenants of science is reproducibility [43–45]. This is especially relevant in
cognitive neuroscience, as the surge of new cutting-edge multivariate analysis tools has made it
possible to address questions that were previously untestable [41,46]. Here, we have demonstrated the
reproducibility of the fMRI-MEG fusion method through the application of two separate experiments,
testing the reliability and generalizability of the technique.
The first analysis compared neural data within the same subject groups across Twin image
sets, with equalized low-level visual features, and sharing highly similar semantic concepts (e.g.,
a giraffe for a giraffe, a flower for a flower). We observed that the analysis yielded reliably consistent
spatiotemporal dynamics, with each subset showing responses first in the occipital pole, and then
signals in the anterior direction, with similar path in both ventral and dorsal streams. The strong
agreement between the full brain spatiotemporal maps of the Twin-sets suggests that the signals
detected by the fMRI-MEG data fusion method is likely to reliably reflect the representations of
the stimulus. This sequence of representational signals followed the established spatial [47,48] and
temporal [19,49] patterns associated with hierarchical visual processing.
This high degree of reliability, within subjects, across these separate but matched image-sets has
pragmatic consequences in reinforcing the power and confidence of this method. The agreement
within results of unimodal neuro-imaging have been shown have low test-retest reliability [29]. This
realization has brought about a crisis of confidence in the replicability and reliability of published
research findings within neuroscience [50,51]. To mitigate these concerns the generation of new
research discoveries requires that findings move beyond drawing conclusions solely on the basis of a
single study. As such, we sought to extend this replication by comparing the newly collected Twins-Set
data to previously published independent fMRI-MEG fusion data [9]. This analysis focused on the
generalizability of this method across subject groups and to a wider range of stimuli.Vision 2019, 3, 8 12 of 18
Across the two experiments, findings from the full brain correlation maps and spatially restricted
ROI analysis revealed that the fMRI-MEG data fusion captures the spatiotemporal dynamic patterns
common to visual processing in a manner that generalizes across subjects and natural images. The results
of both experiments illustrate the spatiotemporal progression associated with hierarchical visual
processing [6,52,53], with significant signals emerging first in early visual areas and then along the
ventral and dorsal pathways. Additionally, qualitative comparison of correlation time series in Figures
2b and 3b with Figures 6b and 7b reveals that the response patterns between Twin set 1 and 2 are
qualitatively more similar than between the Twins sets and the ImageNet set. This is most likely
due to the fact that Twin set 1 and 2 had similar low- and high-level features by design, and both
were different from the features of the ImageNet set. Nevertheless, the similarity in spatiotemporal
dynamics in the two experiments suggests that the neural dynamics in processing natural images
are similar.
We found that overall this generalized response had similar expected spatiotemporal response
patterns, but with greater variability in high-level visual areas. Previous work examining the
replicability of neuroimaging data has shown that low-level brain functions (motor and sensory
tasks), show generally less variance than high level cognitive tasks [54]. Moreover, between subject
comparisons show significantly higher variability than within due to the increase sources of noise [55].
Cognitive neuroscientists have many methodological options for studying how experimental
variables are systematically related to the spatiotemporal dynamics underlying a cortical process
of interest. To date, much of our understanding has been advanced by methods that yield high
spatial or temporal resolution, but not both. Separately, the limitations of these modalities in their
application to understanding cognition are well known. Here we show that combining these methods
through representational similarity analysis provides a reliable and generalizable tool for studying
visual perception. This confirmatory replication within and between image-sets and subject-groups
demonstrates the replicability of the method in the study of visual processing. By establishing
replicability our study increases the trustworthiness of the method, and we hope that this motivates
further researchers to use the method in the study of human brain function.
Author Contributions: Conceptualization, Y.M., C.M., R.C., A.O.; investigation, Y.M., C.M., R.C., A.O.;
methodology, Y.M., C.M., R.C., A.O.; data analysis, B.L., Y.M.; writing and editing, Y.M., C.M., R.C., A.O.;
visualization, Y.M, C.M.; supervision, R.C., A.O.; funding acquisition, R.C., A.O.
Funding: This research was funded by NSF grant number 1532591, in Neural and Cognitive Systems as well as
the Vannevar Bush Faculty Fellowship program funded by the ONR grant number N00014-16-1-3116 (to A.O.)
and the DFG Emmy Noether Grant CI 241/1-1 (to R.C.).
Acknowledgments: The experiments were conducted at the Athinoula A. Martinos Imaging Center at the
McGovern Institute for Brain Research, Massachusetts Institute of Technology. The authors would like to thank
Dimitrios Pantazis for helpful discussions. The data will be available online.
Conflicts of Interest: The authors declare no conflict of interest. The funders had no role in the design of the
study; in the collection, analyses, or interpretation of data; in the writing of the manuscript, or in the decision to
publish the result.
Appendix A
Twin sets features control: As described in the Methods section the twin sets consists of 78 pairs
of natural images. The images were controlled for high-level verbal semantics by matching the
verbal semantic description of the main object shown (determined by consensus among authors).
Further, images sets were matched for low-level image features (color, luminance, brightness, and
spatial frequency) using the natural image statistical toolbox [37–39]. In detail, the toolbox statistically
compares several stimulus features such as spatial frequency at different energy levels (spectral energy,
Table A1), color (Table A2), brightness and contrast. There were no significant differences between
twin set 1&2 in any feature.Vision 2019, 3, 8 13 of 18
Table A1. Comparison of the spatial frequency information between the Twin Sets (Experiment 1).
Spectral Energy Level (Spatial Frequency)
10% 30% 70% 90%
t value −0.43 0.87 0.37 −0.37
p value 0.67 0.37 0.7 0.72
Table A2. Comparison of color distribution (RGB and Lab) between the Twin Sets (Experiment 1).
Color Distribution
RGB Space Lab Space (Brightness and Contrast)
R G B L a b
t value 0.65 0.99 0.71 0.87 −0.80 0.05
p value 0.51 0.32 0.48 0.38 0.43 0.96
Experimental Design: In both experiments, images were presented at the center of the screen for
500 ms with 6 and 4 degrees of visual angle in Experiment 1 and 2, respectively. The task was the
same for both experiments: the images were overlaid with a black fixation cross at the center and
participants performed an orthogonal vigilance task. The data were collected over one MEG session
and two fMRI sessions in both experiments.
MEG session included 25 runs for Experiment 1 and 15 runs for Experiment 2. Images were
presented once per run in randomized order with 1–1.2 s stimulus onset asynchrony (SOA) in
Experiment 1 and twice per run with 0.9–1 s SOA in Experiment 2. The participants were instructed
to press a button and make an eye blink upon detection of a specific image (depicting an eye in
Experiment 1 and a paper clip in Experiment 2 presented every 3–5 trials randomly.
The two fMRI sessions consisted of 11–15 runs in Experiment 1 and 9–11 runs in Experiment 2.
Images were presented once per run in random order. In both studies 39 null trials were randomly
distributed in each run. During the null trials the fixation cross changed color for 100 ms and subjects
were instructed to respond to this color change by pressing a button. The trial duration was 3 s in
both studies. Images were presented for 500 ms and stimulus onset asynchrony was 3 s, or 6 s (if a
preceding null trial).
Appendix B
MEG Acquisition and Analysis
MEG data were acquired from a 306-channel Elekta neuromag TRIUX system with sampling rate
of 1 kHz and filtered by a 0.03 to 330 Hz band-pass filter. Participants’ head position was measured
prior and during the recording with 5 coils attached to their head. A maxfilter was applied for
temporal source space separation and correcting for head movements [56,57]. Data were analyzed
using Brainstorm software [58] to extract trials from −200 ms to 1000 ms with respect to image onset in
Experiment 1 and from −100 ms to 1000 ms relative to image onset in Experiment 2. The mean of the
baseline was removed and the data were smoothed with a 30 Hz low-pass filter. For each condition
and participant, we obtained 25 trials in Experiment 1 and 30 trials in Experiment 2.
Multivariate pattern analysis was used to determine the similarity relations between visual
conditions (Figure 1b). At each time point t, MEG sensor data were arranged in pattern vectors
resulting in N vectors per condition at that time point with N being the number of trials per condition.
Then, for each pair of conditions a support vector machine (SVM) classifier was trained to discriminate
the conditions based on the MEG pattern vectors at each time point. The performance of the classifier
computed with leave-one-out cross validation procedure was considered as a measure of dissimilarity
between those pairs of conditions and used to construct a C × C (C = 156 in Experiment 1 and C = 118Vision 2019, 3, 8 14 of 18
in Experiment 2) representational dissimilarity matrix (RDM) at each time point. Each row and
column in this matrix are indexed by a specific condition (image) and each matrix entry shows how
dissimilar the corresponding conditions are based on the MEG signals at a specific time point. These
matrices are symmetric with an undefined diagonal. To overcome computational complexity and
reduce noise, we subaveraged trials for each experimental condition (image separately) with random
assignment of trials to bins of 3 in Experiment 1, and bins of 5 in Experiment 2, before entering them
into multivariate analysis.
fMRI Acquisition and Analysis
The MRI data of both experiments were acquired with a 3T Trio Siemens scanner using a
32-channel head coil. The structural images were acquired using a standard T1-weighted sequence
(192 sagittal slices, FOV = 256 mm, TR = 1900 ms, TE = 2.52 ms, flip angle = 9◦ ).
Functional data of Experiment 1 was acquired over 11–15 runs of 305 volumes in two sessions
with gradient-echo EPI sequence: TR = 2000 ms, TE = 29 ms, flip angle = 90◦ , FOV read = 200 mm,
FOV phase = 100%, bandwidth 2368 Hz/Px, resolution = 3 × 3 × 3 mm, slice gap 20%, slices = 33,
ascending interleaved acquisition). Functional data of Experiment 2 was acquired over 9-11 runs of 648
volumes in two sessions with gradient-echo EPI sequence: TR = 750 ms, TE = 30 ms, flip angle = 61◦ ,
FOV read = 192 mm, FOV phase = 100% with a partial fraction of 6/8, through-plane acceleration
factor 3, bandwidth 1816 Hz/Px, resolution = 3 × 3 × 3 mm, slice gap 20%, slices = 33, ascending
interleaved acquisition).
The fMRI data in both studies were preprocessed using SPM software. For each participant,
fMRI data were slice-time corrected, realigned and co-registered to the T1 structural scan of the first
session, and finally normalized to the standard MNI space. We applied a general linear model (GLM)
to estimate the fMRI responses to the 156 and 118 image conditions in Experiment 1 and 2, respectively.
Stimulus onsets and durations, as well as motion and run regressors were included in the GLM. All
the regressors were convolved with a hemodynamic response function (canonical HRF) with time
resolution of TR/N and onset of the first slice (TR = 2000 ms, N = 33 slices). By contrasting each
condition against the implicit baseline, we converted the condition-specific GLM estimates into t-value
maps (resulting in 156 condition-specific t-maps for Experiment 1 and 118 condition-specific t-maps
for Experiment 2).
We then applied the searchlight analysis method to create the fMRI RDMs [59,60] for each subject,
separately. At each voxel v, condition-specific t-value pattern vectors were extracted in a sphere
centered at voxel v with a 4-voxel radius. Dissimilarities between these pattern vectors were computed
in a pairwise manner (1-Pearson’s R). Then these dissimilarities were entered into an RDM matrix
in which its rows and columns were indexed by the image conditions. This process resulted in a
156 × 156 RDM at each voxel for fMRI data of each subject in Experiment 1 and a 118 × 118 RDM at
each voxel for fMRI data of each subject in Experiment 2.
Appendix C
Full Brain fMRI-MEG Fusion: The assumption in the fusion analysis is that the pairwise
condition-specific relations (in the form of RDM representations) are preserved across MEG and
fMRI data patterns. For example, if two images result in similar patterns in MEG data, they produce
similar patterns in fMRI data as well. Comparison of pairwise similarity relations across MEG and
fMRI makes it possible to relate representations at specific time points (in MEG) with specific locations
(in fMRI). For both datasets, we performed within subject analysis comparing averaged MEG RDMs
over the 15 subjects, with subject-specific fMRI RDMs. We computed the correlations (Spearman’s R)
between MEG RDMs at each time point and fMRI RDMs at each voxel. These computations resulted in
a 3D correlation map over the whole brain at each time point. Repeating the analysis over time yielded
a spatiotemporally resolved view of visual information in the brain. We used Spearman rather thanVision 2019, 3, 8 15 of 18
Pearson correlation to compare MEG-fMRI responses because we assume that the values compared
are monotonically, rather than linearly related to each other.
Appendix D
Region-of-Interest Analysis
Spatially Restricted Searchlight Voxel-wise fMRI-MEG Fusion: This analysis followed the regular
voxel-wise full brain fMRI-MEG fusion but in spatially restricted regions of the brain. In detail, the
search-light method was performed within the ROI and an RDM matrix was created at each specific
voxel by comparing condition-specific fMRI pattern responses within the searchlight sphere centered
at the voxel (1-Pearson’s R). Then the time-resolved MEG RDMs were compared with these fMRI
RDMs (Spearman’s R) resulting in correlation time series within the ROI which were then averaged
resulting in one correlation time-course per ROI and per subject. This ROI analysis method picks out
the spatiotemporal dynamics in particular cortical regions as resolved with the searchlight fMRI-MEG
fusion method. This method is directly comparable with the full brain fusion analysis and it is a
convenient way to quantitatively compare the spatiotemporal dynamics of fusion movies within
specific brain regions.
ROI-based fMRI-MEG Fusion: This analysis is the previously established way of performing ROI
based fusion and is directly comparable with the original fusion studies [8,9]. We extracted the voxel
patterns within each ROI and then computed the condition-specific pairwise dissimilarities (1-Pearson’s
R) to create a single RDM matrix per ROI. We obtained one fMRI RDM for each ROI per subject.
The fMRI ROI RDMs were averaged over subjects and then compared with subject-specific MEG
RDMs over time by computing their Spearman’s R correlations. This process results in time-course of
MEG-fMRI fusion in each ROI per subject.
Specifically, we extracted the following ROIs: one early visual cortex (combining V1, V2, V3),
four ventral visual areas (lateral occipital (LO1&2), temporal occipital (TO), ventral occipital (VO1&2),
and parahippocampal cortex (PHC1&2) and four parietal areas (intraparietal cortex including IPS0,
IPS1, IPS2, and IPS3). The ROI definition followed [9] based on the probabilistic maps of [61].
Appendix E
Reliability Maps
To assess the reproducibility of the full brain fMRI-MEG fusion method, we computed
participant-specific reliability maps. For this, at each voxel we compared the MEG-fMRI correlation
time series of Twin set 1 with the corresponding time series of Twin set 2 by computing Pearson’s
correlations. This yielded a 3D reliability (correlation) map per individual. We determined significance
with permutation tests and corrected for multiple comparisons using cluster correction.
Appendix F
Statistical Testing
We used non-parametric permutation-based cluster-size inference [62,63] as used also previously
in the original fusion studies [8,9]. In detail, we first averaged the 4D subject-specific spatiotemporal
maps over subjects resulting in a mean 4D correlation map. We then constructed an empirical
distribution of the null hypothesis using the voxel values of the mean correlation map in the baseline
period, i.e., from −200 to 0 ms for Twin Set 1 and 2, and from −100 to 0 ms for ImageNet set.
The right-sided 99.9% threshold (i.e., P = 0.001) was determined as the cluster-definition threshold.
To estimate a permutation-based maximal cluster size threshold, the sign of subject-specific data points
was shuffled randomly (1000 iterations), the data was averaged over subjects, and 4D clusters wereVision 2019, 3, 8 16 of 18
determined by spatial and temporal contiguity at the cluster-definition threshold. We then constructed
an empirical distribution of maximal cluster size over permutation sampling and determined the 99%
threshold (i.e., cluster size threshold at P = 0.01). We reported clusters as significant if they exceed
this threshold.
For peak and onset latency of the time series statistical assessments, bootstrap tests were
performed. We bootstrapped the subject-specific time series for 1000 times to estimate an empirical
distribution over peak and onset latency of the subject-averaged time courses and use it to define 95%
confidence intervals. For peak to peak latency comparisons, 1000 bootstrapped samples of two peak
differences were obtained. The null hypothesis was rejected if the 95% confidence interval of the peak
latency differences did not include zero.
References
1. Malach, R.; Reppas, J.B.; Benson, R.R.; Kwong, K.K.; Jiang, H.; Kennedy, W.A.; Ledden, P.J.; Brady, T.J.;
Rosen, B.R.; Tootell, R.B. Object-related activity revealed by functional magnetic resonance imaging in
human occipital cortex. Proc. Natl. Acad. Sci. USA 1995, 92, 8135–8139. [CrossRef] [PubMed]
2. Grill-Spector, K.; Kourtzi, Z.; Kanwisher, N. The lateral occipital complex and its role in object recognition.
Vis. Res. 2001, 41, 1409–1422. [CrossRef]
3. Johnson, J.S.; Olshausen, B.A. Timecourse of neural signatures of object recognition. J. Vis. 2003, 3, 4.
[CrossRef]
4. Op de Beeck, H.P.; Baker, C.I. The neural basis of visual object learning. Trends Cogn. Sci. 2010, 14, 22–30.
[CrossRef] [PubMed]
5. Mullin, C.R.; Steeves, J.K.E. Consecutive TMS-fMRI Reveals an Inverse Relationship in BOLD Signal between
Object and Scene Processing. J. Neurosci. 2013, 33, 19243–19249. [CrossRef] [PubMed]
6. DiCarlo, J.J.; Zoccolan, D.; Rust, N.C. How Does the Brain Solve Visual Object Recognition? Neuron 2012, 73,
415–434. [CrossRef] [PubMed]
7. Konkle, T.; Oliva, A. A Real-World Size Organization of Object Responses in Occipitotemporal Cortex.
Neuron 2012, 74, 1114–1124. [CrossRef]
8. Cichy, R.M.; Pantazis, D.; Oliva, A. Resolving human object recognition in space and time. Nat. Neurosci.
2014, 17, 455–462. [CrossRef]
9. Cichy, R.M.; Pantazis, D.; Oliva, A. Similarity-Based Fusion of MEG and fMRI Reveals Spatio-Temporal
Dynamics in Human Cortex During Visual Object Recognition. Cereb. Cortex 2016, 26, 3563–3579. [CrossRef]
10. Dale, A.M.; Halgren, E. Spatiotemporal mapping of brain activity by integration of multiple imaging
modalities. Curr. Opin. Neurobiol. 2001, 11, 202–208. [CrossRef]
11. Debener, S.; Ullsperger, M.; Siegel, M.; Engel, A.K. Single-trial EEG–fMRI reveals the dynamics of cognitive
function. Trends Cogn. Sci. 2006, 10, 558–563. [CrossRef] [PubMed]
12. Rosa, M.J.; Daunizeau, J.; Friston, K.J. EEG-fMRI Integration: A Critical Review of Biophysical Modeling
and Data Analysis Approaches. J. Integr. Neurosci. 2010, 09, 453–476. [CrossRef]
13. Huster, R.J.; Debener, S.; Eichele, T.; Herrmann, C.S. Methods for Simultaneous EEG-fMRI: An Introductory
Review. J. Neurosci. 2012, 32, 6053–6060. [CrossRef] [PubMed]
14. Jorge, J.; van der Zwaag, W.; Figueiredo, P. EEG–fMRI integration for the study of human brain function.
NeuroImage 2014, 102, 24–34. [CrossRef] [PubMed]
15. Sui, J.; Adali, T.; Yu, Q.; Chen, J.; Calhoun, V.D. A review of multivariate methods for multimodal fusion of
brain imaging data. J. Neurosci. Methods 2012, 204, 68–81. [CrossRef] [PubMed]
16. Khaligh-Razavi, S.-M.; Cichy, R.M.; Pantazis, D.; Oliva, A. Tracking the Spatiotemporal Neural Dynamics of
Real-world Object Size and Animacy in the Human Brain. J. Cogn. Neurosci. 2018, 30, 1559–1576. [CrossRef]
[PubMed]
17. Mohsenzadeh, Y.; Qin, S.; Cichy, R.M.; Pantazis, D. Ultra-Rapid serial visual presentation reveals dynamics of
feedforward and feedback processes in the ventral visual pathway. eLife 2018, 7, 1–23. [CrossRef] [PubMed]
18. Hebart, M.N.; Bankson, B.B.; Harel, A.; Baker, C.I.; Cichy, R.M. The representational dynamics of task and
object processing in humans. eLife 2018, 7, 1–22. [CrossRef]
19. Thorpe, S.; Fize, D.; Marlot, C. Speed of processing in the human visual system. Nature 1996, 381, 520–522.
[CrossRef]Vision 2019, 3, 8 17 of 18
20. VanRullen, R.; Thorpe, S.J. The Time Course of Visual Processing: From Early Perception to Decision-Making.
J. Cogn. Neurosci. 2001, 13, 454–461. [CrossRef]
21. Mormann, F.; Kornblith, S.; Quiroga, R.Q.; Kraskov, A.; Cerf, M.; Fried, I.; Koch, C. Latency and Selectivity of
Single Neurons Indicate Hierarchical Processing in the Human Medial Temporal Lobe. J. Neurosci. 2008, 28,
8865–8872. [CrossRef] [PubMed]
22. Liu, H.; Agam, Y.; Madsen, J.R.; Kreiman, G. Timing, Timing, Timing: Fast Decoding of Object Information
from Intracranial Field Potentials in Human Visual Cortex. Neuron 2009, 62, 281–290. [CrossRef] [PubMed]
23. Isik, L.; Meyers, E.M.; Leibo, J.Z.; Poggio, T. The dynamics of invariant object recognition in the human
visual system. J. Neurophysiol. 2014, 111, 91–102. [CrossRef] [PubMed]
24. Carlson, T.; Tovar, D.A.; Alink, A.; Kriegeskorte, N. Representational dynamics of object vision: The first
1000 ms. J. Vis. 2013, 13, 1. [CrossRef] [PubMed]
25. Contini, E.W.; Wardle, S.G.; Carlson, T.A. Decoding the time-course of object recognition in the human brain:
From visual features to categorical decisions. Neuropsychologia 2017, 105, 165–176. [CrossRef] [PubMed]
26. Lowe, M.X.; Rajsic, J.; Ferber, S.; Walther, D.B. Discriminating scene categories from brain activity within 100
milliseconds. Cortex 2018, 106, 275–287. [CrossRef]
27. Simmons, J.P.; Nelson, L.D.; Simonsohn, U. False-Positive Psychology: Undisclosed Flexibility in Data
Collection and Analysis Allows Presenting Anything as Significant. Psychol. Sci. 2011, 22, 1359–1366.
[CrossRef]
28. Pashler, H.; Harris, C.R. Is the Replicability Crisis Overblown? Three Arguments Examined. Perspect. Psychol.
Sci. 2012, 7, 531–536. [CrossRef]
29. Bennett, C.M.; Miller, M.B. fMRI reliability: Influences of task and experimental design. Cogn. Affect. Behav.
Neurosci. 2013, 13, 690–702. [CrossRef]
30. Kanwisher, N.; McDermott, J.; Chun, M.M. The Fusiform Face Area: A Module in Human Extrastriate Cortex
Specialized for Face Perception. J. Neurosci. 1997, 17, 4302–4311. [CrossRef]
31. Epstein, R.; Harris, A.; Stanley, D.; Kanwisher, N. The Parahippocampal Place Area: Recognition, Navigation,
or Encoding? Neuron 1999, 23, 115–125. [CrossRef]
32. Epstein, R.; Kanwisher, N. A cortical representation of the local visual environment. Nature 1998, 392,
598–601. [CrossRef] [PubMed]
33. Downing, P.E. A Cortical Area Selective for Visual Processing of the Human Body. Science 2001, 293,
2470–2473. [CrossRef] [PubMed]
34. Grill-Spector, K.; Kushnir, T.; Edelman, S.; Avidan, G.; Itzchak, Y.; Malach, R. Differential Processing of
Objects under Various Viewing Conditions in the Human Lateral Occipital Complex. Neuron 1999, 24,
187–203. [CrossRef]
35. Dilks, D.D.; Julian, J.B.; Paunov, A.M.; Kanwisher, N. The Occipital Place Area Is Causally and Selectively
Involved in Scene Perception. J. Neurosci. 2013, 33, 1331–1336. [CrossRef] [PubMed]
36. Khosla, A.; Raju, A.S.; Torralba, A.; Oliva, A. Understanding and Predicting Image Memorability at a Large
Scale. In Proceedings of the 2015 IEEE International Conference on Computer Vision (ICCV), Santiago, Chile,
7–13 December 2015; pp. 2390–2398.
37. Torralba, A.; Oliva, A. Statistics of natural image categories. Netw. Comput. Neural Syst. 2003, 14, 391–412.
[CrossRef]
38. Bainbridge, W.A.; Oliva, A. A toolbox and sample object perception data for equalization of natural images.
Data Brief 2015, 5, 846–851. [CrossRef] [PubMed]
39. Park, S.; Konkle, T.; Oliva, A. Parametric Coding of the Size and Clutter of Natural Scenes in the Human
Brain. Cereb. Cortex 2015, 25, 1792–1805. [CrossRef] [PubMed]
40. Deng, J.; Dong, W.; Socher, R.; Li, L.-J.; Li, K.; Fei-Fei, L. ImageNet: A Large-Scale Hierarchical Image
Database. In Proceedings of the 2009 IEEE Conference on Computer Vision and Pattern Recognition, Miami,
FL, USA, 20–25 June 2009.
41. Kriegeskorte, N. Representational similarity analysis—Connecting the branches of systems neuroscience.
Front. Syst. Neurosci. 2008, 2, 4. [CrossRef]
42. Kriegeskorte, N.; Kievit, R.A. Representational geometry: Integrating cognition, computation, and the brain.
Trends Cogn. Sci. 2013, 17, 401–412. [CrossRef]
43. John, L.K.; Loewenstein, G.; Prelec, D. Measuring the Prevalence of Questionable Research Practices With
Incentives for Truth Telling. Psychol. Sci. 2012, 23, 524–532. [CrossRef] [PubMed]Vision 2019, 3, 8 18 of 18
44. Maxwell, S.E.; Lau, M.Y.; Howard, G.S. Is psychology suffering from a replication crisis? What does “failure
to replicate” really mean? Am. Psychol. 2015, 70, 487–498. [CrossRef] [PubMed]
45. Munafò, M.R.; Nosek, B.A.; Bishop, D.V.M.; Button, K.S.; Chambers, C.D.; Percie du Sert, N.; Simonsohn, U.;
Wagenmakers, E.-J.; Ware, J.J.; Ioannidis, J.P.A. A manifesto for reproducible science. Nat. Hum. Behav. 2017,
1, 0021. [CrossRef]
46. Haynes, J.-D.; Rees, G. Decoding mental states from brain activity in humans. Nat. Rev. Neurosci. 2006, 7,
523–534. [CrossRef]
47. Grill-Spector, K.; Malach, R. THE HUMAN VISUAL CORTEX. Annu. Rev. Neurosci. 2004, 27, 649–677.
[CrossRef] [PubMed]
48. Op de Beeck, H.P.; Haushofer, J.; Kanwisher, N.G. Interpreting fMRI data: Maps, modules and dimensions.
Nat. Rev. Neurosci. 2008, 9, 123–135. [CrossRef] [PubMed]
49. Amano, K. Estimation of the Timing of Human Visual Perception from Magnetoencephalography. J. Neurosci.
2006, 26, 3981–3991. [CrossRef] [PubMed]
50. Ioannidis, J.P.A. Why Most Published Research Findings Are False. PLoS Med. 2005, 2, 6. [CrossRef]
[PubMed]
51. Button, K.S.; Ioannidis, J.P.A.; Mokrysz, C.; Nosek, B.A.; Flint, J.; Robinson, E.S.J.; Munafò, M.R. Power
failure: Why small sample size undermines the reliability of neuroscience. Nat. Rev. Neurosci. 2013, 14,
365–376. [CrossRef] [PubMed]
52. Riesenhuber, M.; Poggio, T. Neural mechanisms of object recognition. Curr. Opin. Neurobiol. 2002, 12,
162–168. [CrossRef]
53. Serre, T.; Oliva, A.; Poggio, T. A feedforward architecture accounts for rapid categorization. Proc. Natl. Acad.
Sci. USA 2007, 104, 6424–6429. [CrossRef] [PubMed]
54. Caceres, A.; Hall, D.L.; Zelaya, F.O.; Williams, S.C.R.; Mehta, M.A. Measuring fMRI reliability with the
intra-class correlation coefficient. NeuroImage 2009, 45, 758–768. [CrossRef] [PubMed]
55. Miller, M.B.; Van Horn, J.D. Individual variability in brain activations associated with episodic retrieval:
A role for large-scale databases. Int. J. Psychophysiol. 2007, 63, 205–213. [CrossRef] [PubMed]
56. Taulu, S.; Kajola, M.; Simola, J. Suppression of Interference and Artifacts by the Signal Space Separation
Method. Brain Topogr. 2003, 16, 269–275. [CrossRef]
57. Taulu, S.; Simola, J. Spatiotemporal signal space separation method for rejecting nearby interference in MEG
measurements. Phys. Med. Biol. 2006, 51, 1759–1768. [CrossRef] [PubMed]
58. Tadel, F.; Baillet, S.; Mosher, J.C.; Pantazis, D.; Leahy, R.M. Brainstorm: A User-Friendly Application for
MEG/EEG Analysis. Comput. Intell. Neurosci. 2011, 2011, 1–13. [CrossRef] [PubMed]
59. Kriegeskorte, N.; Goebel, R.; Bandettini, P. Information-based functional brain mapping. Proc. Natl. Acad.
Sci. USA 2006, 103, 3863–3868. [CrossRef]
60. Haynes, J.-D.; Sakai, K.; Rees, G.; Gilbert, S.; Frith, C.; Passingham, R.E. Reading Hidden Intentions in the
Human Brain. Curr. Biol. 2007, 17, 323–328. [CrossRef]
61. Wang, L.; Mruczek, R.E.B.; Arcaro, M.J.; Kastner, S. Probabilistic Maps of Visual Topography in Human
Cortex. Cereb. Cortex 2015, 25, 3911–3931. [CrossRef]
62. Maris, E.; Oostenveld, R. Nonparametric statistical testing of EEG- and MEG-data. J. Neurosci. Methods 2007,
164, 177–190. [CrossRef]
63. Pantazis, D.; Nichols, T.E.; Baillet, S.; Leahy, R.M. A comparison of random field theory and permutation
methods for the statistical analysis of MEG data. NeuroImage 2005, 25, 383–394. [CrossRef] [PubMed]
© 2019 by the authors. Licensee MDPI, Basel, Switzerland. This article is an open access
article distributed under the terms and conditions of the Creative Commons Attribution
(CC BY) license (http://creativecommons.org/licenses/by/4.0/).You can also read