THE INFLUENCE OF GEOGRAPHIC FACTORS ON INFORMATION DISSEMINATION IN MOBILE SOCIAL NETWORKS IN CHINA: EVIDENCE FROM WECHAT - MDPI
←
→
Page content transcription
If your browser does not render page correctly, please read the page content below
International Journal of
           Geo-Information

Article
The Influence of Geographic Factors on Information
Dissemination in Mobile Social Networks in China:
Evidence from WeChat
Liang Liu 1, ID , Bin Chen 1, *       ID
                                           , Chuan Ai 1 , Lingnan He 2 , Yiping Wang 3 , Xiaogang Qiu 1
and Xin Lu 1,4,5,6
 1    College of System Engineering, National University of Defense Technology, Changsha 410073, China;
      liuliang@nudt.edu.cn (L.L.); aichuan@nudt.edu.cn (C.A.); 13874934509@139.com (X.Q.);
      xin.lu@flowminder.org (X.L.)
 2    School of Communication and Design, Sun Yat-sen University, Guangzhou 510006, China;
      heln3@mail.sysu.edu.cn
 3    The Naval Factory 902, Shanghai 200083, China; foolwangrain@126.com
 4    School of Mathematics and Big Data, Foshan University, Foshan 528000, China
 5    Department of Public Health Sciences, Karolinska Institutet, 17177 Stockholm, Sweden
 6    Division of Infectious Disease, Key Laboratory of Surveillance and Early Warning on Infectious Disease,
      Chinese Center for Disease Control and Prevention, Beijing 102206, China
 *    Correspondence: nudtcb9372@gmail.com; Tel.: +86-0731-8457-4332

 Received: 17 March 2018; Accepted: 7 May 2018; Published: 14 May 2018

 Abstract: Mobile social networking services provide efficient and easy communication, enabling
 users to create, retrieve and disseminate messages on the go while making their messages widely
 available. Despite growing evidence suggesting that geographic location and distance restrict
 online communication and interaction patterns, the role of geographic factors on the information
 dissemination in mobile social networks is often overlooked. We conducted a large-scale analysis
 on how the geographic factors influence the information dissemination in mobile social networks,
 by using two different datasets which recorded billions of users’ viewing and forwarding activities
 corresponding as well as the temporal and geographic information. The effects of two geographic
 factors, namely location and distance, on the probability and velocity of information dissemination
 were explored by measuring the geographic distribution of the four key indicators, namely viewing
 probability, forwarding probability, response time, and decision-making time. The results verify the
 distance decay effect of the information dissemination probability, and demonstrate that the velocity
 of information dissemination is not dependent on geographic distance. Furthermore, both the
 probability and velocity of information dissemination show heterogeneity and diversity of geographic
 location. Our research makes up for the gap in the relationship between geographic factors and
 information dissemination in mobile social networks. Our findings can provide suggestions for
 mobile social services, public opinion regulation and precision marketing.

 Keywords: information dissemination; geographic distance; geographic location; spatial-temporal
 data; user behaviour; mobile social networks; WeChat

1. Introduction
     Mobile social networking is social networking where individuals communicate with each
other through a mobile phone and/or tablet, and it extends from web-based social networks and
location-based services [1]. Compared with web-based social networks, mobile social networks have
geographic location attributes and real name registration system, making it easier for virtualized social
interactions to translate into offline actions such as consumption and gathering. With mobile social

ISPRS Int. J. Geo-Inf. 2018, 7, 189; doi:10.3390/ijgi7050189                             www.mdpi.com/journal/ijgi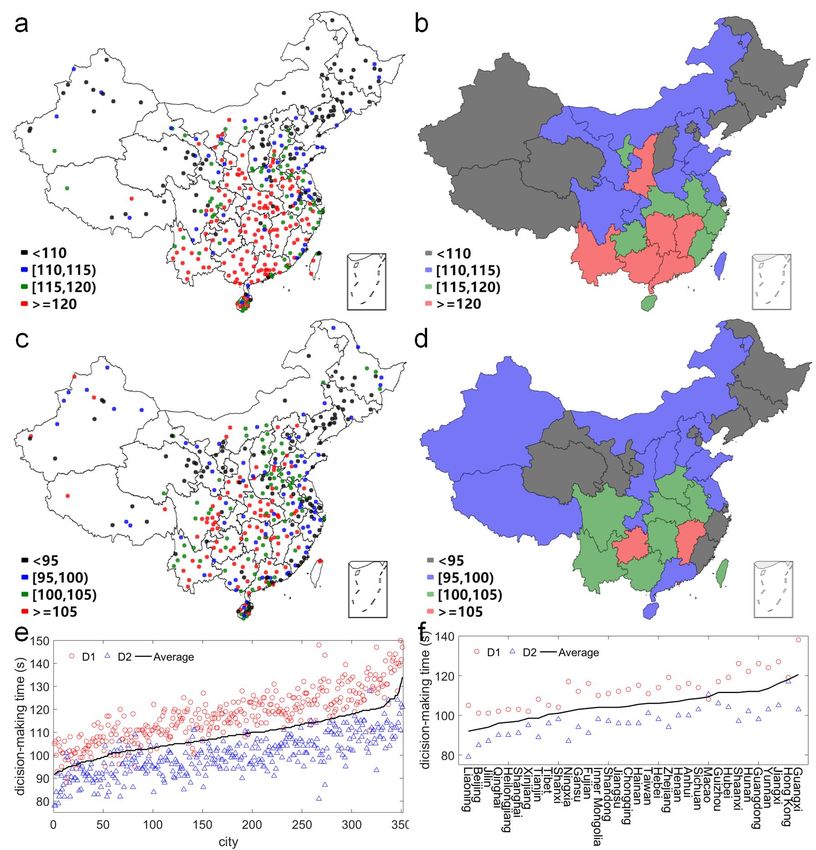
ISPRS Int. J. Geo-Inf. 2018, 7, 189                                                                  2 of 16

networking applications, people can share their feelings, emotions, opinions or attitudes about what
they have seen and heard in the physical world, and about popular events or viral advertisements in
virtual networks, at any time and place. Their friends from all over the world can view, comment and
forward the received information at any time, thus facilitating the spread of the information across
time and space [2–7].
      The rapid development of mobile social networking technology makes the costs imposed by
geographic factors during the information dissemination process negligible [8]. Numerous factors
affect the dissemination of information in mobile social networks, such as the network topology,
the information content, the credibility and influence of source, the opinion and attitude of the majority,
and the spatial-temporal characteristic of human behaviour [9–18]. However, the role geographic
factors play is usually ignored, despite growing evidence suggesting that geographic factors restrict
the online communication and interaction patterns [19–22]. In this paper, we aim to investigate the
impact of geographic factors on the information dissemination in mobile social networks.
      Usually, geographic factors are considered from two perspectives: distance and location. On the
one hand, for the distance factor, many studies find the distance decay effect in online social networks,
i.e., the larger the geographic distance, the lower the possibility of user interaction as well as
information dissemination [23–26]. In addition, the relationship between the probability of interaction
and the distance can be represented as a gravity model [27] or a radiation model [28]. The role distance
plays is often interpreted as an impact on the structure of mobile social networks, which indirectly
affects the information dissemination probability [19]. People tend to interact more with geographically
close people, leading to long-distance links fading away [29,30]. A larger distance usually leads to
lower interaction frequency, lower probability and lower efficiency of information transmission [31,32].
On the other hand, for the location factor, geographic location affects the spatial-temporal laws of
human behaviour, thus influencing the information dissemination in mobile social networks [33].
The behaviour of people living in similar geographic locations, e.g., the same city, exhibits similarities
[24]. A city’s unique economic and cultural factors often have an impact on the behaviour of its citizens,
thus making the population of a particular geographic space distinct from other regions. For example,
people living in some cities are more likely to view and forward entertainment information, whereas
people located in other cities are used to browsing news programs. However, the direct role of
geographic factors, i.e., distance and location, on the information dissemination in mobile social
networks, lacks a quantitative study at a large scale.
      Research on geographic factors and information dissemination have been widely carried out
based on Facebook, Twitter, Foursquare and so on. Previous studies exist some shortcomings, either
considering the geography at a coarse level of granularity, or dealing with small amounts of data,
or grouping social factors together [34–37]. Our work is based on lager scale WeChat datasets.
Compared with Twitter and Facebook, WeChat is a typical mobile social network, and most of
its information flow occurs via the mobile devices. Thus, we can use IP addresses to locate users to
avoid misleading self-reported geographic data [19]. Compared with location-based applications such
as Foursquare, WeChat has stronger social functions and a wider range of users. Thus, we can obtain a
strong set of data to study the influence of geographic factors on the information dissemination. WeChat
is the largest mobile acquaintance social networking application in China, and it has about 938 million
monthly active user accounts [38]. WeChat allows users to post, view and share instant messages,
photographs, articles, locations and so on. This article focuses only on the spread of web pages. WeChat
is an acquaintance social network where information is viewed or shared mainly via strong social
ties, i.e., strangers have no access to the information of certain users if they are not mutual-following
friends. WeChat integrates almost all aspects of people’s lives based on social networking, including
payment, QR (Quick Response) codes, location-based services, shopping, gaming and entertainment.
Therefore, WeChat can represent a relatively ideal system to study the relationship between online
information dissemination and geographic factors on a large scale. WeChat provides three basic ways
for users to view, comment, and reshare web pages: Messaging (Messaging—WeChat provides text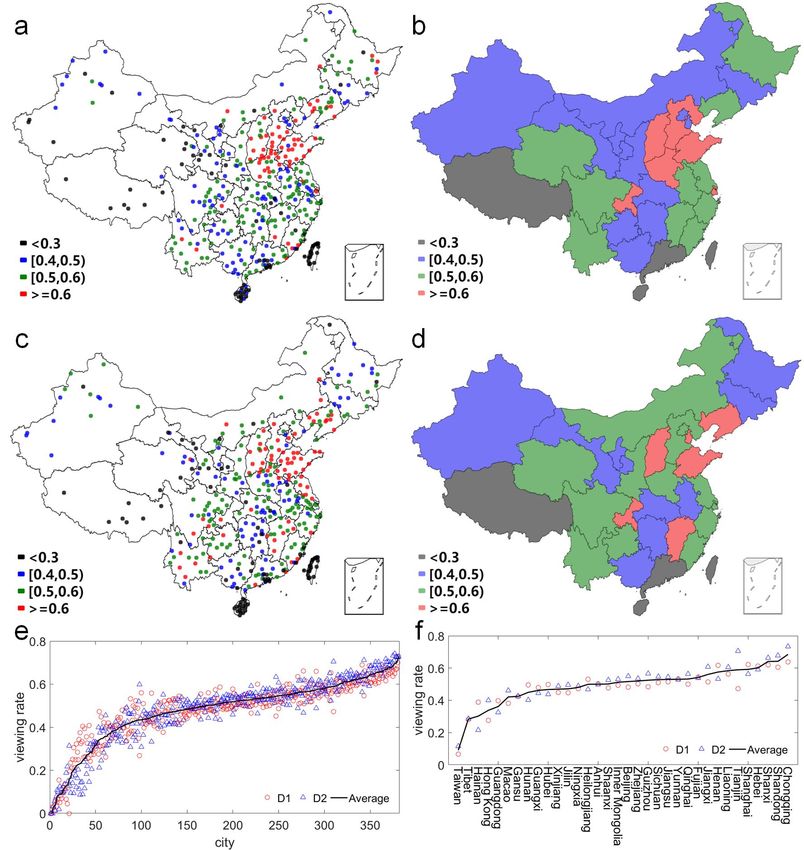
ISPRS Int. J. Geo-Inf. 2018, 7, 189                                                                          3 of 16

messaging, hold-to-talk voice messaging, broadcast (one-to-many) messaging, video conferencing,
video games, sharing of photographs and videos, and location sharing), Official Accounts (Official
Accounts—WeChat supports users who wish to register as an official account, which enables them to
push feeds to subscribers, interact with subscribers and provide them with services) and Moments
(Moments—Moments is WeChat’s brand name for its social feed of friends’ updates, and it allows users
to post images, post text, post comments, share music, share articles and post “likes”). An example of
the dissemination of a web page in WeChat is shown in Figure 1. Users can receive and view web pages
from the Official Accounts subscriptions, or Messaging and Moments (forwarded by his/her friends),
and can decide whether to forward a web page through Messaging or Moments after viewing it.

      Figure 1. Schematic diagram of the dissemination of a web page in WeChat. The map of (a) describes
      the spatial dissemination of the web page at the current moment. The blue circles stand for users
      who just viewed the web page. The red circles represent users who have re-forwarded the web page
      after viewing it. Each user can be mapped to a city according to his/her IP address. (b) displays the
      dissemination process of the web page in the time dimension. User A forwards the web page at time t0 .
      User B views the web page forwarded by user A at time t1 , and re-forwards the web page at time t2 .
      Thus, for user B, the response time and the decision-making time are t1 − t0 and t2 − t1 , respectively.

      In this work, we collected two different periods of datasets from WeChat, both of which recorded
billions of users’ viewing and forwarding actions of web pages. Based on the spatial-temporal
interaction records, we not only can map each user to city and obtain its distance between any two
users, but also can calculate the time interval between users’ sequential actions, as shown in Figure 1.
We are trying to investigate the role of geographic factors in the information dissemination in WeChat
social network. Our datasets support us to characterize the information dissemination from two
dimensions: probability and velocity. Ultimately, based on the users’ viewing and forwarding actions
and the time interval between these two sequential actions, we select four key indicators to describe the
probability and velocity of information dissemination, namely viewing probability, forwarding probability,
response time, and decision-making time. Our purpose is to explore the impact of geographic location and
distance on the four indicators of the information dissemination. Furthermore, we are trying to discover
the underlying causes of the impact of geographic factors in the information dissemination, including
users’ social preferences, regional cultural differences, immigration streams, and industry distributions.
      Our research makes up for the gap in the relationship between geographic factors and information
dissemination in mobile social networks. Since we only consider the influence of geographic factors
and ignore the interference of other complex factors, i.e., the demographics of users and the content
of the information, our results are general and can be easily applied in related fields. Our findings
can provide suggestions for mobile social services, public opinion regulation and precision marketing.
First, our results verify the distance decay effect of the information dissemination probability in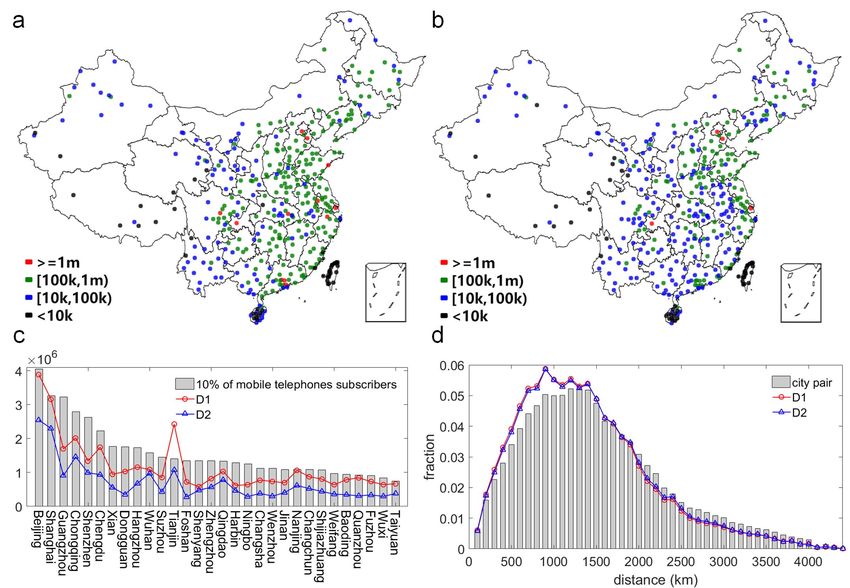
ISPRS Int. J. Geo-Inf. 2018, 7, 189                                                                              4 of 16

mobile social networks for the first time. If social service information (or an advertisement, or a poll
questionnaire) wants to spread to a wider area to acquire more customers, the geographic factors should
be considered when publishing the service message. If a message is released from key users in different
cities, the dissemination of the information may be better. Second, we find that both the probability and
velocity of information dissemination show heterogeneity and diversity of geographic location and
the diversity and heterogeneity can be attributed to regional cultural differences, immigration streams,
and industry distributions to some extent. This indicates that, in order to maximize profits, different
strategies should be implemented for different geographic regions when advertising, publishing
service information, or conducting polls.

2. Datasets and Methods
     In this section, we first introduce the datasets collected from WeChat. Then we explain how to
map users to cities, how to calculate the geographic distance between users, and how to measure the
probability and velocity of information dissemination in mobile social networks. At last, the temporal
distribution of user action is explored.

2.1. WeChat Datasets
     We collected massive web pages disseminated in WeChat through a third-party service
company.        During the dissemination process of each web page, users’ viewing and
forwarding actions, along with the time and place, were well recorded in a 6-tuple format
< pageid, sourceid, viewid, view/ f orward, time, ip >. To protect privacy, both the content of web pages
and the information of users were anonymized by web page indexes and user indexes, respectively.
In order to obtain relatively stable and reliable results, we obtained two datasets of different periods
that are of a similar level of scales, including number of users, pages, viewing actions, and forwarding
actions. Popular web pages that been viewed and forwarded more than 10,000 times during the
collection periods were selected for the following research. As shown in Table 1, the resulting data
corpus include D1, which covers a 30-day period from 1 to 30 July in 2016, with 155,596,910 users,
2947 web pages, 190,279,798 viewing actions, and 25,638,628 forwarding actions involved; and D2,
which lasts 61 days from 1 March to 30 April in 2017, containing 109,696,332 users, 2688 web pages,
101,152,500 viewing actions, and 10,130,554 forwarding actions.

      Table 1. Basic statistics of the two datasets: start date, end date, number of days, users, web pages,
      viewing action, and forwarding action.

  Datasets           Start                End         # Days     # Users     # Web Pages   # Viewing     # Forwarding
      D1         1 July 2016           30 July 2016     30     155,596,910      2947       190,279,798    25,638,628
      D2        1 March 2017          30 April 2017     61     109,696,332      2688       101,152,500    10,130,554

2.2. Geographic Location and Distance
       To explore the impact of geographic factors on the information dissemination in mobile social
networks, we conduct the same analysis for the two different WeChat datasets D1 and D2 by using
Hadoop Map-Reduce.
       First, we locate all users into 382 cities according to the corresponding geographic information,
i.e., IP address. The vast majority of geographic studies based on social networks identify the location
employing user self-reported data, which are often misleading [19]. We use the IP information to
locate the user to a specific city, and the distance between any two users can be roughly calculated
through the geographic distance between cities. The most credible Taobao IP Address Database to
address the geographic location is employed [39,40]. A user is seldom located in more than one city
through different IP addresses (The proportion of a user located only in one city is: 93.8% for dataset D1,
and 94.8% for dataset D2). If, in the rare case a user travels between different cities during our sampling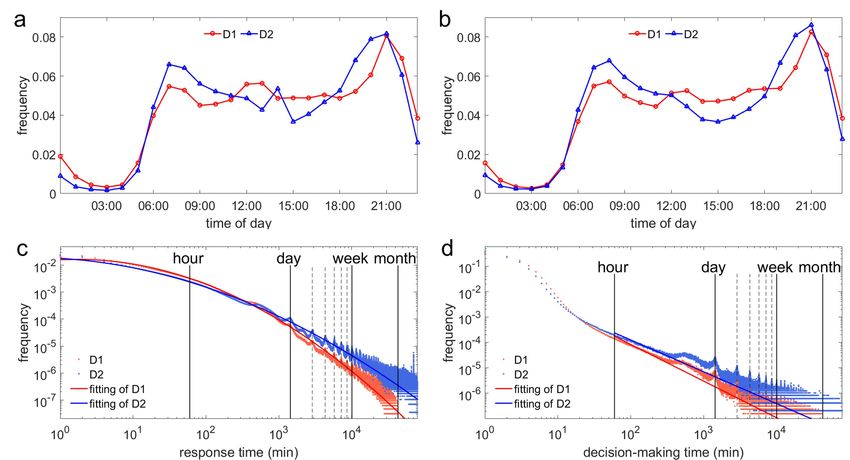
ISPRS Int. J. Geo-Inf. 2018, 7, 189                                                                                 5 of 16

window, we consider only the first city where the user views/forwards the page. As a result, we locate
all users into 382 cities of 34 provincial-level administrative divisions in China, and the areas of these
cities on the map can completely make up the map of China (see details in Supplementary Table S1).
The majority of these cities, including sub-provincial cities, prefecture-level cities, autonomous counties,
and provincial-controlled divisions, are part of a provincial-level administrative division, except
four municipalities (Beijing, Shanghai, Tianjin, and Chongqing), two special administrative regions
(Hong Kong and Macao), as shown in Table 2. As shown in Figure 2a,b, users are not evenly distributed
and most of them are concentrated in the eastern part of China, which are basically corresponded to
China’s permanent resident population and economy distribution [41], except ethnic minority areas
and Taiwan. The number of users included in both datasets is approximately 10% of the number of
subscribers of mobile telephones from census [41], as shown in Figure 2c. The spatial correlation of
number of users of the two datasets is significant, and the correlation coefficient is 0.9709 with p = 0.
      Second, we calculate and group the geographic distance between users. The distance dij between
users ui and u j is defined as the distance of users’ cities. The dij is the geographic great-circle distance
calculated by the two cities’ latitude and longitude coordinates (see details in Supplementary Table S1).
An alternative is the ranked distance (The ranked distance between a user and a given point in space
is not defined in number of kilometers, but in terms of the number of people who live closer to that
point than the given user), proposed to account for the inhomogeneity of population distribution in
space [42]. While the users are not distributed uniformly in geographic space, we prefer to rely on
the absolute geographic distance because the ranked distance may cause biases and issues when the
granularity is in city level, as noted in [19]. Figure 2d shows the distance distribution of city pairs and
the corresponding users of the two datasets. Both city pairs and the corresponding users in the two
datasets distribute a left-skew bell-type, with 90% data concentrated in the distance range of [200, 2700].
The distance dij between users in different cities are grouped by the interval of 100 km, and we set
dij = 4000 if the distance is larger than 4000 km. In addition, most majority cities are very large in size,
and it usually takes dozens or even hundreds of kilometres from one district to another in the city.
Thus, we set dij = 10 when ui and u j are located in the same city.

      Table 2. Administrative divisions distribution of cities in the 34 provincial administrative divisions
      (PADs) in China. Notes: (i) China has 34 provincial administrative units, including 23 provinces, four
      municipalities, five autonomous regions and two special administrative regions (SARs); (ii) the majority
      of the cities are at prefecture level, except four municipalities, two SARs and some (bracketed numbers)
      provincial-controlled divisions; (iii) Taiwan’s administrative divisions are different from the mainland,
      and the number of users in Taiwan is relatively small because WeChat is not the mainstream mobile
      social networking tool in Taiwan.

   PADs        Beijing      Tianjin   Hebei      Shanxi     Inner Mongolia    Liaoning    Jilin   Heilongjiang   Shanghai
  # cities        1            1       11          11             12             14         9          13           1
   PADs       Jiangsu      Zhejiang   Anhui       Fujian       Jiangxi       Shandong    Henan       Hubei       Hunan
  # cities       13          11        16           9             11            17       18(1)       17(4)        14
   PADs      Guangdong     Guangxi    Hainan    Chongqing      Sichuan        Guizhou    Yunnan      Tibet       Shaanxi
  # cities      21           14       18(15)        1             21             9         16          7           10
   PADs        Gansu        Qinghai   Ningxia    Xinjiang      Taiwan        Hong Kong   Macao
  # cities      14             8         5        15(1)         22(*)            1         1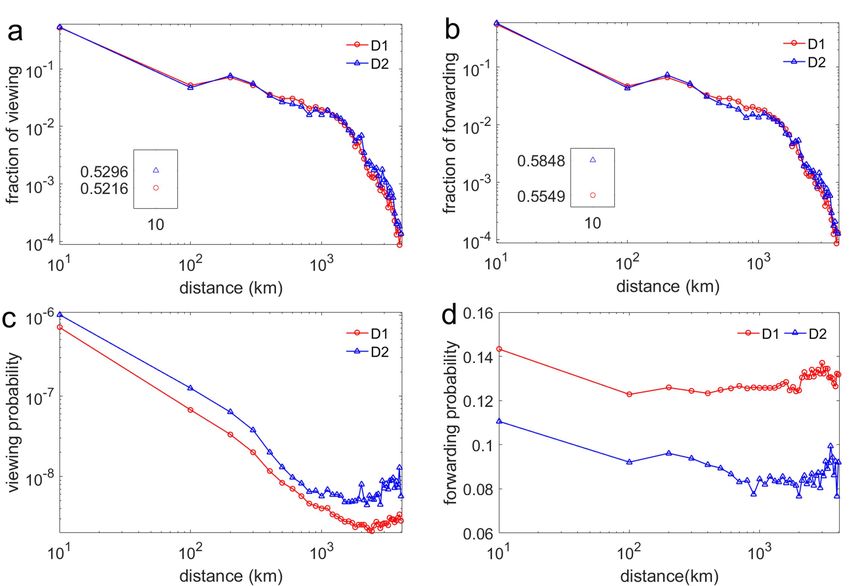
ISPRS Int. J. Geo-Inf. 2018, 7, 189                                                                            6 of 16

      Figure 2. Geographic location and distance distribution of users of the two datasets. The map of both
      (a,b) includes 382 cities in China. The dot in the map indicates city’s geographic location and its colour
      (black, blue, green, and red) represents the number of users in the city; (c) describes the number of
      users in cities of the two datasets and the corresponding number of subscribers of mobile telephones
      from census. It shows only the 30 cities with the largest number of subscribers of mobile telephones.
      The two datasets cover approximately 10% of census data; (d) displays the distance distribution of city
      pairs and the corresponding users of the two datasets. x-axis represents geographic distance and the
      interval is 100 km. The distance between users is the distance between their cities. Both city pairs and
      the corresponding users distribute a left-skew bell-type, with more than 90% data concentrated in the
      distance range of [200, 2700] km.

      Third, all the viewing and forwarding actions are grouped by distance or location in city level.
As shown in Figure 1b, if at time t1 user ui views the information shared by user u j at time t0 ,
the corresponding geographic distance of this viewing action is dij , and the corresponding response
time is t1 − t0 . If user ui forwards the message at t2 in city cm , the corresponding geographic distance of
this forwarding action is also dij . The corresponding geographic location is cm and the corresponding
decision-making time is t2 − t1 . For geographic distance, the four metrics are calculated, respectively.
For geographic location, we consider only the forwarding probability and decision-making time because
the viewing probability and the response time may include two different cities. Normally, the number
of possible viewing action should be the number of neighbours in the friend network. However,
we cannot get the user relationship in WeChat, so we assume that any two users can view each other.
For each forwarding action in each page, we extract the response time for all viewing action caused by
the forwarding, and then combine them to consider. For each viewing action in each page, we extract
the decision-making time for all forwarding actions if happened, and then combine them to consider.
Therefore, for each group of geographic distance d or location l, the four metrics are defined and
calculated as follows: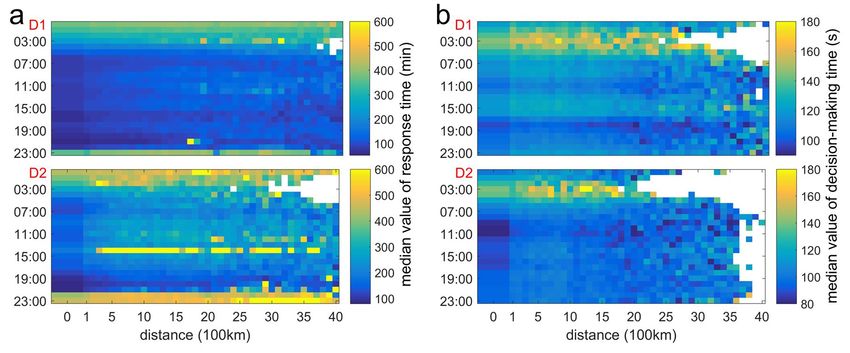
ISPRS Int. J. Geo-Inf. 2018, 7, 189                                                                   7 of 16

(i)   The viewing probability
                                                d
                                               Pview = Nvd /Nvd0 ,                                       (1)

     where Nvd and Nvd0 denote the number of actual viewing action and possible viewing action in
     group d, respectively. It characterizes the availability or possibility of obtaining information. It is
     usually limited by the links of its social network.
(ii) The forwarding probability
                                             Pfd,lorward = N d,l d,l
                                                             f /Nv ,                                     (2)

      where N d,l         d,l
                f and Nv denote the number of actual forwarding action and viewing action in group d
      or l, respectively. It measures the value or possibility of spreading the information. It is generally
      determined by the correlation between information content and user’s preference.
(iii) The response time
                                                   n                    o
                                             d
                                            Tres = t | t = ( t1 − t0 ) d ,                               (3)

     where t0 denotes the time when the message was forwarded by others and t1 denotes the time
     when the user views the message. It is a set of the time periods all users in group d take for viewing
     the information forwarded by others. It is usually determined by users’ habits and preferences of
     using social networking platforms.
(iv) The decision-making time
                                                 n                 o
                                          d,l
                                        Tdec  = t|t = (t2 − t1 )d,l ,                                    (4)

      where t1 denotes the viewing time and t2 denotes the forwarding time of the same user. It is a
      set of the time periods all users in group d or l take for forwarding the information after viewing.
      It often depends on the attraction of information content.

     Different from the viewing probability and the forwarding probability, both the response time and
the decision-making time are a distribution (not a value) when grouped by geographic factors, and are
closely related with the user’s day-to-day habits. The distribution of user’s daily viewing action and
forwarding action is shown in Figure 3a,b. The peak periods occur at eight in the morning and at nine
in the evening regardless of the viewing or forwarding action. Obviously, the probability of viewing
action and forwarding action during the day is much higher than at night, which is similar to the usual
pattern of human behaviour [14]. In Figure 3c,d, both the response time and the decision-making time
of the two datasets follow a fat-tailed distribution, indicating that the vast majority of time intervals
between users’ sequential actions are small, and only a few of them can be up to an hour, a day, a week,
or even a month. For dataset D1, the percentage of users who response the information forwarded by
friends within ten minutes, one hour, one day, and one week is 15.34%, 41.92%, 93.27%, and 98.88%,
respectively. For dataset D2, the percentage of users who response the information forwarded by
friends within ten minutes, one hour, one day, and one week is 13.34%, 33.98%, 79.93%, and 93.17%,
respectively. For dataset D1, the percentage of users who make forwarding decisions within one
minute, ten minutes, one hour, and one day is 28.32%, 93.95%, 97.01%, and 99.25%, respectively.
For dataset D2, the percentage of users who make forwarding decisions within one minute, ten
minutes, one hour, and one day is 36.35%, 89.71%, 92.77%, and 97.01%, respectively. The longer
the time interval, the lower the corresponding viewing and forwarding frequency, except at the tail
showing peaks in days. The limited daily fixed habits of some users, e.g., someone just checks the
WeChat at 9:00 p.m., lead to the daily peak in the tail. Figure 3c shows the response time roughly
follows a log-normal distribution of the two datasets, with parameters and their 95% confidence
intervals µ D1 = 4.4632 ± 0.0005, µ D2 = 5.2162 ± 0.0010, σD1 = 1.9898 ± 0.0003, σD2 = 2.5059 ± 0.0006
for datasets D1 and D2, respectively. Figure 3d depicts the decision-making time roughly follows a
power-law distribution of the two datasets when the time periods are larger than or equal to one hour,
with slope parameters λ D1 = 1.43994, λ D2 = 1.2510 for datasets D1 and D2, respectively.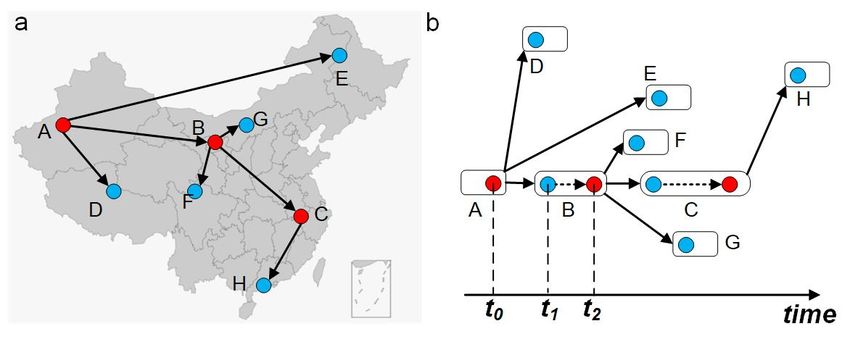
ISPRS Int. J. Geo-Inf. 2018, 7, 189                                                                         8 of 16

      Figure 3. Distribution of users’ daily viewing action and forwarding action, the response time, and the
      decision-making time of the two datasets. (a,b) show the daily viewing and forwarding frequency
      respectively; (c) shows the response time roughly follows a log-normal distribution; (d) depicts the
      decision-making time roughly follows a power-law distribution when the time periods are larger than or
      equal to one hour. Both the response time and decision-making time follow a fat-tailed distribution and
      the tails of the two distributions show peaks in days.

     The distributions of the response time and the decision-making time are fat-tailed, whether grouped
according to geographic distance, location, or at a different time of day. Therefore, we choose the
median value of the distribution as an indicator when characterizing the impact of geographic factors
on the velocity of information dissemination in mobile social networks in the following subsections.

3. Results
     The results consist of four parts: distance and probability, location and probability, distance and
velocity, and location and velocity.

3.1. Distance and Probability
      We first examine the distance distribution of the viewing action and the forwarding action
before analysing the viewing probability and the forwarding probability. Both the viewing action and the
forwarding action of the two datasets follow almost the same fat-tail distribution in distance, as shown
in Figure 4a,b. When the distance equals 10 km, i.e., the two users involved in the viewing action are
located in the same city as we have assumed before, the proportion of the viewing action is in the range
of (52%, 53%) and the proportion of the forwarding action is between 55% and 58%. The proportion of
the forwarding action is a little higher than the proportion of the viewing action, indicating that users
in the same city are more likely to forward the information after viewing than users in different cities.
                                                                                  d
      Second, we explore the distance distribution of the viewing probability Pview   and the forwarding
              d
probability Pf orward . As shown in Figure 4c, the viewing probability roughly follows a power-law
distribution when distance scaling, indicating that the probability of viewing declines non-exponentially
in distance. The power-law distance distribution of online interaction has also been observed in
other research [19,20]. The forwarding probability exhibits independently of distance, as shown in
Figure 4d. Although the user does not pay attention to the location of the information source when
viewing information, the geographic distance limits its possible social connections, thus limiting
the access to information that they may view. It further proves the role of geographic distance in
information dissemination in mobile social networks: it constrains the access to information through
ISPRS Int. J. Geo-Inf. 2018, 7, 189 9 of 16
social relationships; then, the effect disappears once users are able to obtain and view the information in
mobile social networks. The effect of geographic distance on the viewing probability and the forwarding
probability is similar of the two datasets, indicating that distance decay effect of the information
dissemination probability is relatively stable in the WeChat social network.
Figure 4. Geographic distance distribution of the viewing action and the forwarding action, and the
viewing probability and the forwarding probability of the two datasets. (a,b) show that both the viewing
action and the forwarding action of the two datasets follow almost the same fat-tail distribution in
distance. The inset graph is a magnification of the main graph. When the distance equals 10 km, i.e.,
the two users involved in the viewing action are located in the same city as we have assumed before,
the proportion of the viewing action is in the range of (52%, 53%) and the proportion of the forwarding
action is between 55% and 58%; (c,d) display the distance distribution of the viewing probability and
the forwarding probability in log-log/linear-log coordinate, respectively. The viewing probability roughly
follows a power-law distribution when distance scaling, while the forwarding probability exhibits
independent of distance.
3.2. Location and Probability
Different from geographic distance, which affects the probability of information dissemination
by influencing the link possibility, the influence of geographic location may come from the collective
behaviour preference formed for a long time of a region. We consider the impact of geographic location
on the probability of information dissemination from two perspectives.
We first examine the intra-region viewing rate, i.e., the number of the viewing actions in which
the viewer and sharer are located in the same region over the total number of the viewing action.
Higher intra-region viewing rate indicates that there is relatively little communication between the
region and the outside world. Figure 5 depicts the geographic location distribution of the intra-region
viewing rate. The location distribution of the two datasets is significantly strongly correlated. In city
level, the correlation coefficient is 0.8426 with p = 0. As shown in Figure 5a,c,e, with the exception
of ethnic minority areas, tourist cities, and cities with high population mobility, the viewing rates of
capital cities in the province tend to be the lowest, indicating that capital cities are more convenientISPRS Int. J. Geo-Inf. 2018, 7, 189 10 of 16
to communicate with the outside world and have easier access to various resources. At the province
level, the correlation coefficient is 0.8188 with p = 0. As shown in Figure 5b,d,f, minority areas or
provinces with a large floating population usually have a relatively lower intra-region viewing rate,
such as Taiwan, Tibet, Hainan, Hong Kong, and Guangdong. In contrast, Chongqing, Shandong and
Shanxi are more conservative, and users in these regions are more inclined to communicate with
people around. It can be seen that users in North China and Chongqing are more conservative; they
pay more attention to the information from the region. North China, including Shanxi, Hebei, Henan
and Shandong, is located in the lower reaches of the Yellow River and is the birthplace of Chinese
civilization. A long history of traditional culture may be the reason why people in this region are more
conservative. The reason why people in Chongqing are conservative is not only because she has the
unique mountain geography, but also because she is the youngest municipality in China.
Figure 5. Geographic location distribution of the intra-region viewing rate of the two datasets. (a,b)
depict the map of the intra-region viewing rate grouped by city and province of dataset D1, respectively;
(c,d) display the map of the intra-region viewing rate grouped by city and province of dataset D2,
respectively; (e,f) show distribution of the intra-region viewing rate in city and province level of the
two datasets, respectively. The city/province in (e)/(f) is sorted by the average value of the intra-region
viewing rate of the two datasets. See details in Supplementary Tables S2 and S3.
Second, we explore the geographic location distribution of the forwarding probability Pfl orward of
the two datasets, as shown in Figure 6. The location distribution of the two datasets is significantly
strongly correlated (The value of the forwarding probability in a specific city or province is obviouslyISPRS Int. J. Geo-Inf. 2018, 7, 189 11 of 16
different between the two datasets; it may be caused by other factors, e.g., information content, which
is not the focus of this article). In city level, the correlation coefficient is 0.4399 with p = 0, as shown
in Figure 6a,c,e. In province level, the correlation coefficient is 0.7718 with p = 0. As shown in
Figure 6b,d,f, provinces in the north of China have a relatively higher forwarding probability, such as
Liaoning, Jilin, Heilongjiang, and Shandong. In contrast, provinces in the south of China usually have
a lower forwarding probability, like Guangdong, Guangxi, and Fujian. It indicates that northerners
are more interested in forwarding information than southerners in China. The so-called “Rush to
Northeast”, i.e., the modern Shandong migration to the Northeast, leads to consistency in the forwarding
probability of users in Shandong and the three northeastern provinces. In addition, the difference in
forwarding probability from north to south may be a manifestation of cultural differences between the
north and south of China.
Figure 6. Geographic location distribution of the forwarding probability of the two datasets. (a,b) depict
the map of the forwarding probability grouped by city and province of dataset D1, respectively; (c,d)
display the map of the forwarding probability grouped by city and province of dataset D2, respectively;
(e,f) show distribution of the forwarding probability in city and province level of the two datasets,
respectively. The city/province in (e)/(f) is sorted by the average value of the forwarding probability of
the two datasets. See details in Supplementary Tables S2 and S3.ISPRS Int. J. Geo-Inf. 2018, 7, 189 12 of 16
3.3. Distance and Velocity
Normally, the rules of human activity, e.g., when and how often to log in WeChat in a day,
d and the decision-making time T d . To this
will have a significant influence on both the response time Tres dec
end, we explore the threefold relationship between distance, time of day, the response time, and the
decision-making time. Figure 7a,b show the heat maps of median value of the response time and the
decision-making time as a function of distance and time of day, respectively. We observe that both the
response time and the decision-making time strongly depend on the users’ daily activity rules, but rely
very little on the geographic distance between them. For both the response time and the decision-making
time, the median value is relatively low in the daytime and high in the nighttime, corresponding to
most people’s active and rest time. The information forwarded between 11 p.m. and 4 a.m. is usually
viewed at the slowest speed, and, if a user views a message between 2 a.m. and 6 a.m., the decision
to make a forward will take longer. We can therefore conclude that the temporal pattern of human
behaviour of using WeChat is a decisive factor for both the response time and the decision-making time,
and the effect of geographic distance is negligible in comparison to that. The reason is that mobile
social networks makes the time cost due to geographic distance negligible.
Figure 7. Threefold relationship between distance, time of day, the response time, and the decision-making
time of the two datasets. (a,b) show the impacts of the response time and the decision-making time of the
two datasets, respectively. The blank part of the heat map indicates that there is too little data, i.e., less
than 50, to calculate the median value for the corresponding distance and time of day. The zero scale
on the x-axis indicates the distance of users in the same city.
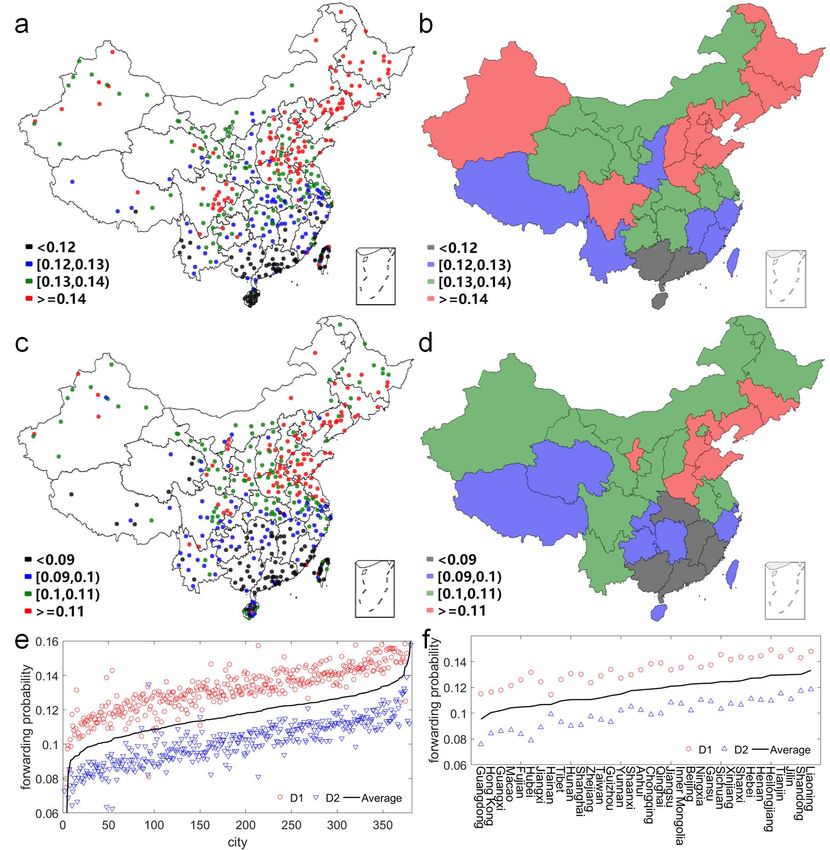
3.4. Location and Velocity
Different from distance, geographic location not only affects human behaviour, but also has an
impact on the social networking structure. As shown in Figure 8, the geographic location distribution
of the decision-making time of the two datasets is significantly correlated. At city level, the correlation
coefficient is 0.3561 with p = 0. Users in northeastern and northwestern cities as well as coastal
cities make decisions more quickly, as shown in Figure 8a,c,e. At the province level, the correlation
coefficient is 0.5175 with p = 0.0017. As shown in Figure 8b,d,f, users in Guangxi, Yunnan and
Jiangxi province have a relatively longer decision-making time, comparing with users in Liaoning and
Jilin province. On the one hand, users in northern China are more straightforward while making
forwarding decisions, whereas southern users are more cautious. It leads to differences between North
and South china in decision-making time. On the other hand, due to the economic development, users
in coastal cities have a faster pace of life, as well as information processing speed.ISPRS Int. J. Geo-Inf. 2018, 7, 189 13 of 16
Figure 8. Geographic location distribution of the decision-making time of the two datasets. (a,b) depict
the map of the median value of the decision-making time grouped by city and province of dataset D1,
respectively; (c,d) depict the map of the median value of the decision-making time grouped by city and
province of dataset D2, respectively; (e,f) show distribution of the median value of the decision-making
time at the city and province levels of the two datasets, respectively. The city/province in (e)/(f) is
sorted by the average value of the median value of the decision-making time of the two datasets. See
details in Supplementary Tables S2 and S3.
4. Discussion and Conclusions
Mobile social networks facilitate the spread of various kinds of information, including daily
communications, service information of enterprise and government, advertisements, and even
rumours. As one of the best bridges connecting the virtual space and the physical world, geographic
factors play a vital role in the information dissemination in mobile social networks. Previous related
works are mostly limited to self-reported data from social networks, e.g., Facebook and Twitter,
or location-based Foursquare, and rely on samples of users or messages [19,32,36,37]. Compared with
these platforms, WeChat is a typical mobile social network and WeChat integrates many location-based
services in its ecosystem, including payment, QR codes, shopping, gaming, entertainment and so
on [38]. In this work, we conduct a large scale analysis based on WeChat datasets. We can get more
accurate geographic location and distance between users via IP address. In order to obtain relatively
general results and to facilitate the application, we only consider the geographic factors and ignore
the interference of other complex factors, e.g., the demographics of users and the content of the
information. The probability and velocity of information dissemination are characterized by fourISPRS Int. J. Geo-Inf. 2018, 7, 189 14 of 16
metrics, namely viewing probability, forwarding probability, response time and decision-making time. On this
basis, we comprehensively analysed the impact of geographic factors on the information dissemination
in mobile social networks.
We discover that geographic distance and location play very different roles in the information
dissemination in mobile social networks. On the one hand, the results verify the distance decay
effect of the information dissemination probability, and demonstrate that the velocity of information
dissemination is not dependent on geographic distance. On the other hand, both the probability
and velocity of information dissemination show heterogeneity and diversity of geographic location.
Furthermore, we analyse why distance and location play different roles on the probability and velocity
of information dissemination in mobile social networks. Geographic distance constrains users’ access
to information through geospatial constrained social links, while location affects the information
dissemination by spatial proximity and similarity. The diversity and heterogeneity can be attributed
to regional cultural differences, immigration streams, and industry distributions to some extent.
Geographic factors do play an important role in the process of information dissemination. Although
some of the conclusions are obvious, we exploit large scale WeChat datasets to prove these conclusions
for the first time.
Our work indicates many possibilities for future work, ranging from data driven modelling of
information dissemination that can reproduce the spatial-temporal properties observed in empirical
datasets to a more detailed explorer of location-based applications, including mobile social services,
public opinion regulation and precision marketing. On the one hand, big data from social networks
can support data-driven modelling of human behaviour and information dissemination. At the same
time, the diverse computing, including cloud computing and edge computing, will be helpful for
large-scale simulations. On the other hand, how to apply related research results to specific fields also
requires the participation of scientists, entrepreneurs, governments and social media.
Supplementary Materials: The following are available online at http://www.mdpi.com/2220-9964/7/5/189/s1.
Table S1: Locations, codes, and number of users of 382 cities; Table S2: Intra-region viewing rate, forwarding
probability and decision-making time of 382 cities; Table S3: Intra-region viewing rate, forwarding probability
and decision-making time of 34 provinces.
Acknowledgments: The authors would like to thank Dandan Ning, Jian Dong and Fang Zhang for cleaning and
analysis of the data, thank Alexander Verbraeck for the English editing. This study is supported by National
Key Research and Development (R&D) Plan under Grant No. 2017YFC1200300 and National Natural Science
Foundation of China under Grant Nos. 71673292 and 61503402 and Guangdong Key Laboratory for Big Data
Analysis and Simulation of Public Opinion and National Social Science Foundation of China under Grant
No. 17CGL047.
Author Contributions: L.L. conceived the study; L.L., B.C. and L.H. performed research; L.L., C.A. and Y.W.
analyzed the data; L.L. wrote the paper; B.C., X.Q. and X.L. revised the paper. All authors read and approved the
final manuscript.
Conflicts of Interest: The authors declare no conflict of interest. The founding sponsors had no role in the design
of the study; in the collection, analyses, or interpretation of data; in the writing of the manuscript, and in the
decision to publish the results.
References
1. York, S.N. Mobile Social Network; Springer: New York, NY, USA, 2016; pp. 950–950.
2. Kwak, H.; Lee, C.; Park, H.; Moon, S. What is Twitter, a social network or a news media? In Proceedings of
the 19th International Conference on World Wide Web, Raleigh, NC, USA, 26–30 April 2010; ACM: New York,
NY, USA, 2010; pp. 591–600.
3. Condessa, F.; Marculescu, R. From Ideas to Social Signals: Spatiotemporal Analysis of Social Media Dynamics.
In Proceedings of the 2nd International Workshop on Social Sensing, Pittsburgh, PA, USA, 18–21 April 2017;
ACM: New York, NY, USA, 2017; pp. 29–34.
4. Guille, A.; Hacid, H.; Favre, C.; Zighed, D.A. Information diffusion in online social networks: A survey.
ACM SIGMOD Rec. 2013, 42, 17–28.ISPRS Int. J. Geo-Inf. 2018, 7, 189 15 of 16
5. Kietzmann, J.H.; Hermkens, K.; McCarthy, I.P.; Silvestre, B.S. Social media? Get serious! Understanding the
functional building blocks of social media. Bus. Horiz. 2011, 54, 241–251.
6. Liu, L.; Chen, B.; Jiang, W.; He, L.; Qiu, X. Spatio-temporal dynamics of web pages diffused in WeChat.
Inf. Discov. Deliv. 2017, 45, 139–148.
7. Liu, L.; Qu, B.; Chen, B.; Hanjalic, A.; Wang, H. Modeling of information diffusion on social networks with
applications to WeChat. Phys. A Stat. Mech. Appl. 2018, 496, 318–329.
8. Mascolo, C. The Power of Mobile Computing in a Social Era. IEEE Internet Comput. 2010, 14, 76–79.
9. Barabási, A.L.; Albert, R. Emergence of scaling in random networks. Science 1999, 286, 509–512.
10. Watts, D.J. A simple model of global cascades on random networks. Proc. Natl. Acad. Sci. USA 2002, 99,
5766–5771.
11. Hethcote, H.W. The mathematics of infectious diseases. SIAM Rev. 2000, 42, 599–653.
12. Barabási, A. The origin of bursts and heavy tails in human dynamics. Nature 2005, 435, 207–211.
13. Yang, J.; Leskovec, J. Modeling information diffusion in implicit networks. In Proceedings of the 2010 IEEE
International Conference on Data Mining, Washington, DC, USA, 13–17 December 2010; pp. 599–608.
14. Zhou, T.; Han, X.P.; Yan, X.Y.; Yang, Z.M.; Zhao, Z.D.; Wang, B.H.; Center, W.S. Statistical Mechanics on
Temporal and Spatial Activities of Human. Dianzi Keji Daxue Xuebao/J. Univ. Electron. Sci. Technol. China
2013, 4, 481–540.
15. Feng, L.; Hu, Y.; Li, B.; Stanley, H.E.; Havlin, S.; Braunstein, L.A. Competing for attention in social media
under information overload conditions. PLoS ONE 2015, 10, e0126090.
16. Qu, B.; Li, Q.; Havlin, S.; Stanley, H.E.; Wang, H. Nonconsensus opinion model on directed networks.
Phys. Rev. E 2014, 90, 052811.
17. Bakshy, E.; Rosenn, I.; Marlow, C.; Adamic, L. The role of social networks in information diffusion.
In Proceedings of the 21st international conference on World Wide Web, Lyon, France, 16–20 April 2012;
ACM: New York, NY, USA, 2012; pp. 519–528.
18. Baños, R.A.; Borge-Holthoefer, J.; Moreno, Y. The role of hidden influentials in the diffusion of online
information cascades. EPJ Data Sci. 2013, 2, 1.
19. Laniado, D.; Volkovich, Y.; Scellato, S.; Mascolo, C.; Kaltenbrunner, A. The Impact of Geographic Distance
on Online Social Interactions. Inf. Syst. Front. 2017, doi:10.1007/s10796-017-9784-9.
20. Deville, P.; Song, C.; Eagle, N.; Blondel, V.D.; Barabãsi, A.L.; Wang, D. Scaling identity connects human
mobility and social interactions. Proc. Natl. Acad. Sci. USA 2016, 113, 7047–7052.
21. Song, C.; Koren, T.; Wang, P.; Barabási, A. Modelling the scaling properties of human mobility. Nat. Phys.
2010, 6, 818–823.
22. Barthélemy, M. Spatial networks. Phys. Rep. 2011, 499, 1–101.
23. Scellato, S.; Noulas, A.; Lambiotte, R.; Mascolo, C. Socio-spatial properties of online location-based social
networks. ICWSM 2011, 11, 329–336.
24. Cho, E.; Myers, S.A.; Leskovec, J. Friendship and mobility: User movement in location-based social networks.
In Proceedings of the 17th ACM SIGKDD International Conference on Knowledge Discovery and Data
Mining, San Diego, CA, USA, 21–24 August 2011; ACM: New York, NY, USA, 2011; pp. 1082–1090.
25. Illenberger, J.; Kai, N.; Flötteröd, G. The Role of Spatial Interaction in Social Networks. Netw. Spat. Econ.
2013, 13, 255–282.
26. Scellato, S.; Mascolo, C.; Musolesi, M.; Latora, V. Distance matters: Geo-social metrics for online social
networks. In Proceedings of the WOSN 2010: 3rd Conference on Online social networks, Boston, MA, USA,
22–25 June, 2010; p. 8.
27. Erlander, S.; Stewart, N.F. The Gravity Model in Transportation Analysis—Theory and Extensions; CRC Press:
Boca Raton, FL, USA, 1990.
28. Barabási, A.L.; Maritan, A.; Simini, F.; González, M.C. A universal model for mobility and migration patterns.
Nature 2012, 484, 96.
29. Goldenberg, J.; Levy, M. Distance is not dead: Social interaction and geographical distance in the internet
era. arXiv Preprint 2009, arXiv:0906.3202.
30. Mok, D.; Wellman, B.; Carrasco, J. Does distance matter in the age of the Internet? Urban Stud. 2010,
47, 2747–2783.ISPRS Int. J. Geo-Inf. 2018, 7, 189 16 of 16
31. Leskovec, J.; Horvitz, E. Planetary-scale views on a large instant-messaging network. In Proceedings of the
17th International Conference on World Wide Web, Beijing, China, 21–25 April 2008; ACM: New York, NY,
USA, 2008; pp. 915–924.
32. Spiro, E.S.; Almquist, Z.W.; Butts, C.T. The Persistence of Division: Geography, Institutions, and Online
Friendship Ties. Socius 2016, 2, 2378023116634340.
33. Brockmann, D.; Hufnagel, L.; Geisel, T. The scaling laws of human travel. Nature 2006, 439, 462–465.
34. Ugander, J.; Karrer, B.; Backstrom, L.; Marlow, C. The Anatomy of the Facebook Social Graph. arXiv Preprint
2011, arXiv:1111.4503.
35. Glassman, C.C.N.R. Location-Based Services: Foursquare and Gowalla, Should Libraries Play? J. Electron.
Resour. Med. Libr. 2010, 7, 336–343.
36. Lee, K.; Ganti, R.K.; Srivatsa, M.; Liu, L. When twitter meets foursquare: Tweet location prediction using
foursquare. In Proceedings of the International Conference on Mobile and Ubiquitous Systems: Computing,
Networking and Services, London, UK, 2–5 December 2014; pp. 198–207.
37. Jurgens, D.; Finethy, T.; Mccorriston, J.; Xu, Y.T.; Ruths, D. Geolocation Prediction in Twitter Using Social
Networks: A Critical Analysis and Review of Current Practice. In Proceedings of the The International
Conference on Weblogs and Social Media, Oxford, UK, 26–29 May 2015.
38. Tencent. Tencent Announces 2017 Fourth Quarter and Annual Results. Available online: https://www.
tencent.com/en-us/investor.htm (accessed on 21 March 2018).
39. Song, J.; Ke, X.U.; Song, M.; Zhan, X. Credibility evaluation method of domestic IP address database.
J. Comput. Appl. 2014, 34, 4–6.
40. Ai, C.; Chen, B.; He, L.; Lai, K.; Qiu, X. The national geographic characteristics of online public opinion
propagation in China based on WeChat network. Geoinformatica 2018, 22, 311–334.
41. Chen, X. China City Statistical Yearbook 2016; China Statistic Press: Beijing, China 2017.
42. Libennowell, D.; Novak, J.; Kumar, R.; Raghavan, P.; Tomkins, A. Geographic routing in social networks.
Proc. Natl. Acad. Sci. USA 2005, 102, 11623.
c 2018 by the authors. Licensee MDPI, Basel, Switzerland. This article is an open access
article distributed under the terms and conditions of the Creative Commons Attribution
(CC BY) license (http://creativecommons.org/licenses/by/4.0/).You can also read