CHIRAL GLASS OF CHARGED DNA RODS, CAVITY LOOPS - JUSER
←
→
Page content transcription
If your browser does not render page correctly, please read the page content below
Journal of Physics Communications

PAPER • OPEN ACCESS

Chiral glass of charged DNA rods, cavity loops
To cite this article: Kyongok Kang 2021 J. Phys. Commun. 5 065001

View the article online for updates and enhancements.

                            This content was downloaded from IP address 134.94.122.185 on 07/06/2021 at 07:34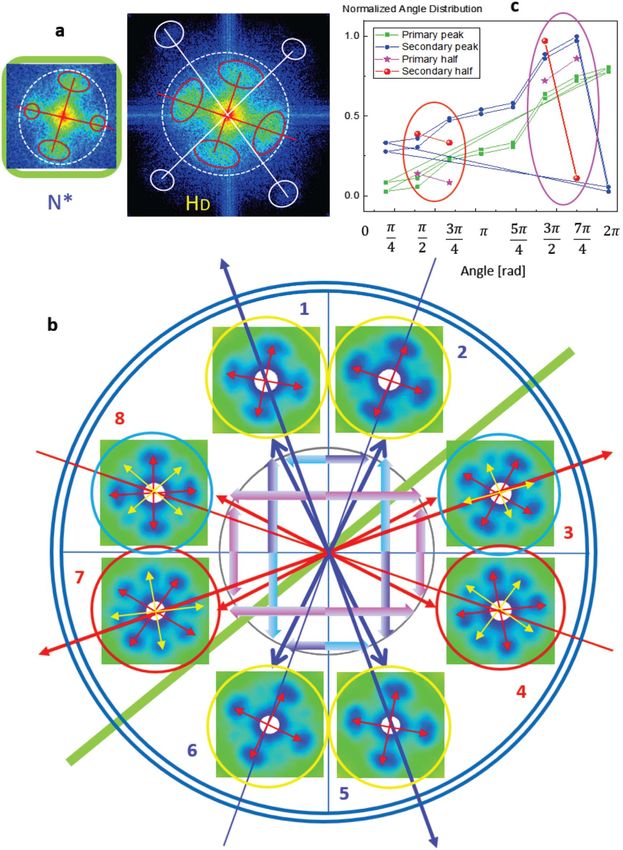
J. Phys. Commun. 5 (2021) 065001                                                            https://doi.org/10.1088/2399-6528/ac050b

                              PAPER

                              Chiral glass of charged DNA rods, cavity loops
OPEN ACCESS
                              Kyongok Kang
RECEIVED
2 February 2021               Forschungszentrum Jülich, Institute of Biological Information Processing, IBI-4, Biomacromolecular Systems and Processes, Jülich,
                              Germany
REVISED
11 May 2021                   E-mail: k.kang@fz-juelich.de
ACCEPTED FOR PUBLICATION
                              Keywords: Equilibrium phase diagram of charged DNA virus, replica symmetry breaking, chiral glass, cavity loops, image-time correlation,
25 May 2021
                              divergence of relaxations, pitch variances
PUBLISHED
3 June 2021                   Supplementary material for this article is available online

Original content from this
work may be used under
the terms of the Creative
                              Abstract
Commons Attribution 4.0       Recently, the collective phase behaviors of charged DNA-viruses (rods) are explored in various low
licence.
                              ionic strengths, where much slowing down relaxations are observed in equilibrium. These phases are
Any further distribution of
this work must maintain       distinguished by crossing the critical ionic strength, where the salt-dependent effective microscopic
attribution to the
author(s) and the title of    dynamics are important with non-monotonic multi-phase boundaries. This is also interested in terms
the work, journal citation    of phase transition and replica symmetry breaking (RSB), realized by the divergence of relaxation time
and DOI.
                              and the exponent power of correlation lengths in dynamic disorderorder transitions. RSB occurs as
                              the result of many-body interactions of randomized orientations. Here, in this paper, one of the chiral
                              mesophases, the X-pattern is highlighted for its long-time metastable state consisting of cavity loops
                              bounded within the planar nematic, as a new type of a glass, noted as a chiral glass. The chiral glass is
                              discussed in terms of the divergences for relaxations in the characteristic time as well the inverse of an
                              optical pitch length, which are analyzed in the long-time-lapsed orientation textures via image-time
                              correlations. The outcome highlights interesting aspects of charge effect in the ‘twist’ elasticity energy
                              for optimizing the long-ranged repulsive electrostatic interactions among charged DNA rods.

                              1. Introduction

                              The slow dynamics of collective phenomena is interesting itself for various thermodynamic systems. It has been
                              already known that 3d Ising spin glass is generally driven by a strong and critical slowing down [1], shown by
                              large-scale MC simulations of 3D short-ranged Heisenberg spin glass. The chiral susceptibility decreases with
                              lowering temperature, but it increases again to reach an equilibrium [2]. The interest is a dynamic changes of
                              local orientation orders approaching transition, at a higher temperature, which often causes the small energy
                              dissipated in the mean-field approach of replica (entities) with the symmetry breaking, so called the replica
                              symmetry breaking (RSB). In practice, reaching a zero temperature is not feasible, and interpreted by the
                              ‘freezing’ of diffusion, seen in the system of anisotropic metallic alloy of spin-glass pseudobrookite (Fe2TiO5),
                              magnetization states [3], and the plastic crystal phase of hybrid perovskites [4]. Different classes of glass states
                              also exist in thermodynamic systems, as dipolar, quadrupolar glasses [5], and orientational glass of mixed
                              cyanide for orientationally disordered crystals [6–8].
                                  Since the glass transition in bulk phases is rather disordered in collective dynamics, mode-coupling
                              approaches can be used to show dynamical transitions in slowly varying non-ergodicity, including structural
                              correlations. Phase boundaries of a glass state are then often demonstrated by MD simulations between
                              orientation glasses and structural glasses [9]. However, the situation becomes obscure when the decoupling of
                              spin and chirality occurs in the case of many long-ranged interactions for an infinitely large system size. Thus,
                              hierarchical defect structures are often expected to form in the microscopic evolution theory of plastic
                              deformation [10], as seen in the spin glasses with dynamic susceptibility for decay in correlations. Furthermore,
                              the nature of replica symmetry breaking (RBS) is based on the probability distribution of the order parameter,
                              relating to the spin-glass phase coupled to the thermodynamic limit [11]. A valid concern here is how the

                              © 2021 The Author(s). Published by IOP Publishing Ltd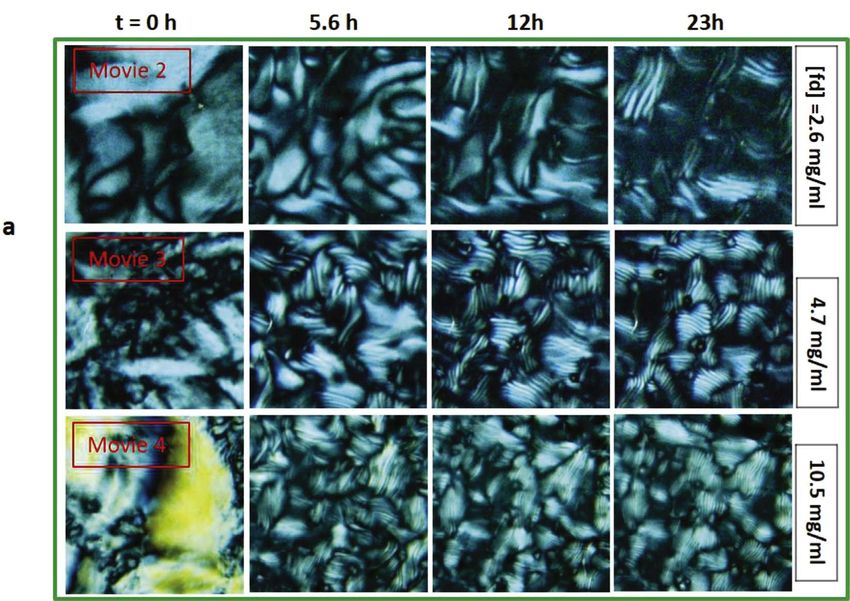
J. Phys. Commun. 5 (2021) 065001                                                                             K Kang

‘overlapping’ regime of an extended volume can be defined in the concentration for existing deformability of the
systems. Thus RSB is a generic feature of crowded systems of particles in thermodynamic equilibrium, where the
internal stress relaxation during equilibration exhibits a sudden jump or discontinuity. In the current system of
charged DNA rods, such RSB is observed through mechanical ‘kinks’ of during the formation of orientational
textures at intermediate rod-concentrations as quantified by means of image-time correlation [12].
     The term ‘chiral glass’ appears, first suggested by Kawamura (1992), in an equilibrium thermodynamic
phase with spontaneously broken symmetries, similar to the Ising spin glasses in high-temperature
superconductors with the exponent powers [13, 14]. Compared to the physics of a ‘well-defined’ spin-glass state
[15], the chirality is a disordered (and ill-defined) state [16]. The characteristics of chiral glass have been
discussed further such that chiral symmetry breaking leading to the chiral-glass transition, in the wavevector
space with the finite-size correlation length [17, 18] (see figure 21 in [17]). The chiral glass appears with a
marginal difference in the long-range power-law interaction, with the exponent power slightly larger than the
value of 1, in which the spin chirality eventually decouples. Possible examples of replica symmetry breaking
(RSB) are in systems when the effective temperature cools down, such as the glass-forming liquids in growing
cavity point-to-set correlations [19–21], as well as the mixed state of ferro- and anti-ferromagnets, and the phase
transitions of the spin-glass state [22]. So far, there has been little experimental evidence for demonstrating
chiral glasses of biologically relevant charged rods in 3D bulk solutions.
     Previously, I have reported the self-similarity and replica symmetry breaking (RSB) that occurred in the
equilibrium phase diagram for crowded suspensions of charged chiral DNA virus (fd) suspensions as a function
of ionic strength [23]. Several distinguishable chiral-mesophases were observed above the isotropicnematic
coexistence concentration (in equilibrium) and lower than the critical ionic strength of 12 mM. In contrast, at a
higher ionic strength, the planar nematics are stable with a marginal isotropicnematic coexistence
concentration. The delicate interplay between the short-ranged helical corecore interactions and the long-
ranged electrostatic interactions leads to variations of an optical pitch (from a chiral-nematic, N*, to a helical
domain, Hd) and hierarchical chirality (in X-pattern and helical domain, Hd). In terms of RSB near the structural
glass, both helical domains and X-patterns are stable at high concentrations, exploited by the long-time kinetic
arrests (LTKAs) in the phase diagram. However, at higher ionic strengths, the glass state faces towards frozen in
with the nematics (see LTKA23). Phase boundaries of different pathways are also shown with twist interactions
of charged DNA viruses (fd rods) at low ionic strengths. This work is motivated by both experiments and semi-
empirical theory concerning the phase behavior and glassy states of charged DNA rods. As compared to the work
previously published [23], the main focus is on the existence of different morphologies of a chiral glass and their
very slow rotational motion. Observations are quantified by means of image-time correlation in real space,
which reveals the divergence of a characteristic length and time.

2. Materials and methods

2.1. Sample preparation and polarized images
The suspensions of charged DNA-viruses (fd) are dialyzed by using a commercial cassette (Slide-A-Lyzer
Dialysis Cassette, 10,000 MWCO 0.5–3 ml capacity) from Thermo Scientific (USA), such that the ionic strength
of each Tris/HCl buffer is balanced with the osmotic reservoir, followed the same protocol in [24]. The activity
of H+ ions will be the same in the reservoir and fd suspension, so that also the pH of the fd suspensions will be
the same, despite the fact that relatively many H+ ions are dissociated from the surface of DNA rods. The
suspensions and osmotic reservoirs with the surrounding air and to account for the amounts of dissolved
hydrated carbon dioxide is provided in the appendix D in [24]). The molecular structure of fd coat proteins
consist of an open N-terminal forming 5-fold symmetry [25], as compared to the closed C-terminal in opposite.
The electrostatic Debye length of the DNA fd-rod is varied by an ionic strength of the reservoir, as
k-1 [nm] = 0.304 c 0 [M ] (at 25°C), where c0 [M] is the ionic strength. A commercially available round glass
Hellma sample cell is used with a circular diameter of 20 mM and a thickness of 1 mM. The total sample volume
is about 380 μl. The cuvette is placed between crossed polarizers to visualize the birefringent domain texture
through a telescopic lens, and the resulting images are recorded using a CCD camera (AxioCam Color A12–312).
The sample cell for the image-time correlation spectroscopy is arranged as follows: light source, polarizer,
sample stage, analyzer, beam shutter, and the CCD camera connected to the PC interface (see figure 1 in [12]).
The time evolution of depolarized optical morphologies for different fd concentrations is captured with varying
ionic strengths.
     For the time-resolved images, a larger field view of the textures was taken with an 18 mm diameter via a
telescopic lens. For the image-time data analysis, various fields of view and time bins are available. Due to the
slow dynamics of the system, each data point in the phase diagram requires 170 up to 300–500 hours, during
which time a CCD camera takes an image every 20–30 min. The marginal variation occurs in approaching

                                              2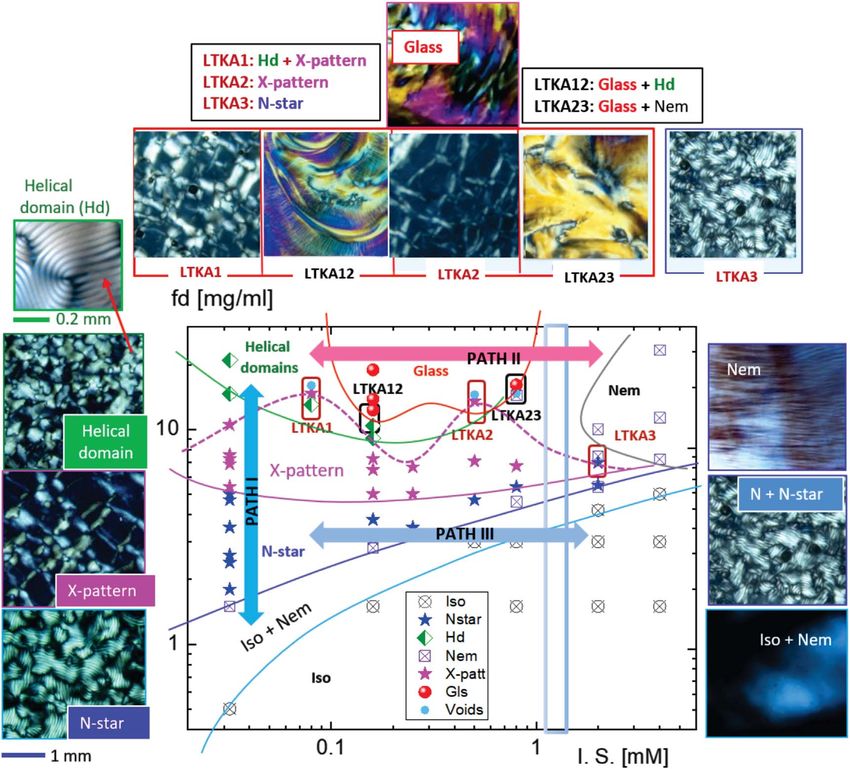
J. Phys. Commun. 5 (2021) 065001                                                                              K Kang

towards the critical ionic strength, where the instability of nematic becomes dominant, compared to the stable
chiral-nematic N*- phase and the X-pattern at low Ionic strengths. A determination of the location of phase
boundaries as given in the phase diagram is taken already such long-lasting experiments. The quantification for
the chiral-nematic (and helical) domain boundaries are now further analyzed in terms of Fourier space image-
time correlations, where time-dependent averages over sectors corresponding to three characteristic length
scales are performed: domains oriented either parallel or perpendicular to the direction of the chiral pitch, and
the length of the chiral-nematic pitch. Fourier transformed images for equilibrated orientational morphologies
for the chiral-nematic (N*) domains are shown in figure 2(a). Fourier transformation of real-space images is
used to distinguish between the occurrence and dynamics of structures on different length scales. Large
structures that exist will give rise to peaks in the Fourier image near the center of that image, while structures
corresponding to a smaller length scale appear as lobes away from the center. A Fourier-transformed image of a
domain texture of chiral-nematic domains typically consists of peaks near the center of the Fourier image
originating from the domains and lobes away from the center correspond to the chiral pitch. The image Fourier
transform represents the averaged random orientational distributions of chiral-nematic N*-domains, which
may resemble the spectral intensity distributions appeared as the RSB in the spin-glass system [26]. Here, clearly
lower rod DNA rod concentration (in the left of figure 2(a), smaller FT-ring is shown for the chiral-nematic
domain, compared to the higher concentration for helical domains (HD) with the chiral pitch appeared towards
larger FT-space lobes in the right of figure 2(a). The central intensity peaks are due to the chiral-nematic (N*)
domain size and the outer 4 intensity lobes are due to the chiral pitch length. The results strongly support that the
visualization of distribution of averaged orientations for chiral-nematic (N*) domains in figure 2(b), as well the
local symmetry breaking at the concentrations (of N*-X pattern transition line). The reason for such breaking
symmetry is originated by the existence of collective self-assembly of slight axial asymmetry in the molecular
structures of charged DNA rods (in figure 2(b). The collective arrangement of DNA rods are shown in the optical
morphology under cross polarization for the chiral-nematic N* phase by rotating the samples. Also, the actual
Fourier transforms of orientation distribution in figure 2(b), reveal the partial symmetry breaking in the
reflection (thick green line) and the blue and red lines indicate the global orientations as the primary (blue lines)
and secondary axes (red lines). The normalized angular distributions are shown in figure 2(c), where the primary
peaks show a rather monotonic increase with an increase of the rotational angle, while the secondary peaks are
not only broadly distributed, but also the half peaks can be seen for the symmetry breaking in the reflection of the
primary half.

2.2. Image-time correlations
To analyze the direct orientation texture dynamics in equilibrium, various DNA rod concentrations were
measured at different ionic strengths by image-time (or video) correlation functions, CV(t). A time series of
images was recorded using a CCD camera, where images are typically taken for a larger time variable, every 1030
minutes, over a time span of about 415 weeks. The orientation textures of a long waiting time (40 hours to 3
months) for equilibrium states at a given ionic strength and various concentration are captured under the
polarized light. The sample is loaded in the planar round cuvette with a 1 mm thickness and imaged with a long-
collimated telescopic lens to ensure a larger field of view using a high-resolution CCD camera. Each single image
in a time trace is used to construct an image correlation function from the region of interest, which is typically
300 × 300 (see figure 2 in [12]). Special optics for imaging such broader ROI views (18mm) are achieved using a
telescopic lens under the white light with two crossed polarizer sheets. Details of the principles for image-time
correlation spectroscopy can be found in [27]. From the recorded time-lapsed movie data, image-time
correlations are used for the smaller ROIs (of 7 mm) to obtain here the decay times of bulk orientation textures.
The correlation functions at different waiting times are then shown for various fd concentrations at the lowest
ionic strength (0.032 mM salt), also corresponding to the supplementary data, Movies 2–4, in figure 6 available
online at stacks.iop.org/JPCO/5/065001/mmedia. Here, the focus is on quantifying a new type of glass, known
as chiral glass, that is appeared in the current system and distinguished from the structural glass of an initial
caging. The evidence of a chiral glass is discussed in terms of the divergence of relaxation times and the optical
pitch variances for the slowly rotating fields.

3. Results

3.1. Salt-dependent equilibrium phase behaviors of DNA-virus rod suspensions
A bacteriophage fd is a rod DNA strand consisting of 50 amino acids fd coat proteins (see table 1 in [28]). The
single molecular structure of filamentous bacteriophage fd is a long (L= 880 nm) and thin (bare diameter of
D = 6.6 nm) rod DNA strand with a left-handed chiral core [29, 30]. The persistence length of an fd virus
particle is about 2200–2800nm and the surface is surrounded with 2700 fd coat proteins that are the twisted

                                               3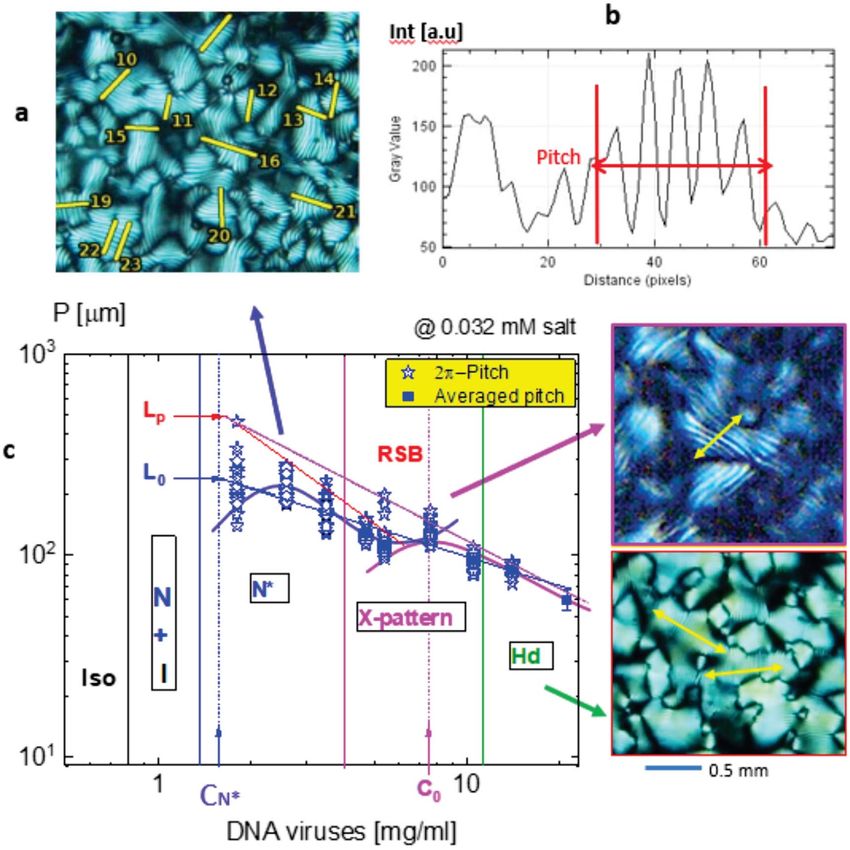
J. Phys. Commun. 5 (2021) 065001                                                                                                       K Kang

  Figure 1. Simplified equilibrium phase diagram of charged DNA viruses (fd) as a function of DNA fd rod con- centration and ionic
  strength: Below the critical ionic strength (1–2 mM salt), various phases are observed as I: isotropic, N + I: nematicisotropic
  coexistence, N*: chiral-nematic, X-pattern, helical domains, and ‘structural’ glass. In contrast, above the critical ionic strength, only
  the planar nematic phase is present. The depolarized optical morphology of different equilibrium phases is provided, where the points
  are measured and lines are drawn as a visual guide. The multiple phases meet around the medium concentration at the critical ionic
  strength of 1–2 mM. Dynamic pathways are indicated as PATHS 1, II, and III across the fd concentration and ionic strength
  (reproduced from the [23]).

helical structure along the filament axis [31], with total charges of an fd virus as 8800 and 7500 elementary
charges [32]. The orientations and collective alignments of charged DNA virus fd rods are shown in the
equilibrium phase diagram (figure 1), with their effective interactions in the plane of DNA rod concentration
and the ionic strength plane. The structural glass is observed to be confined within the helical domains with
phase boundaries at a higher fd concentration for a particularly low ionic strength of 0.16–0.8 mM. By reducing
the DNA virus fd concentration, both the chiral-nematic N* phase and X-pattern are extended to the broader
ranges of DNA rod concentrations. The most pronounced chiral phases are observed at the lowest ionic strength
(0.032mM) with corresponding polarized optical morphologies of the N* phase and helical domains and their
existing slow dynamics. The phase behaviors close to the critical ionic strength of 1–2 mM clearly deviate from
the stable chiral-nematic N* phase (below 0.8 mM salt), while the planar nematic state is present above the
isotopicnematic coexistence phase and above the critical ionic strength. In addition, dynamic pathways of RSB
are depicted as PATHS I, II, and III in the phase diagram demonstrating the main features with different
orientations of chiral-mesophases (in figure 2).
    The application of accessible mobile ions is well demonstrated in the low-frequency electric field-induced
dynamical states for the concentration of an isotopicnematic coexistence in [33–35]. The governing equations of
motions for the effective twist interaction of charged rods can be expressed by the Smoluchowski equation for
the probability density function (PDF) of density and orientations in the overdamped limit. The forces and
torques due to rodrod interactions are then incorporated through the total potential energy. The orientation
dependence of the particle is described by both Dt and Dr for the orientationally averaged translational diffusion
coefficient and the rotational diffusion coefficient of interacting rods, respectively. Furthermore, the gradient

                                                         4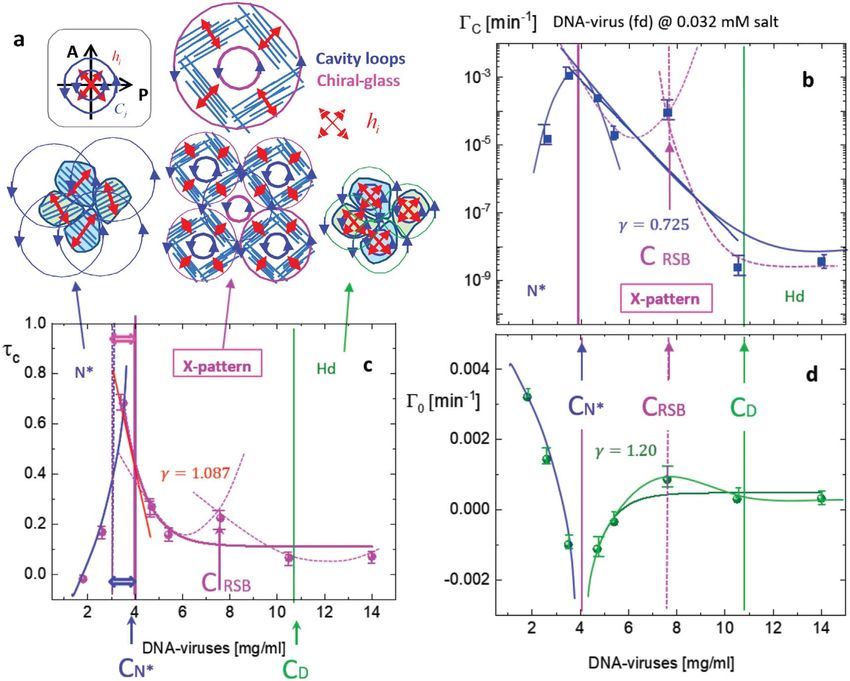
J. Phys. Commun. 5 (2021) 065001 K Kang
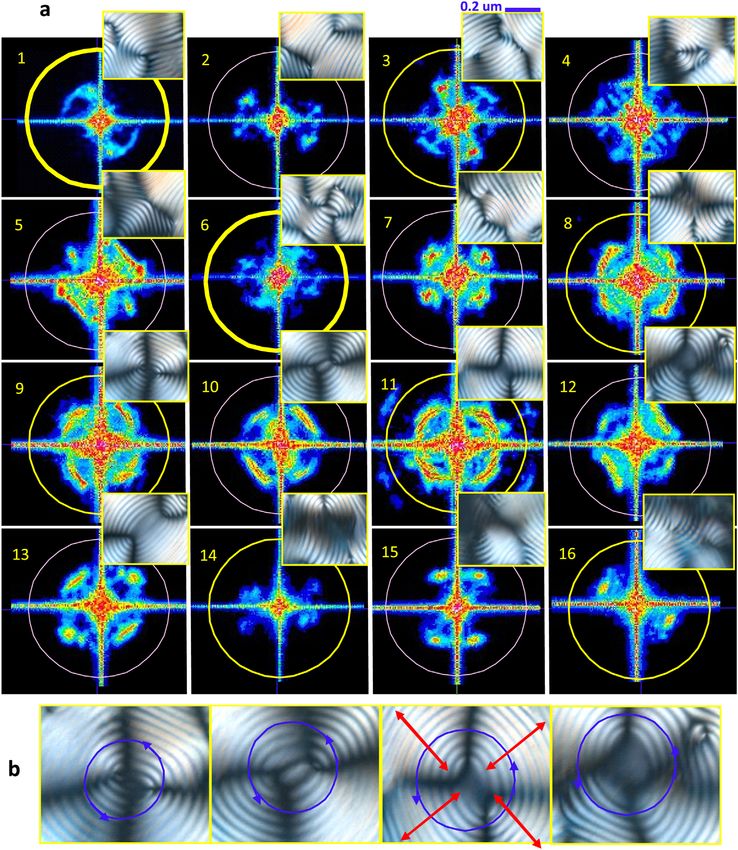
Figure 2. (a) The Fourier transform images of chiral-nematic (N*) and the helical domain (HD) orientation texture, as left and right,
respectively. (b) The Fourier transform of orientation distribution for the chiral-nematic N* phase, rotating the samples between
cross-polarized lights, where the partially broken symmetry is shown in the reflection (thick green line) compared to the blue and red
arrow maintaining the same orientation. The symmetry breaking of local orientations can be seen at the secondary half regions 3–4
and 7–8. (c) Normalized intensity distribution in angular space for the primary and secondary peaks, their half-angles presented in (b).
operator of the rotating field is in relation to the Cartesian coordinates as the cavity loop, Cj. This is due to
randomized orientations of charged fd rods, with long-ranged electrostatic interactions in the bulk elastic
medium. By increasing the concentration, RSB occurs at an intermediate concentration of charged DNA fd rods
in the X-pattern, while the replica of helical domains is formed at higher concentrations at half the size of N*
domains close to the concentration of structural glass.
5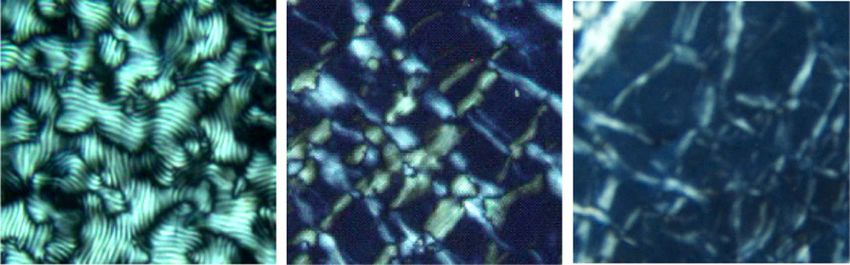
J. Phys. Commun. 5 (2021) 065001                                                                              K Kang

3.2. Rotating field cavity loops and the pitch variances at the X-pattern
As it seen in figure 2(b), the averaged orientations for collective DNA rod arrangements in the chiral-nemtic N*
phase is presented well in the FTs for depicting the projection of bulk polarization states. The main feature of the
global orientations of the N* phase is as follows: The secondary Fourier orientation peaks are shown (in region 3)
at the angle of π/2, among equal distributed peaks, with 8-fold symmetry, π/4 in the FT image observed in the
orientations. The half region 4 is most pronounced for the broken axial symmetries in the primary axes (see 1–5
and 2–6), the reflection symmetries of regions 4–7, and regions 3–8. The axial symmetries exist in the primary
axes (regions 1–5 and 2–6), while the reflection symmetries are broken with the FT image of regions 4–7 and 3–8.
More interestingly, the orthogonal secondary axes (3–7 and 4–8) show broken symmetries for both the axial and
reflection directions for regions 3–8 and 4–7 as well nearby regions 3–4 and 7–8. This suggests that the symmetry
breaking of a chiral-neamtic N* phase is originated by either the collective or cooperative effect of the twist
elasticity or the intrinsic molecular axial symmetry of individual charged DNA rods (5-fold, not 6-fold).
     To further discuss the replica and RSB presented in the equilibrium phases, simple illustrations of self-
similarity with cavity loops are provided in the phase diagram of figure 3 as a means of illustrating the bulk
depolarized optical morphologies of the chiral mesopahses. The replica method is shown, with an increase of the
DNA rod concentration, as the chiral-nematic N* phase and a hierarchical chiral mesophase of helical domains
above the nematicisotropic coexistence concentration. The local helicity axes are indicated as hi, in the top left of
figure 3(a), and the cavity loop is Cj in the depolarized axes of analyzer A and polarizer P. It is worth noting the
X-pattern, between the chiral-nematic N* phase and the helical domains, that occurs by keeping the local
orientations in such a way preventing the collective neighboring of charged DNA rods in the middle. The
X-pattern is located with a wide range of low ionic strengths in the intermediate DNA rod concentration, below
the critical ionic strength (1–2 mM) in the phase diagram. Even more noticeable is the fact that RSB occurs at the
hierarchical chiral mesophase of the X-pattern, bounded within the lower and upper phase boundaries, with two
interesting characteristics: (i) the mechanical kink observed at the lower phase boundary of the X-pattern, from
the N* phase, and (ii) the undulating upper phase boundary of the X-pattern, toward the helical domains and the
structural glass, at higher DNA rod concentrations. This upper phase boundary appears to be different with the
lower boundary line broadly parabolic at low ionic strengths. The reason for such differences indicates the RSB is
driven by the orientational order (at lower phase boundaries) and the particle density (at upper phase
boundaries). Although the size of a cavity loop is similar to the size of N*-phase domains, the local helicity axes
(in the planar alignment) are excluded from the cavity loop due to being decoupled in the X-pattern (see left
panel of figure 3(a)), and bounded for the formation of cavity loops via opposite directions in the rotating field,
as shown in figures 3(a) and (b). As the DNA rod concentration increases, the helical domains are formed as the
half size of N*, close to the concentration of structural glass. Due to an increase of the DNA rod concentration, or
the long waiting time, the most possible local orientations for two neighboring charged DNA rods is the
X-pattern, where the cavity loop is bounded within the planar nematics. This can be understood as the replica
symmetry breaking (RSB), which occurs in the X-pattern, as being indicative of a chiral glass consisting of cavity
loops.
     More characterizations of collective orientations of dynamic self-organization for interacting charged DNA
viruses are shown for the real-space and Fourier transforms As shown before, the self-similarity of the bulk
depolarized optical morphology of the N* phase and helical domains again appears at a decreased length scale
with an increase of the DNA rod concentration in the equilibrium orientation textures at a given low ionic
strength (0.032 mM salt in PATH I). Such self-similarity occurring in the polarized ‘fingerprint’ textures of the
chiral-nematic N* phase also appears in the helical domains at shorter length scales. Figure 4 presents the
different helical domains with their distributions of orientations by varying the rotational angles. The cavity
loops of helical domains Hd also appear in the real space. The collective alignments of chiral charged DNA rods
occur in both bulk orientations and the projection of orientations as the sum of two independent orthogonal
polarizations. The various optical morphologies of helical domains feature different sizes of cavity loops
appearing in the helicity axes, shown as the FT and real space in figure 4. This indicates that the bulk twist elastic
deformations also occur due to the local orientations for the higher concentration of tightly packed helical
domains Hd. The asymmetric and nonlinear distributions of orientations in the helical domains can be directly
observed in the Fourier space (see FT images 1 and 6 in figure 4), indicating that the local symmetry is also
related. Irrespective of the similarity of the twisted nematic and cholesteric fingerprint textures, these helical
domains include combined topological defects and the continuous change of local helicity within dark
disclinations as well the cavity loops that are shown in the current system of charged rods for the X-pattern (see
Movie 1 in figure 3) and in the Hd in figure 4(b), which, however, is not in the cholesteric liquid crystal materials
for thin double layers. What has been varied in our phase diagram is the concentration of the rods and the ionic
strength. The ionic strength changes not only the effective aspect ratio, but also changes the softness of the
interaction potential between the rods, which in turn affects the twist-contribution to the interaction potential.
The latter induces a transition between nematic and chiral nematic. In addition, the number of ions that

                                               6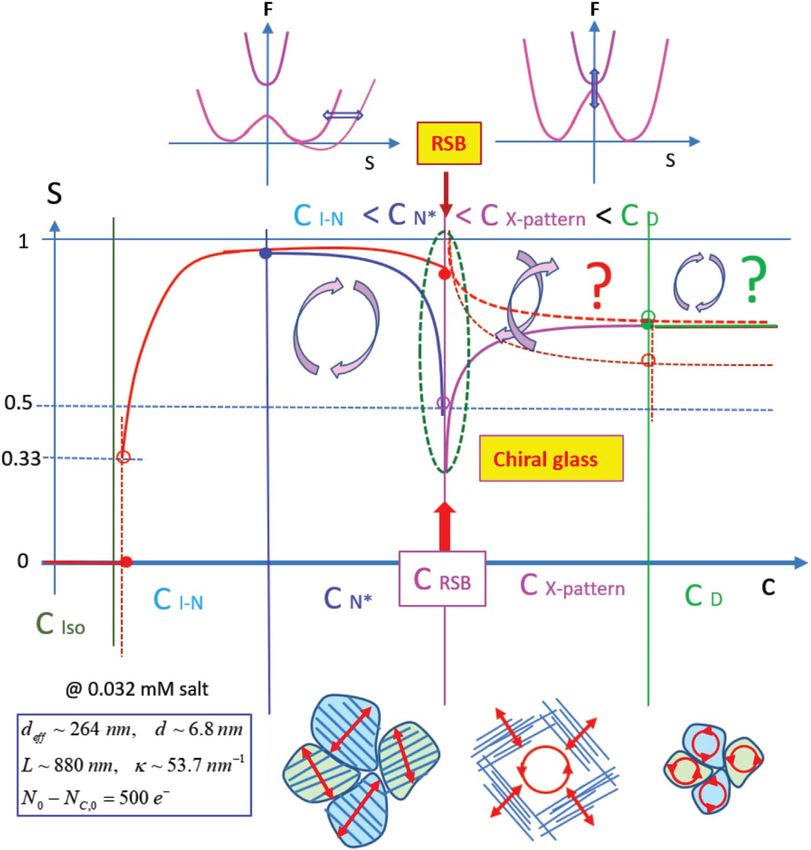
J. Phys. Commun. 5 (2021) 065001                                                                                                             K Kang

  Figure 3. Replica and RSB presented in the equilibrium phase diagram of charged chiral DNA rods:(a) Simple illustrations of self-
  similarity with cavity loops in bulk depolarized optical morphology of N* phase and helical domains in the phase diagram of DNA rod
  concentration and ionic strength. In the top left, local helicity axes are indicated as hi, and the cavity loop is Cj in the depolarized axes of
  analyzer A, and polarizer P. (b) Representative orientation textures of chiral mesopahses show a chiral-nematic, X-pattern, and chiral
  glass, with an increase in the concentration of DNA rods for a low ionic strength (0.032 mM). The red arrows indicate the local helicity
  and cavity loops formed in different microscopic length scales in the equilibrium orientation textures. See the supplementary data
  Movie 1 for the chiral glass.

dissociate/associate from/to the rods is affected by both the rod concentration and ionic strength. Experiments
on uncharged rods with a chiral structure of their core would be desirable to disentangle the effects of
concentration and ionic strength. A further concern of the relation between the aspect ratio and the helical twist
power of rods for chiral-mesopahses will be discussed separately.
    The local helical domains are shown with various depolarized morphologies of different defect lines of bulk
twisted disclination lines. In addition, for a fixed low ionic strength of 0.032 mM salt, and an increase of the DNA
rod concentration, a very slow RSB process occurs to form a cavity loop, which leads to an X-pattern between the
chiral-nematic N* phase and the helical domains Hd (in PATH I). Optical pitch variance is depicted in figure 5:

                                                           7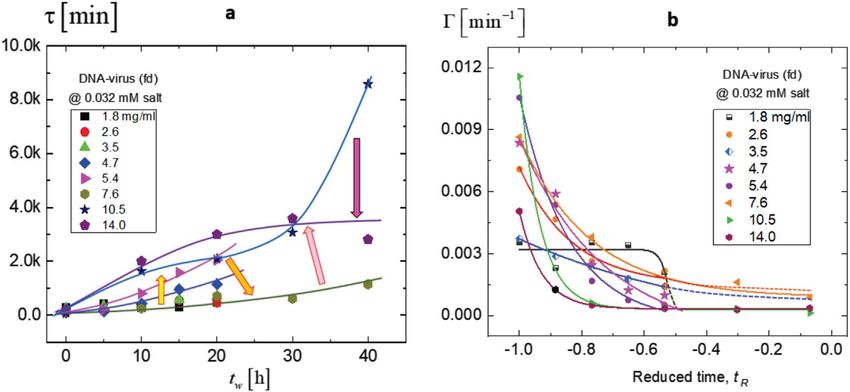
J. Phys. Commun. 5 (2021) 065001                                                                                                     K Kang

  Figure 4. Various orientation distributions in the Fourier pattern with corresponding depolarized morphologies of the helical
  domains, where the cavity loops and the helicity axes are present. The diameter of the cavity loop is varied. Helical domains are shown
  with the combined topological disclination lines. In particular, the bulk twist elastic deformation is seen with the asymmetric
  distributions in the Fourier space in the patterns of 1 and 6.

At a fixed low ionic strength, not only does the optical pitch decrease, but also the twisting of the neighboring
domains occurs with increasing DNA rod concentration. Figure 5(a) shows the entire field of view for measuring
the optical 2 pitch and one of the sites is illustrated in the raw intensity profiles of figure 5(b). Different regions of
many fingerprint orientation textures are selected for the field of view (see the yellow bars for optical pitches in
the pixels). The optical 2π pitch variances are provided in figure 5(c), with the different chiral mesophases
indicated above the IN coexistence as a chiral-nematic N*, X-pattern, and helical domain, respectively, with
increasing DNA rod concentration. The red line appears to be the ‘true’ pitch, taken as the largest value in
variances for a given DNA concentration. The average pitch is indicated in figure 5(c) as the blue line, which
intriguingly modulates in the N* phase and the X-pattern, but again coincides with the true pitch of the helical
domains at a higher concentration. A possible explanation for this is not only the finite characteristic length
scales of the helical twist power, but also the orientation textures occurring in the finite system with an internal
stress release allowed in many interacting ‘twisted’ boundaries as a function of DNA rod concentration. The
characteristic length of pitch variance is found to be a function of rod concentration:

                                                        8
J. Phys. Commun. 5 (2021) 065001 K Kang
Figure 5. Optical pitch variances: (a) The real view of pitch samplings and (b) an example of the pitch measurements (after 24 hours) at
a low ionic strength of 0.032 mM salt. (c) The optical 2πpitch variance as a function of DNA rod concentration. Time-lapsed images
are collected for different fd concentrations for a low ionic strength (0.032 m salt). The red line represents the true pitch of the largest
value; the blue for the average value of the measured pitch. A divergence of pitch is shown in the N*N phase transition at lower rod
concentration as well the saturation of pitch (60 μm) at higher DNA rod concentrations.
c˜
L p ~ L max ´ exp ⎧ ⎫, (1)
⎩ c - CN ⎬
⎨ ⎭
where L max ~ 515 mm is the largest length for a given concentration, and c̃ is the characteristic concentration.
The C N ~ 1.7 mg ml-1 is the upper nematic binodal concentration. The averaged pitch length is also
distinguished by the concentration as
c˜ ⎫
áL 0ñ ~ L 0 exp ⎧ i for C N < c < C 0,
⎩ c - CN ⎬
⎨ ⎭
c˜ ⎫
~ L 0 exp ⎧ - for c > C 0. (2)
⎩ c - CN ⎬
⎨ ⎭
where L0 ∼ 214 μm is the limiting value of the pitch length at the concentration of C N , and decreases to 60 μm
at the highest concentration. The spread of length decreases with an increase fo the DNA rod concentration.
Note that there is a visible modulation of the averaged pitch length ⟨L0⟩ below the critical concentration of C0,
while the above is shown with the coincident decay with the true pitch. As it can be seen in figure 5(c), a critical
DNA rod concentration is occurred at C N < C0 < CRSB , with the reduced pitch distributions from
110 − 200 μm at the critical concentration of C0 ∼ 4 − 7 mg ml−1. The characteristic decays of averages pitch
variances are different forms in the concentration, expressed qualitatively as the c˜ .
9J. Phys. Commun. 5 (2021) 065001 K Kang
Here, the c̃ measures the characteristic decay of the pitch variances in the concentration. The main features
of the pitch variances are found to be as follows: (i) There is a divergence of the pitch at a lower concentration
above the upper binodal concentration of the IN coexistence phase, CI−N, appearing on the chiral-nematic N*
phase, CN*. The broader distribution of pitch is also seen at such a concentration and at 100 − 500 μm, is most
pronounced at the lowest ionic strength of 0.032 mM salt. Similar pitch divergence behaviors are observed at
another low ionic strength (of 0.16 mM salt), but with a slightly shorter pitch. In addition, the pitch boundary is
frozen at a higher ionic strength (0.8 mM salt) at the LTKA23, facing the stable nematic state, close to the critical
ionic strength. (ii) A modulation of the average optical pitch is seen with a maximum value of 280 μm and a
minimum value of 110 μm for the chiral-nematic N* phase and X-pattern, respectively. This suggests that larger
accesses of rotational freedoms exist among charged DNA rods in the lower concentration of the N* phase and
the X-pattern, below the higher packing of the helical domains, Hd for such a low ionic strength. (iii) A saturated
value of the optical pitch is obtained at 60 μm for the helical domains with increasing DNA rod concentration, as
indicated by the red arrow bar in figure 5(c). This might be due to the increase of interactions for crowded DNA
rods as well as the enhanced twist elasticity with a critical rod density for a given Debye screening length.
Whether or not this twist elasticity can be described by the equation of motions relating to the cavity loop,
particularly below the critical ionic strength, is open to discussion.
3.3. Divergence of the exponent power in Relaxations via Image-time Correlation
As mentioned previously, the distinction between the chiral glass and the spin glass is characterized by the
decoupling scenario of chirality and spins, similar to weakly anisotropic Heisenberg-like spin glasses [18, 36] in
3D space. Of particular interest for a chiral glass is the divergence of correlation length that occurs slightly earlier
than that of spin glasses at the critical temperature, just below the freezing of a glass state. For the mixed chirality
state, the correlation length exponent of the disordered 3D Heisenberg model is found to be close to the value of
‘1’ [37]. There, the chirality appears to be a continuous transition with a circulating (electric) current that
generates the magnetic moment, which evidently is a different feature compared to the structural glass for the
initial freezing in time.
To quantify the relevance of RSB, the characteristic time and length scales of the change of orientation
textures of the chiral-nematic N* phase are measured by means of image-time correlations at the lowest ionic
strength (0.032 mM salt). Time-lapsed images (and movie data) are provided in figure 6 for different DNA rod
concentrations (2.6 mg ml−1, 4.7 mg ml−1, and 10.5 mg ml−1) and waiting times. Image-time correlation is
used as an experimental method for different waiting times as well as for obtaining the optical pitch variance in
figure 5, with corresponding depolarized optical morphologies in figure 6. Intriguingly, a notable difference
between the true and averaged pitch length for both the chiral-nematic N* phase and the X-pattern are seen up to
the helical domains at higher concentrations. In addition, the monotonic decrease of the pitch length at helical
domains is found to coincide with the true pitch. The undulation of the averaged pitch indicates that a finite
length scale for given charged rod concentrations is affected by the existing orientation degree of freedoms.
The image-time correlation function is defined as
á (I (t ) - áI (t )ñ)(I (0) - áI (0)ñ)ñ
CV (t ) = , (3)
á(I (0) - áI (0)ñ)2ñ
where the brackets ⟨ L ⟩ denote averaging over all CCD-camera pixels. Each single image in a time trace is used
to construct an image correlation function from the region of interest (300 × 300 pixels). Imaging of a broader
ROI view (18 mm) is performed using a special telescopic lens under the white light with two crossed polarizer
sheets. Details of the principles of image-time correlation spectroscopy can be found in [27].
From the recorded time-lapsed movie data, image-time correlations are used to obtain the decay times of
bulk orientation textures. The correlation functions for different waiting times are shown for 6 fd concentrations
at the lowest ionic strength of 0.032 mM salt. The characteristic length of optical pitches decreases at higher
concentrations for longer waiting times. The quantification of reaching the equilibrium time is performed by
obtaining the time when there is no further change to the decay rates of correlation functions (as indicated by
arrows in figure 6(b)). At the lowest ionic strength (0.032 mM salt), image-time correlations are obtained at
different fd concentrations for the orientation textures of the N* phase, where equilibration also occurs earlier
(about 30 hours in total) than at the ionic strength of 0.16 mM (86 hours). Slightly increased pitch lengths are
observed at a lower ionic strength of 0.032 mM as well as the broadening of the N* phase (see PATH I in the
phase diagram of figures 1 and 3). This is a result of the increased ion condensation, which leads to a longer
ranged electrostatic repulsion that effectively screens the chiral corecore interactions for the I-N coexistence
concentration, revealed by a weak AC electric field [38].
Both the decay time and the decay rate are obtained from the fits of image-time correlations. The fitting
function is chosen as the single-stretched exponential function,
10J. Phys. Commun. 5 (2021) 065001 K Kang
Figure 6. Results of image-time correlations: (a) Time-lapsed images and movie data (Movies 13) of a chiral-nematic N* phase being
formed at the fd concentrations (top: 2.6 mg ml−1) and the hierarchical chiral mesophases (middle: 4.7 mg ml−1, bottom:
10.5 mg ml−1) at the lowest ionic strength (0.032 mM salt). (b) Image-time correlation functions, CV(t), performed for the chosen
field of images for different fd-concentrations (2.6 mg ml−1, 4.7 mg ml−1, 5.4 mg ml−1, 7.6 mg ml−1, 10.5 mg ml−1, and
14.0 mg ml−1) with different waiting times. The supplementary movies are provided as Movies 2, 3 and 4. The arrow indicates the
increase in waiting time.
C fit (t ) = B + A exp {- (t t )b }, (4)
where B, A, β and τ are the fitting parameters for the background, amplitude, stretching exponent, and decay
time, respectively. The time constant τ is a measure of the decay time where the orientation texture changes and
the inverse of the decay time is the decay rate (Γ = 1/τ). Equilibration occurs with a typical waiting time of tens
of hours (shown in figure 7(a)) and the decay time, τ, increases with longer waiting time, tw. The inverse of decay
time is the decay rate, , which measures the change of orientations. To obtain further valuable information on
11J. Phys. Commun. 5 (2021) 065001 K Kang
Figure 7. The results of image-time correlations for orientation textures as a function of waiting time for different fd concentrations,
measuring (a) decay time τ and (b) decay rate Γ as a function of the reduced time of tR = (t − tL)/tL, where the tL represents the long
amount of time required to reach the metastable state (taken as 42 hours).
the slow relaxations, the reduced time is introduced as tR = (t − tL)/tL, where the long waiting time required to
reach the metastable state is obtained as tL ∼ 40 − 50 hours. An exponential decay rate is observed as a function
of tR, which is measured for different DNA rod concentrations, as shown in figure 7(b).
The characteristic decay rate and relaxation time are plotted as a function of DNA concentration in figure 8.
A simple illustration of the concentration-dependent chiral mesophases is shown in figure 8(a) as a chiral nemtic
N* phase, X-pattern, and helical domains, Hd, with increasing DNA rod concentration, as well as the cavity loops
Cj and the helcity hi depicting the chiral glass that appeared in the X-pattern concentration. The decay rate is
fitted as a function of the reduced time tR by
t
G = Gc exp ⎛ - R ⎞ + G0 ,
⎜ ⎟ (5)
⎝ tc ⎠
where Γc and τc represent the concentration-dependent characteristic decay rate and relaxations, and Γ0 depicts
the intrinsic decay rate. If we consider the dimensionless time for the relaxation with a reduced time for a given
concentration, then we observe the logarithmic slowing down in the decays as
G - G0 ⎤ t
ln ⎡ = - R. (6)
⎢
⎣ Gc ⎦ ⎥c C
RSB
tc
Note here that he decay rates are concentration-dependent, and the RSB occurs when the concentration is
reached as c → CRSB. Thus, if we fit the above independent observations in terms of CRSB, the characteristic
decays of the X-pattern decrease as a function of concentration,
ln {Gc } ~ - 0.725(c - CRSB ) ,
tc ~ exp {- 1.082 (c - CRSB )} + 0.111,
G0 ~ exp {+ 1.20 (c - CRSB )} + 0.000 48, (7)
where the above observations are a function of concentration. Γc is the amplitude of decay rate that contributed
very small energy dispersion (several tens of μ Hz) when entering the X-pattern (at CN*), which is noted by the
slope where γ = 0.725 and which slows down approaching the finite length correlations of helical domains, Hd.
The actual fitting of the above observations is performed in the concentration regime of C N < c < CRSB ,
bounded in the phase boundaries, before the helical domain Hd phase. Although a slight increase of the rate
occurs at a concentration of 8 mg ml−1, a significant decrease of the decay rate is seen upon increasing the
concentration to the upper-phase boundary in figure 8(b). A similar tendency is observed with the relaxations in
figure 8(c), with a sudden decrease in the exponential slope upon an increase of the rod concentration. The fit is
obtained with an amplitude of 25.6 and a background of 0.111. A steady residual decay rate of Γ0 is found with an
amplitude of 0.462 and a very low background of 0.0005 when varying the concentration.
When the DNA rod concentration reaches CN* < C0 ∼ 4 mg ml−1 < CRSB for the given low ionic strength
(0.032 mM salt) at the lower-phase boundary of the X-pattern, the as τc is observed with a slope of γ = 1.087.
Interestingly, for a residual decay rate of Γ0, a concentration gap is obtained between the N* phase and the
X-pattern, where the growth of the exponent slope is γ = 1.20, as shown in figure 8(d). Thus, the above exponent
12J. Phys. Commun. 5 (2021) 065001 K Kang
Figure 8. Replica symmetry breaking (RSB) of chiral glass: (a) Simple illustration of concentration-dependent chiral mesophases, a
chiral nemtic N* phase, X-pattern, and helical domain, Hd, with increasing DNA rod concentration. Cavity loops Cj and helicity hi are
indicated with the chiral glass that appears in the X-pattern concentration. (b) Characteristic decay rate and (c) relaxation time are
shown with (d) the background decay rate as a function of DNA rod concentration. Here, the X-pattern is denoted by the lower-phase
(pink line) and upper-phase (green line) boundaries (see the slope γ), which is seen slowing down approaching the finite length
correlations of helical domains, Hd. The characteristic concentration for phase boundaries of X-pattern are indicated as arrows with
CN* and CD, for lower-and upper-phase, respectively.
power γ carries qualitatively depending on the inverse of the charged DNA rod concentration for the limiting
value of the decay rate above a threshold DNA rod concentration when entering the X-pattern. This agrees with
the possibility of the dynamical scaling of chiral glass in terms of the overlap for the chirality, as the decay rate Γ
decreases. Here, the Γ also corresponds to a small energy dispersion (several tens of μ Hz), which is 10−5 lower
than the colloids and 10−8 smaller than the liquid crystalline phase. At higher concentrations, above a DNA rod
fd concentration of CRSB ∼ 7.4 − 8 mg ml−1, the exponent power saturates at a value of γ ∼ 1.082 with the
reduced time of tR. In contrast, no slope is found at lower concentrations, indicating that the probabilistic
realization of orientation textures is rather ergodic (as a replica), which is seen in the optical pitch variations for
both the N* phase and the X-pattern below the Hd. At this low ionic strength, the decay rate Γ is also far too slow
at higher DNA rod concentrations. This is not the case at higher ionic strengths (above 1-2 mM salt). Thus, the
system demonstrates the feasible realization of a chiral glass for charged DNA-virus rod suspensions by
effectively approaching the phase transition to the glass state for lower ionic strengths.
Typically, the orientational glass occurs before the structural glass appears, as seen in the binary mixture of
the anisotropic system. Similarly, in this system, the chiral glass occurs in the vicinity of a structural glass,
appears with a finite size of cavity loops, and is bounded within the stable planar nematic state. Furthermore, the
maximized rotating fields of the orientations for DNA rods can be coupled to the twist elasticity at higher
concentrations, exhibiting the tightly packed density of the replica of helical domains Hd (as illustrated in
figure 3). According to the replica method, the stress can be negligible, provided that the structure decay is small
compared to a loading shear modulus in the N* phase. However, when the RSB occurs, the local mechanical
stress releases exist as the ‘kinks’, which are briefly observed at the lower phase boundary of the X-pattern, from
the N* to X-pattern transition in PATH III. Furthermore, at the upper boundary of the X-pattern, the
undulation of the boundary lines is shown with the occasional appearance of small voids (i.e. air bubbles), which
indicates that the frustrated time (or the effective temperature) may exist for such slow processes (as a
13J. Phys. Commun. 5 (2021) 065001 K Kang
logarithmic in time). Therefore, the decay rate becomes a non-zero finite value in the infinitely long-time
metastable thermodynamic glass state. This might also explain why the optical pitch variances are modulating
for the average values for the N* phase and the X-pattern (figure 5(c)) below the Hd where the overlap volumes
are accessible in rotating fields to form the cavity loops.
The slowing down process (at a logarithmic in time) of charged DNA rods at low ionic strengths is caused by
the thick electric double layers that form a larger Debye screening. Furthermore, the stable chiral mesophases are
well maintained with the long-range electrostatic hydrodynamics and local ‘twist’ elasticity of charged DNA
rods. RSB also occurs and is demonstrated by the change of configurations from the N* phase to the X-pattern,
where the repelling forces are stronger for the given rod concentration (or the effective density). However, the
replica occurs at a higher packing density (or rod concentration) in Hd and the reduced length scale of the pitch
and domains is again shown without any indication of cavity loops, which includes the frustrated time (or
effective temperature) for the very slow process. Therefore, the decay rate of Hd becomes a non-zero finite value
in the infinitely long-time metastable thermodynamic state.
4. Summary and discussion
The RSBs are shown here by the dynamic pathways of PATHS I, II, and III in the equilibrated phase diagram for
interacting charged DNA virus fd rods crossing various chiral phase boundaries at varying low ionic strengths.
This is also driven by the salt-dependent microscopic dynamics of collective thermal fluctuations that are
coupled to orientations. The correlation length is shown with the concentration-dependent optical pitch of the
chiral-nematic N* phases, the X-pattern, and helical domains, and is measured by image-time correlations
[12, 39]. Variations of orientation distributions are also presented by real-space and Fourier transforms Chiral
pitch variances depend on the effective increase of released condensed ions, where the range of electrostatic
repulsion is large compared to the screening of chiral interactions.
The main results are summarized as follows: (i) In terms of RSB just below the structural glass, both helical
domains and the X-pattern are stable at high concentrations for low ionic strengths. The divergence of relaxation
time and the exponent power of correlation length are supported by the phenomenological observation of
relaxations for orientations via the image-time correlation. Extremely long-time kinetic arrests (LTKAs) are
observed for both structural glass (for 300 hours) and the chiral glass (30010,000 hours) with the decay rates
being quantified for long-time arrested orientation textures. (ii) The X-pattern, which relates to the dynamic
pathway of PATH II in the equilibrium phase diagram, reveals a cavity loop that is directly observed as a chiral
glass bounded within the planar nematic phase. The rotating fields of charged DNA fd rods are enhanced by the
cooperative twist effect at low ionic strengths. (iii) The optically stable pitch variances and the divergence of a
pitch and the exponent power are determined by varying the DNA fd rod concentration at the lowest ionic
strength, which is obtained by image-time correlation. The release of condensed ions for charged DNA viruses
(fd) was sufficiently large for the degree of accessible mobile ions, resulting in thicker electric double layers for
such lower ionic strengths. (iv) Moreover, the occurrence of chiral-glass originates from an intrinsic
orientational disorder-to order transition in chirality of lyotropic systems, contrary to the ‘structural’ glass
where the morphology slowly ages over a few hundred hours. It turned out that the chiral glass releases internal
stress at a critical concentration (around 4–8 mg ml−1), as shown in figures 5(c) and 8(d), which is followed by
‘freezing’ in a helical state at longer waiting times for higher concentrations of DNA rods.
Near the structural glass, both helical domains and the X-pattern are stable at high concentrations via
effective interactions. The relaxation times for the orientations are observed by the slowly varying rotating fields
of charged DNA rods, which are further enhanced by their ‘twist’ effect at higher DNA rod concentrations and
confirmed by the divergence in relaxation and pitch length. Here, one of the long-time kinetic arrests, LTKA2, is
the metastable mixed state of RSB, an X-pattern, which represents the chiral glass. The main feature of a chiral
glass appears to be the finite size of the cavity loops, bounded with the planar nematic state.
Several distinguishable equilibrium orientation textures exist in the equilibration time of 30010,000 hours
before any indication of frustrations (or freezing) occurring. For a larger time window, below the structural glass,
the high concentration merges with an X- pattern, revealing the decoupling of local helicity and the cavity loop.
It can therefore be concluded that the X-pattern (at low ionic strengths) is the most probable state of a long-
living metastable type of chiral glass. The splitting of cavity loops (Cj) and helicity axes (hi) are then obtained,
depending on the concentrations (or packing density) of charge chiral rods, and the configuration of a chiral
glass is seen in the X-pattern for the replica symmetry breaking.
In the canonical ensemble, the microscopic states are closed as the thermodynamic properties of
semiclassical gasses, driven by the number of particles for the given same internal energy of all microscopic
states, as well for the Debye model of solids for the phonon collective modes at low temperatures. Near the
critical point, density fluctuation becomes correlated over a large distances that can be mapped in a scaling law
14J. Phys. Commun. 5 (2021) 065001 K Kang
Figure 9. A simple illustration of the free energy versus order parameter as a function of the concentration-dependent phases:
isotropic, isotropicnematic coexistence (above), and the chiral mesopahses (below). The chiral neamtic N* phase is shown with a shift
of the minimal order parameter, the X-pattern with an increase in free energy, and the helical domain with an increase of the DNA rod
concentration. There might be an increase of Gibbs free energy for the helical domains, with the occurrence of voids and specific heats
at higher concentrations. Here, the concentration is indicated as CI−N, C N , CRSB, and CD for isotropicnematic coexistence, chiral-
nematic N*, RSB (in X-pattern), and the helical domains, respectively.
[40]. However, when the system is open as having varied number of particles and energy, the probability density
is varied with the thermodynamic variables as the temperature and chemical potential. In the latter case, there is
a discontinuity of the release in heat capacity at the critical temperature. Such experimental realizations are
shown in the superfluid [40]. The continuous phase transitions is well established by the GinzburgLandau theory
relating to the order parameter [40, 41]. Typical behaviors of free energy for the continuous phase transitions
from the isotropic to the nematic phase are illustrated for an increase in concentration at the top of figure 9.
First-order transitions occur irrespective of the breaking symmetry above the isotropicnematic coexistence
concentration, where the chiral-nematic N* phase occurs.
If the effective volume fractions of a given low ionic strength is taken as feff, the expectation value for the
order parameter S is suggested in figure 10. In order to describe the dynamics of melting and the forming of
nematic domains, an equation of motion should be derived for the orientational order parameter tensor S. This
tensor is defined as the ensemble average of the dyadic product of the unit vector û that specifies the orientation
of a rod, S (t ) º áuˆ uˆ ñ (t ).
As analogy of the superfluid, the gauge symmetry appears with a phase transformation, in such a way that all
phases of wave functions are varied in the phase lag at the critical point. The phase factor of a slowly varying
functional in concentration (likewise the pressure and temperature in the thermodynamic system) remains
negligible. Spontaneous broken symmetry occurs at the X-pattern, indicating the existence of a gapless phase
mode as a non-zero decay rate for the symmetry-restoring soft Goldstone mode [41] (illustrated in figure 9 at the
lower panels for non-zero decay rate). A conclusive review of the critical phenomena of quenched disorder is
15J. Phys. Commun. 5 (2021) 065001 K Kang
Figure 10. A schematic of the order parameter for hierarchical chiral mesophases, in which PATH I is applicable in the equilibrium
phase diagram in figures 1 and 3. Above: free energy versus an order parameter in the X-pattern, where RSB occurs below and above
the CRSB concentration. Below: illustrations of concentration-driven orientation texture as the chiral-nematic domains, cavity loop,
and helical domains (from left to right) for an increased concentration of charged DNA rods, corresponding phases in the
concentrations of CI−N ∼ 1.5 mg ml−1, CN* ∼ 1.8 mg ml−1, CRSB ∼ 7.4 − 8 mg ml−1, CD ∼ 10.5 mg ml−1 for the lowest ionic
strength (0.032 mM).
discussed in [42]. Here, in the current system, a finite discontinuity can be clearly seen across the critical
concentration in the bottom right of figure 9 (likewise for ferroelelctrics or antiferroelectrics [41]). A simple
illustration of the free energy versus an order parameter (see the figure 9) as a function of the concentration-
dependent phases: isotropic, isotropicnematic coexistence (above), and chiral mesophases (below). The chiral-
nematic N* phase is shown with a shift of the minimal order parameter, the X-pattern with an increase of the free
energy, and the helical domain with an increase of the DNA rod concentration as CI−N, C N , CRSB, and CD for
isotropicnematic coexistence, chiral-nematic N*, RSB (in X-pattern), and the helical domains, respectively. In
addition, the order parameter is provided as a function of DNA rod concentration for a given low ionic strength
(see PATH I) in figure 10. The order parameter increases from the concentration of CI−N < c < CRSB, but then
deceases sharply at the critical concentration of CRSB and saturates to CD. The above of figure 10 shows the
possible free energy versus an order parameter in the X-pattern, where RSB occurs below and above the CRSB
concentration.
The RSB is then caused by different interactions meeting at CRSB CRSB: (I) At CN* < c < CRSB, the
pronounced optical pitch lengths < L0 are modulating in the concentration, while the order parameter S is
maximized below the occurrence of RSB (see dashed green line in figure 10) and the chiral-nematic N* phase
remains stable. (II) However, above CRSB, the pitch length decreases monotonically while there is also a sharp
decrease of the order parameter, leading to the formation of cavity loops in the X-pattern. Here, the cavity loop is
created by the substantial amount of dissociated ions existing around DNA rods that drive to repel each other
with collective rotational dynamics by increasing density (and concentration) in the long-range
electrohydrodynamics. When density is increased, the reduced amplitude fluctuations are also less for a given
16You can also read


