Phase defect lines during cardiac arrhythmias: from theory to experiment
←
→
Page content transcription
If your browser does not render page correctly, please read the page content below
Phase defect lines during cardiac arrhythmias:
                                                                 from theory to experiment
                                                              1,*               2,*                     1                             1
                                               Louise Arno , Jan Quan , Nhan Nguyen , Maarten Vanmarcke , Elena G.
arXiv:2101.00315v1 [nlin.AO] 1 Jan 2021

                                                                            2                  1
                                                                  Tolkacheva , and Hans Dierckx
                                           1
                                               Department of Mathematics, KULeuven Campus KULAK, E. Sabbelaan 53, 8500 Kortrijk, Belgium
                                                   2
                                                     Biomedical Engineering Department, University of Minnesota, Minneapolis, MN, 55455
                                                                       *
                                                                         L.A. and J. Q. contributed equally to this work

                                                                                            Abstract
                                                     During heart rhythm disorders, complex spatio-temporal patterns of electrical activation
                                                 can self-organize in vortices. Previously, it was assumed that at the center of such vortex, there
                                                 is a point singularity in the activation phase. We hypothesize that there is another possibility,
                                                 namely a region of discontinuous phase that can exist during cardiac arrhythmias instead of a
                                                 point singularity. In this paper, we provide some theoretical insights into the existence of such
                                                 phase defect lines (PDL) and validate their presence in ventricular tachycardia in the whole
                                                 ex-vivo heart using optical mapping experiments. We discuss the implications of phase defect
                                                 lines and surfaces for the theory of arrhythmias, cardiac modeling and practical cardiology.

                                          Significance statement
                                          During cardiac arrhythmias, electromechanical vortices have been observed. Previously, the cores
                                          of such rotors were considered as point-like phase singularities; these are actively targeted in ar-
                                          rhythmia therapy such as catheter ablation. Our novel analysis of experimental data of ventricular
                                          tachycardia, however, shows that at the vortex core, wave block rather than a phase singularity
                                          occurs, such that the fundamental entity is a phase defect line (PDL). The location of experimen-
                                          tally reconstructed phase defect lines coincides with the location where multiple short-lived phase
                                          singularities were found. This observation could help to understand why stable rotors are seen in
                                          simulations, while clinical experiments usually reveal multiple short-lived rotors. Both theoretical
                                          consequences and clinical implications of the PDL concept should be investigated.

                                          Introduction
                                          About once per second, a wave of electrical depolarization is generated in our natural pacemaker,
                                          which then travels through our heart, coordinating its mechanical contraction. As such, the heart
                                          is a prime example of electrical activity with self-organisation across different scales. The flow of
                                          ions through the cell membrane of cardiac myocytes invokes various spatiotemporal patterns of
                                          electrical activity at the organ or tissue level, which correspond to either a normal or abnormal
                                          heart rhythm. If this abnormal rhythm occurs in the lower cardiac chambers (ventricles), which
                                          pump blood to the body and lungs, the normal pumping is disturbed, leading to life-threatening
                                          ventricular arrhythmias. If the abnormal electrical pattern, however, is situated in the upper
                                          cardiac chambers (atria), which pump blood into the ventricles, the arrhythmia is usually not
                                          directly lethal. However, atrial arrhythmias often evolve to a chronic disease, severely increasing
                                          the risk for blood clot formation and stroke [1].

                                                                                                 1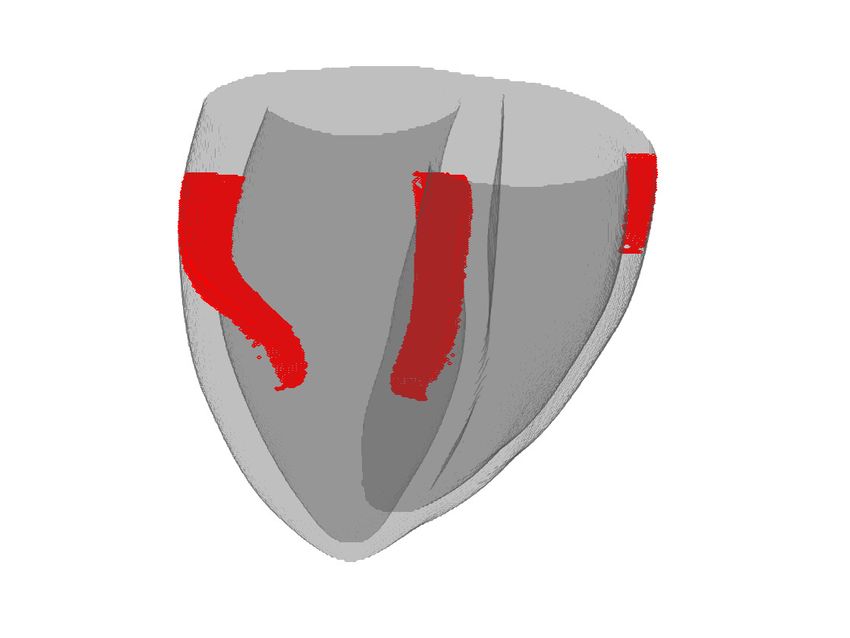
It has been previously demonstrated, using cardiac surface electrodes, that electrical activity
during cardiac arrhythmias may travel around the heart in a closed circuit within the cardiac wall,
and thus re-excite the heart [2]. Later, such rotating vortices of electrical depolarization have
experimentally been observed in animal hearts during ventricular arrhythmias [3]. Depending on
the community, these vortices are also known as rotors, or as spiral waves in two-dimensional
(2D) space and as scroll waves in three-dimensional (3D) media. More recently, rotors have been
mapped on the cardiac surface using high-density electrode arrays [4] and in 3D myocardium
using ultrasound [5]. Since the rotation frequency of the rotors is generally higher than the
heart’s natural rhythm, they take control of the heart’s excitation sequence and induce arrhythmia.
Therefore, several therapies aim at localizing rotors in the heart and ablate the core of these rotors
to terminate the arrhythmia [6, 7]. This core of the rotor is traditionally found by applying a phase
analysis and treating this the rotation center as a singularity point [8].
    However, rotors have been only observed indirectly in patients. For this reason, computa-
tional modeling of the heart has been developed [9, 10, 11, 12], in which biophysically detailed
or phenomenological equations are derived from observations at the level of the cell membrane.
Next, homogenization theory was applied to find effective continuum models that sustain wave
propagation as is observed in the heart [13]. The numerical simulations can provide valuable
information on the spatiotemporal dynamics of rotors as they allow to control different factors
independently, including anisotropy, wall shape and thickness, heterogeneity and physiological pa-
rameters. Also, (semi-)analytical approaches can provide a description of the formation of rotors
and their dynamics [14, 15, 16, 17].
    It was furthermore found that the analysis of complex 3D patterns can be significantly simpli-
fied by only considering the dynamically moving rotation axis of each rotor, called the filament [8].
The dynamics of such filaments in the 3D heart could then be related to a perturbation problem
of 2D spiral waves in the same medium [18, 19]. Numerical evidence suggests that these rotors
are mostly sensitive to stimuli applied near their core [20, 19, 21, 22], allowing to consider rotors
as localized objects or quasi-particles that drive the arrhythmia [7].
    In this paper, we reconstruct the activation phase of rotors using both numerical and experi-
mental data, and demonstrate the absence of a singularity point, which was traditionally associated
with rotors [8]. Instead we demonstrate a line of conduction block at the center of these vortices,
along which the excitation phase is changing abruptly. We call these structures ‘phase defect lines’
(PDL) in 2D and ‘phase defect surfaces’ (PDS) in 3D. This manuscript is organized as follows.
We will first set up a mathematical framework for these phase defects and describe methods to
identify them in data. Thereafter, we demonstrate the presence of PDLs in numerical simula-
tions and optical mapping experiments. Finally, we discuss implications of of our findings for
arrhythmogeneity at the conceptual and applied levels.

Theoretical observations
Let us assume that the physiological state of cells in every point of the medium can be represented
by a state vector u(t) = [u1 (t) ... uN (t)] of N state variables, where t is time and u1 is usually
                                            T

the transmembrane potential (and denoted as V )[9, 23, 12]. Remarkably, in many oscillatory and
excitable media, the local dynamics of the system implies that over time, only a small part of all
possible states u(t) are visited. A plot of these states typically reveals a closed loop in state space,
see Fig. 1b. In electrophysiology of the heart, this closed loop in state space corresponds to an
action potential.
    The term ‘phase’, as used in phase singularity or phase defect, here refers to different parts of
the action potential: a cardiac cell can be in the resting state, upstroke, plateau or repolarization
phase and transitions between them. There are different ways to translate such definition in
mathematics, and Fig. 1 shows two of these ways, in its top and bottom row, respectively. We
will demonstrate below that in either case, a phase defect region can be found; the first phase
(φact ) is the classical one, while the second phases (φarr ) shows a direct relation between PDLs
and conduction block lines.

                                                   2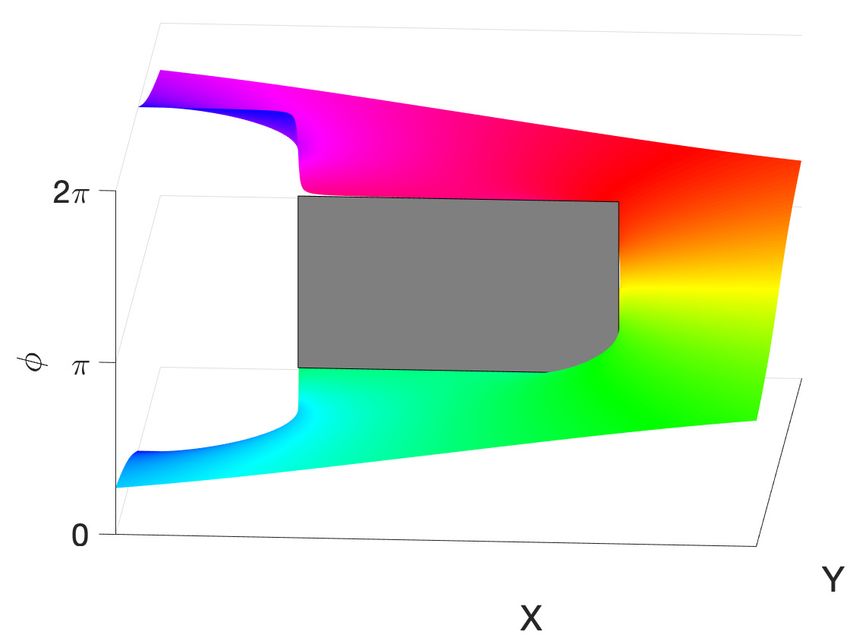
DATA               STATES               PHASE           SPATIAL PHASE        PHASE DEFECTS
     a)                  b)                 c)                 d)                   e)
                                                                                         PDL

                                                                                               PDL

Figure 1: From numerical or experimental data to phase defect lines, demonstrated for state space
phase φact (Eq. 1) on the top row, and the arrival time phase φarr (Eq. 3) on the bottom row. (a)
Starting point is a numerical simulation of a rotor in 2D in the Fenton-Karma (FK) MLR-I model
[11]. (b) The state of a cell can be represented either in the plane of excitation-recovery variables
(top) or using the elapsed time since last activation (bottom). We use for V the normalized
transmembrane potential (u in the FK model) and R = 1 − v with v the second variable in the
FK model. (c) Using either Eq. 1 or 3, a phase can be defined. (d) When coloring the original
pattern according to phase, a phase defect line (PDL) can be observed (e).

    The first, classical, definition of phase starts from plotting two suitable different observables of
the system in a plane, say V (t) and R(t). In cardiac context, V (t) is usually the transmembrane
potential (or proxy thereof), and R(t) can either be a recovery variable, or transformation of the
V (t) time-series in a point (e.g. the delayed signal V (t − τ ) or its Hilbert transform H(V (t))) [24].
Without loss of generality, we can assume that the activation loop is followed counterclockwise (if
not, one can replace R(t) by −R(t)). One then shifts the origin to a value (V ∗, R∗) within the
typical activation loop and defines activation phase as the polar angle in this system:

                                 φact = atan2(R − R∗, V − V ∗) + C.                                      (1)

Here, atan2(y, x) is the 2-argument inverse tangent function, such that the result points to the
correct quadrant in the XY-plane. In simulations, we choose the constant C such that φact = 0 at
the resting state; this allows us to measure the polar angle relative to the location of the resting
state in state space; see Fig. 1c. During analysis of experimental data, we assume that V(t) is
V (t) the optical intensity and R(t) its Hilbert transform [24]. From the state space plots in Fig.
1, it is seen that values of φact that differ by an integer multiple of 2π from each other represent
the same state. Therefore, throughout this paper, we take φact in [0, 2π).
    When a propagating wave travels through a point of the medium, its phase is changing
monotonously from 0 to 2π. This state, however, is again the unexcited state since phase dif-
ferences of 2π only imply that another action potential or activation loop has been completed.
For this reason, we consistently use a cyclic colormap in this publication, where blue denotes both
φact = 0 and φact = 2π. If a spiral wave is colored according to φact , one notes that if its center is
circumscribed clockwise once at large radius, the total phase difference along that path expressed
in multiples of 2π will be the topological charge of the spiral wave:

                                  dφ    −1       (clockwise rotation),
                          Q=∮        ={                                                                  (2)
                                  2π    +1       (counterclockwise rotation).

Eq. (2) is used in practice as a rotor detection algorithm [8, 25]. Another algorithm for rotor
localization, the isosurface method, [11] looks for the intersections of the curves V = V ∗, R = R∗
which also reveal the phase singularities.

                                                    3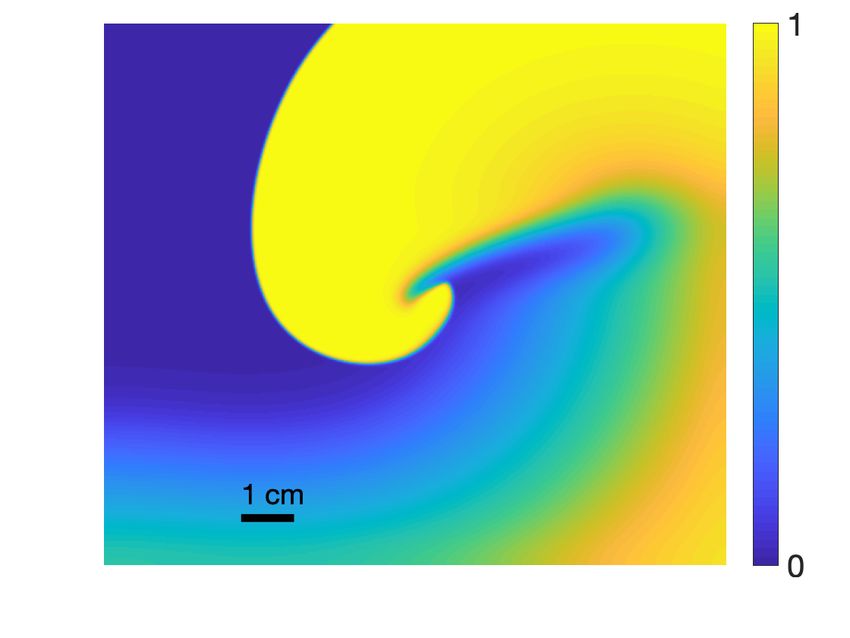
We here introduce a new, second definition of the phase as follows: for every point in the
medium, the local activation time (LAT) of the wave is the most recent time when the state
changed from V < V ∗ to V > V ∗. With telapsed the elapsed time difference with most recent
LAT, we define the new phase as

                                φarr (telapsed ) = 2π tanh(3telapsed /τ ),                        (3)

where τ is the typical action potential duration in the medium, and the factor 3 makes that
at φarr (τ ) ≈ 2π. The difference between φact and φarr is mainly a reparameterization, φact =
f (φarr ). Note that the use of φarr avoids the rapid change in phase during the depolarization and
repolarization that is typical for φact , as can be seen from Fig. 1 by comparing top and bottom
images in panels d-e.
    When the state variables are initialized around a given point in space, such that the phase
increases (spatially) from 0 to 2π, a rotating spiral pattern will develop from this state as in Figs.
1a and 2a,c. Each point far away from the central point will execute its excitation cycle, but at the
center the phase is necessarily undefined since the periodic interval [0, 2π) cannot be continuously
mapped onto a single value. Three different possibilities exist at the center of rotation.
    A first possibility is a phase singularity, i.e. a point where all different phases converge, as
usually observed in many circular-core spiral waves, and traditionally also assumed to occur with
line-core spiral waves. A second option is that phase becomes spatially disorganized in a so-called
chimera state [26]. Surprisingly, a third state, simpler than a chimera, is also possible in 2D space:
the phase singularity extends along a curve (in 2 spatial dimensions), thus forming a PDL, as
shown in Fig. 1c.
    Our explanation of PDL existence is based on biological rather than mathematical arguments.
Consider the activation cycle of an excitable cell, i.e. its action potential, as shown in Fig. 1b.
Now, if one expects a phase singularity in the center of a vortex, one assumes that the cells can
also be in a state that lies somewhere in the middle of the cycle in state space. However, this
situation may be biologically impossible: a chain of biochemical reactions will push the cell along
its activation cycle, not necessarily allowing it to occupy the middle state.
    Hence, we hypothesize that of the many PSs that have been identified in cardiac measurements,
a significant fraction could be unrecognized PDLs. Numerical simulations have shown that, if the
action potential duration is increased, a wave break evolves to a so-called linear core, where the
spiral wave tip travels along the edge of the region with previously excited tissue. This edge is
precisely the PDL, and the fact that PDLs occur in regions of conduction block should be clear
from their definition in terms of discontinous φarr .
    In the systems with long action potentials and linear spiral cores, we argue that the PDL is
a more fundamental entity than the PS, for the following reasons in addition to the biological
argument above. First, if we represent the data V (t), R(t) as a continuous field, and apply a PS
detection algorithm, then by the assumed continuity the algorithm using isolines [11] will indeed
detect a point satisfying V = V ∗, R = R∗ and attribute a PS to it. So, even if there is a PDL,
a PS may be detected. However, if one changes the thresholds V ∗, R∗, the PS will shift along
the PDL, such that the PS bears no true physical meaning, except from being located on a PDL.
Second, the outcome of the circle integral method (Eq. (2)), depends on the implementation of
the method and spatiotemporal resolution of the data [25]. For, if the contour intersects the PDL,
the assigned topological charge will depend on how that jump in phase is accounted for. Below, we
demonstrate that this method generates multiple PSs coinciding with the PDL. Third, the PDL
is more robust, since one can also find it from pure LAT measurements as demonstrated in Fig. 1.
    The situation in Fig. 1 is reminiscent of a branch in mathematics called complex analysis, see
                                                                                              2
Fig. 2. Herein, the field of real numbers is extended by the imaginary unit i such that i = −1.
Then, numbers are introduced of the form z = x+iy, with x, y real; then, z is a complex number. As
a consequence, the real axis is extended to a complex plane, in which the polar angle associated
with z is called (not coincidentally) the complex phase of z and denoted arg(z). (In fact, the
Hilbert method of [24] makes use of this property.) Next, one can consider functions of a complex
variable: w = f (z) with both w and z complex numbers. To make a visual representation of the

                                                    4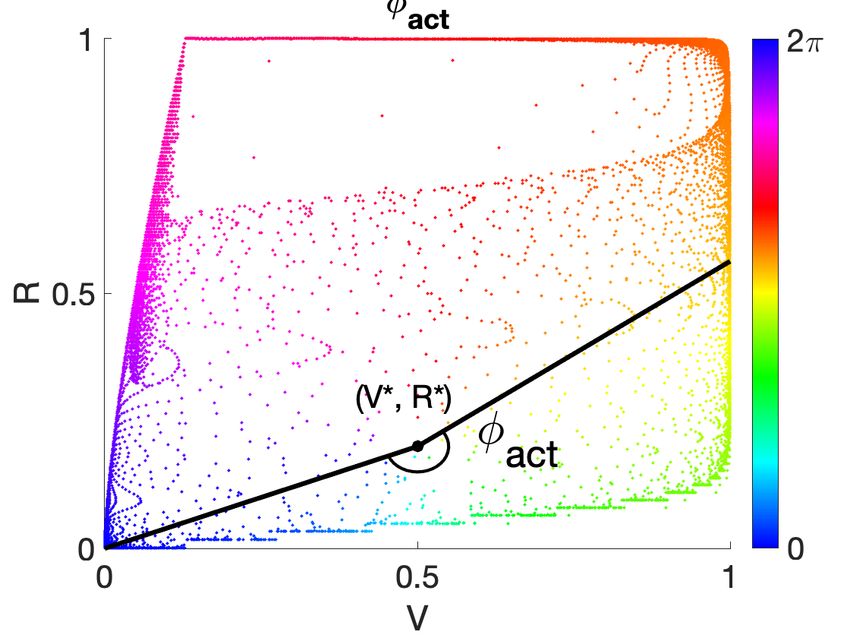
Phase singularities                          Phase defect lines / branch√cuts
 AP model (rigidly rotating)             arg z          FK model (linear core)      arg( z 2 − 1)

                             0                                            2

Figure 2: Phase singularities versus phase defect lines in cardiac models and complex anal-
ysis. Phases are rendered in-plane (top row) and in 3D, as a Riemannian surface (bottom
row). (a) Rigidly rotating spirals, as in the Aliev-Panfilov (AP) reaction-diffusion model [10]
correspond to a phase singularity, similar to φ(x, y) = arg(z). (b) Linear-core cardiac models,
such as Fenton-Karma
              √          (FK) MLR-I kinetics [11] exhibit a phase defect line or branch cut, like
φ(x, y) = arg( z 2 − 1). Grey areas denote a jump in the phase over a quantity not equal to an
integer multiple of 2π, i.e. a phase defect line (physics) or branch cut (mathematics).

function value, one can draw colormaps of the phase arg(w). In case of polynomial or rational
functions, such phase map will reveal point singularities (see Fig. 2a), similarly to circular-core
spiral waves. When the phase of the simple function w = f (z) = z is shown as a graph of (x, y),
the phase surface resembles a helicoid. If one walks around the PS once in the XY-plane, the
phase will change by 2π, but since phase is measured disregarding terms of 2π, one ends in the
same state. This effect is more easily seen using a cyclic colormap in 2D than on the Riemannian
surface, where phase is represented as height above the XY-plane, see Fig. 2b.
    In contrast to polynomial and rational functions, functions f which include roots exhibit a
discontinuity in their complex
                           √     phase, also called ‘branch cut’ in mathematics. In particular, for
the function w = f (z) = z 2 − 1, there is a line of discontinuous phase for (x, y) between (−1, 0)
and (1, 0). This line is easily noticed in the representation as a color map as a sudden transition
in color, even in a cyclic colormap (see Fig. 2). This situation is in our opinion very similar to the
phase discontinuity in the rotor simulation of Fig. 1.
    To localize a PDL, it is natural to look for large phase differences between nearby pairs of
points. Here, one should take into account that phase differences of 2π should be neglected, such
that we take along an edge between adjacent measurement points (in experiment or simulation):
                                  ∆φ = mod(φ1 − φ2 + π, 2π) − π.                                  (4)
This way, if the wave pattern is sampled with a fine resolution, most differences between adjacent
grid points will be small, while large differences are rounded towards [−π, π]. One can then
threshold on ∆φ between adjacent pixels in the image and connect the regions where the phase
jumps to locate phase defects.
    We now continue with demonstrating PDLs in numerical simulations and optical mapping
experiments.

Numerical results
A first result in a reaction-diffusion system with Fenton-Karma MLR-I kinetics (3 variables) [11]
was given in Fig. 1. Both φarr and φact show a phase defect line.

                                                  5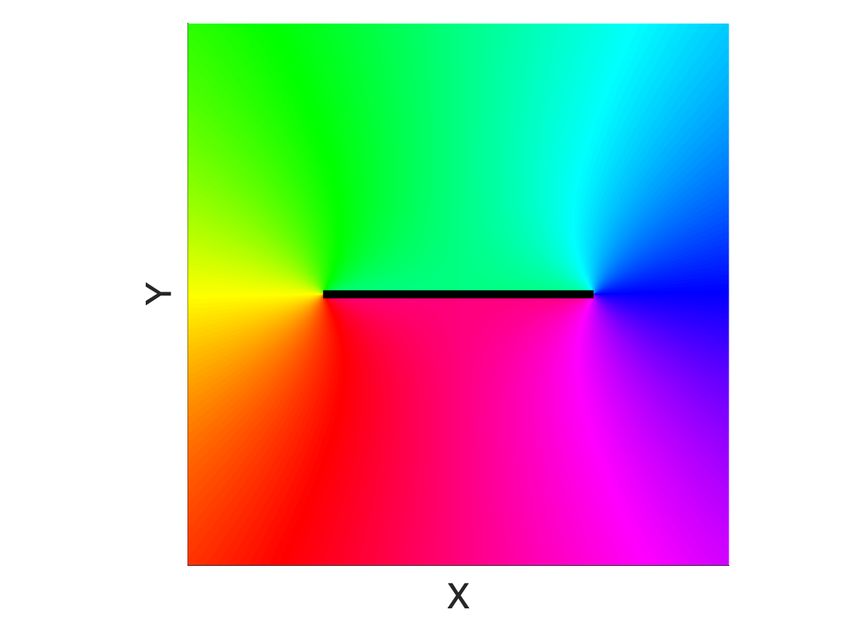
Second, we remark that PDLs can also exist in media that sustain spiral waves with PSs. This
is illustrated in simulations where application of S1S2 pacing induce a PDL at the wave back of
the first stimulus, see Fig. 3a. Since Aliev-Panfilov reaction kinetics were used [10], the PDL will
disappear after both sides have reached full recovery, resulting in a PS at the core of the spiral
wave, see Fig. 3b. Hence, we conclude that PDLs and PS can coexist in the same system.
We further note that phase discontinuities not only occur at the core of vortices, but whenever
conduction block happens, i.e. when a wave front hits a portion of non-recovered tissue. Fig. 3a
shows a wave impeding on a non-recovered portion of tissue, leading to the temporary formation
of a PDL, which vanishes after repolarization. Hence PDLs can have Q ∈ {−1, 0, 1}, and perhaps
also other integers.
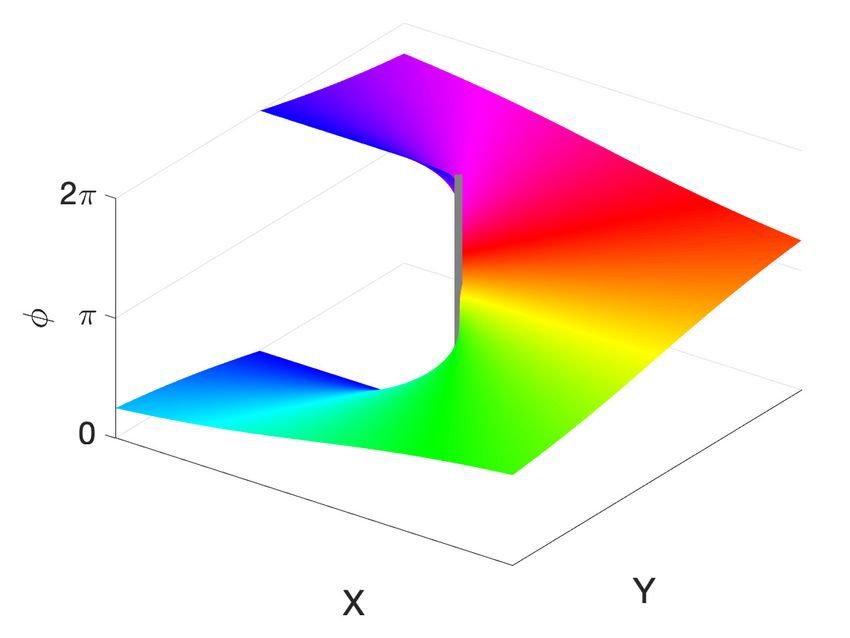
It is well-known that the concept of PS can be extended to dynamical filament curves when the
thickness of the medium is also considered. Since PDLs have one dimension less than the ambient
space, one expects in 3D to observe a phase discontinuity surface (PDS), and this is confirmed by
numerical simulation in a ventricular geometry in Fig. 3c.
a) b) c)
Figure 3: Relation of phase defect lines to other phase structures in simulations. (a) A propagating
wave to the right (S1) was followed by stimulation of the top-left quarter of the medium (S2) in
the Aliev-Panfilov model [10], showing a PDL separating the newly excited S2 zone from the wave
back of the S1 stimulus. This system later evolves to a PS, see Fig. 2 top left, showing that PDL
and PS can occur in the same medium. (b) S1 stimulation followed by a rectangular S2 stimulation
in the Bueno-Orovio-Fenton-Cherry (BOFC) model [27] for human ventricular tissue. A PDL is
formed without a rotor attached to it; its topological charge from Eq. 2 is zero. The wave fronts
on the left will approach each other along the right-hand side of the PDL and fuse without spiral
formation. (c) 3D simulation in the BOFC model in a biventricular human geometry, showing
3 phase defect surfaces (red) in the left and right-ventricular free walls and the interventricular
septum. Colors of a & b as in Fig. 2.
Experimental results
Electrical activity of the Langendorff-perfused rat heart was visualized during ventricular tachy-
cardia via optical mapping experiments [28]. In the image sequence of 80 × 80 pixels, the optical
intensity I(t), which varies linearly with the transmembrane potential, was normalized between 0
and 1, and after smoothing, the phase was computed using the Hilbert transform [24]. In addition
to the PDL detection method (see Eq. (4)), we conducted traditional PS detection using the
method of intersecting isolines [11] and by computing circle integrals of the phase using a 2 × 2
ring plus a 4 × 4 ring of points [25]. The results of this analysis are shown in Fig. 4 and Table
1. It can be seen that in regions where multiple PSs were found along a line, also a PDL was
identified, and nearly all PSs from the integral method collocated with a PDL. Fig. 4 shows that
the location of the PDL is less variable in time than PS location, which is confirmed by adding
time as a third dimension, see Fig. 5a. Moreover, the spiral wave is seen to revolve around the
PDL in time. Fig. 5b shows that in every recorded frame the number of PS correlates with the
total length of PDLs in that frame (data from 1 experiment is shown).
6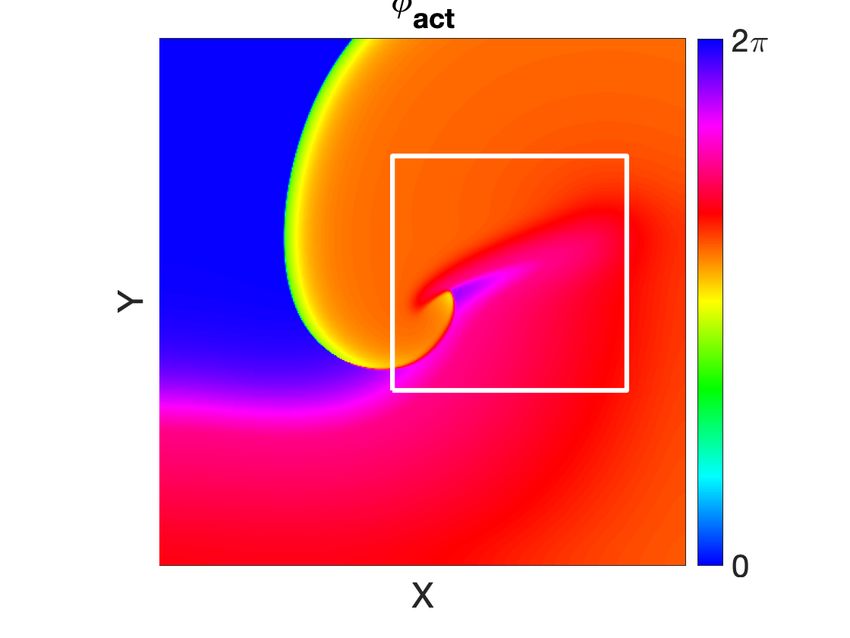
t= 365 ms            t= 372 ms           t= 382 ms            t= 390 ms           t= 399 ms

Figure 4: Experimental verification of the existence of phase defect lines in an optical mapping
experiment performed on a rat heart in ventricular tachycardia. Left to right shows progression
in time with wave fronts (white lines), phase defect lines (black lines) and point singularities of
the phase (red) detected by the isoline method (⧫). PS detected by the circle integral method
are drawn as ▲ for counterclockwise rotation (Q = 1) and as ▼ for clockwise rotation (Q = −1).
Background coloring is either normalized optical potential (top row) or computed phase (bottom
row), with color encoding as in Fig. 1. Note that the detected phase singularities are either situated
on the PDLs, occur in pairs, or near the boundary of the field of view. Over time, the PDLs are
less variable than the detected phase singularities. Similar reconstructions are found for n=6 rat
hearts. Full movies showing epicardial views from the front and back of the mapped hearts are
available in the SI.

Discussion
We have started this study with defining a new concept to describe meandering spiral waves, and
hypothesized that a phase defect line is present in the core rather than a point singularity, as is
traditionally assumed. From the experimental observations in Fig. 4-5 and Table 1, we note that
the phase singularities from the integral method [24, 25] nearly always lie near a phase defect line.
Our results are in line with recent experiments where PS were seen to co-localize with conduction
block lines [29] in patients with atrial fibrillation, but these authors did introduce the concept of a
PDL. Our results further show that PDLs had an average lifespan about four times longer than PS
(Tab. 1), and the wave front was seen to revolve around them in Fig. 5a. Note that for both PDL
and PS, the lifespan is still shorter than the inverse of dominant frequency (dominant period),
which may be due to incomplete filtering of short-living structures persisting for 1-5 ms. From
the spatial collocation and longer persistence in time, we conclude that PDLs are fundamental
entities that occur during ventricular tachycardia in the observed rat hearts. Given the ongoing
discussion on the difficulty to observe rotors in mapping experiments or in patients, we suggest to
also look for PDLs instead of PSs there.
    One question is whether the phase is truly discontinuous across the PDL, as in the mathematical
branch cuts in Fig. 2. From our experiments this cannot be answered, since spatial resolution is
limited. In simulations, Fig. 1, φact seems to suggest a continuous transition, while φarr shows
a clear discontinuity, inherited from the discontinuity in LAT. Here, we keep in mind that the
reaction-diffusion paradigm emerges from a continuity approximation, and that the question of
discontinuity should essentially be answered by physiological observation, e.g. detailed optical
mapping with a conduction block in the field of view. We expect that, as with other interfaces
between phases in nature, a boundary layer will form with a thickness related to fundamental
constants of the problem. For this reason, we name the conduction block region ‘phase defects’

                                                  7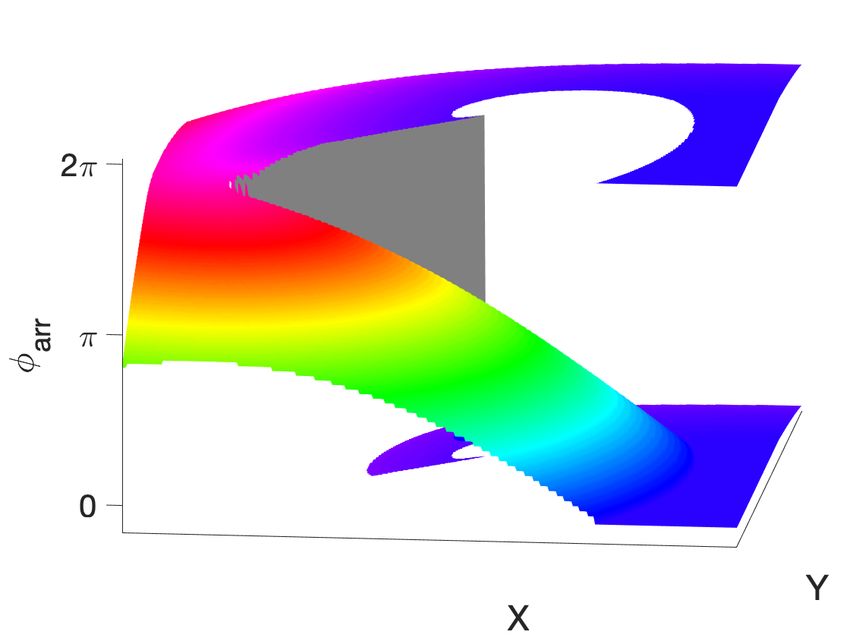
exp     # PS   # PS on PDL                # PS   away from PDL                                       dominant     dominant        mean PS    mean PDL
 ID                                 at border      in a pair   alone                                  frequency      period        lifespan    lifespan
  1      7196   7177   (99.7   %)   19 (0.3 %)     0 (0.0 %) 0 (0.0 %)                                 19.6 Hz      50.9 ms         3.5 ms     14.9 ms
  2      8114   8102   (99.9   %)   12 (0.1 %)     0 (0.0 %) 0 (0.0 %)                                 20.1 Hz      49.8 ms         3.7 ms     13.8 ms
  3      8094   8078   (99.8   %)   15 (0.2 %)     1 (0.0 %) 0 (0.0 %)                                 16.4 Hz      61.0 ms         3.3 ms     14.7 ms
  4      6815   6810   (99.9   %)    5 (0.1 %)     0 (0.0 %) 0 (0.0 %)                                 17.6 Hz      56.7 ms         3.1 ms     14.2 ms
  5      5478   5470   (99.9   %)    8 (0.1 %)     0 (0.0 %) 0 (0.0 %)                                 17.5 Hz      57.1 ms         2.9 ms     12.9 ms
  6      9921   9901   (99.8   %)   20 (0.2 %)     0 (0.0 %) 0 (0.0 %)                                 19.9 Hz      50.2 ms         3.2 ms     12.4 ms

Table 1: PS and PDL properties in 6 optical mapping experiments, for PS computed using the
integral method. Phase was computed for both PSs and PDLs with V (t) the normalized optical
intensity and R(t) its Hilbert transform.

    a)                                                             b)

                                                                        # points in PDL, per frame
                                                                                                     500

                                                                                                     250
         t

                                                      Wave Front
                                                      PS
                                                      PDL                                             0
                                                                                                           0   5     10       15      20      25
                       y                             x                                                               # PS, per frame

Figure 5: Post-processing of experimental data. (a) Position of the wave front, phase defect
line and phase singularities, where time has been added as the vertical dimension. (b) Positive
correlation between number of detected PS and number of points in the PDL for the experiment
shown in Fig. 4.

rather than ‘phase discontinuities’.
    There exist several open questions, to which the concept of a PDL may offer a partial answer.
A first issue, which inspired this work, is how a meandering spiral can be described in terms of a
PS. This is now clear: there is a line defect of phase, rather than a singularity point, and this PDL
is located near the classical tip trajectory, i.e. the path followed by the apparent phase singularity
located at V = V ∗, R = R∗. For so-called linear cores, a PDL occurs, and we conclude that the
different tip trajectories are located in the aforementioned boundary layer around the PDL. Thus,
the question on how a rotor’s core is structured seems to be answered by the concept of PDLs:
there is not a single cell in its middle with undefined phase. Rather, there is an elongated region
of cells which are in a boundary layer of ill-defined phase at the center of a rotor.
    The recognition that there is a PDL at the center of linear-core rotors is likely to start a new
chapter in the mathematical description of cardiac arrhythmias. From a mathematical physics per-
spective, it seems that the string-like dynamics [17] need to be generalized to brane-like dynamics
(Fig. 3d), since already for a 2D medium, a worldsheet is traced out over time by the phase defect
(Fig. 5a). Many previous results on rigidly rotating spirals [14, 16, 17] including the concepts of
filament tension [15] and response functions [19] will need to be revisited and generalized. One
outstanding question is why PDL in numerical simulations usually precess, while this phenomenon
is not observed in our experiments. Further investigations could target to quantify PDL and PDS
growth and rotation in experiment, and crank the computational models to behave in the same
manner. This research question has implications for pharmaceutical therapy too, since one way in
which drugs have pro- or anti-arrhythmic effects could be via the modification of PDL properties.
    At the fundamental level, the concept of PDLs gives a new handle on how to interpret cardiac
patterns during complex arrhythmias. These should be reviewed in terms of wave fronts, wave
backs and PDLs separating them, and could shed new light on the onset and perpetuation of
complex arrhythmias, including atrial and ventricular fibrillation.

                                                              8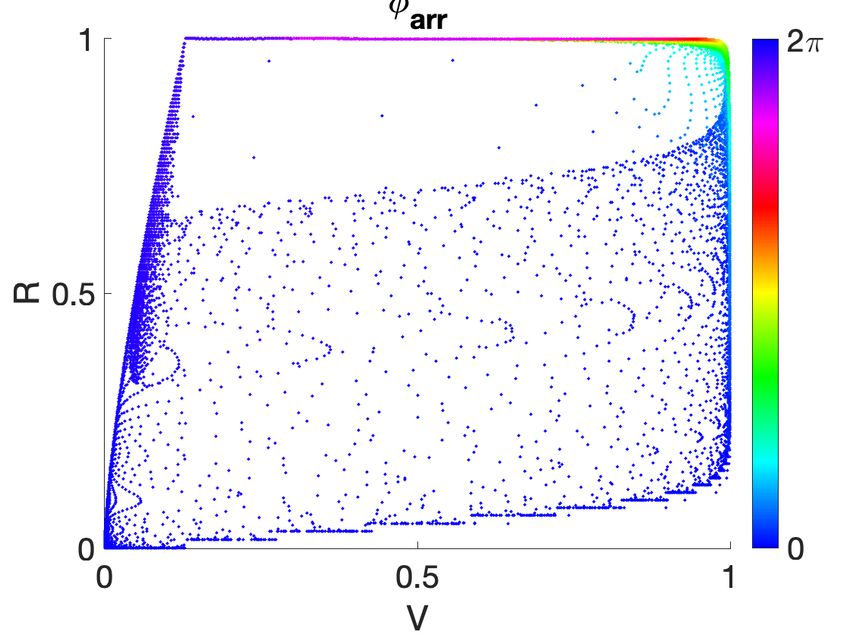
Importantly, the possible role of rotors in clinical management of arrhythmias is still a point
of debate in the scientific community [30, 31]. Examples have been given when a simple conduc-
tion block is detected as a rotor [29] and the role of regions of conduction block is surging in the
description of cardiac activation patterns [29, 32]. Here we argue that, if one adjusts one’s termi-
nology that rotors can rotate also around a finite conduction block line (PDL) and adapts analysis
methods to also detect those ‘rotors’, a more coherent picture is obtained, as in our Fig. 4. In this
view, there are different types of conduction block or PDLs, depending on the integral of phase if
one circumscribes the conduction block line (Eq. (2)): if Q = ± 1, a rotor is attached to the PDL,
if Q = 0, it is only a local conduction block. Thus, all conduction blocks are PDLs, but not all of
them are at the center of rotation of a spiral wave. Note that our observations pertain to a set of
optical mapping experiments in rat hearts only, and we do not claim that in other systems, all PS
should be interpreted as PDLs. Still, since we worked with epicardial recordings, the conduction
block lines found at the rotor cores are not due to endocardial structures, as suggested in [29] in
the case of atrial fibrillation.
    Even at this stage, one can start thinking of consequences for arrhythmia management in the
clinic. First, if PDLs are present rather than point singularities, this may be a reason why rotors
have been so elusive in experimental or clinical recordings. It is sometimes quoted that rotors
only last for part of a period and then disappear; usually, such short living rotors are filtered away
[33]. This observation is consistent with the camera or electrode covering only one end of the
PDL. Further analysis is therefore recommended, using novel algorithms to pick up end points
of a PDL (i.e. the branch point of the phase surface) or the middle part of the region, i.e. a
conduction block line. Another option is to actively develop mapping methods with a wider field
of view, to detect the entire PDL on the cardiac surface. Second, with better knowledge of the
rotor core structure, one can actively reconstruct how the associated electrogram would look like
and look for those signatures in recordings, which may depend on the orientation of the electrode
with respect to the PDL. Finally, if PDLs have a typical orientation with respect to anatomical
features (e.g. endocardial structure, heterogeneity, myofiber direction, scars), this may affect the
optimal ablation lesion.
    In conclusion, we find that the name of mathematician Bernhard Riemann is inscribed twice
in our hearts: the heart is not only a Riemannian manifold [16, 17, 34], but also features phase
defect lines showing non-trivial Riemannian surfaces that organize the electrical patterns during
arrhythmias.

Acknowledgements
E.G.T. was supported by National Science Foundation DCSD grant 1662250. H.D. received mo-
bility funding from the FWO-Flanders, grant K145019N.

References
 [1] Alexander Samol, Kathrin Hahne, and Gerold Monnig. Atrial fibrillation and silent stroke:
     Links, risks, and challenges. Vascular Health and Risk Management, 2016:65, 2016.
 [2] M.A. Allessie, F.I.M. Bonke, and F.J.G. Schopman. Circus movement in rabbit atrial muscle
     as a mechanism of tachycardia. Circ. Res., 33:54–62, 1973.

 [3] R.A. Gray, J. Jalife, A. Panfilov, W.T. Baxter, C. Cabo, J.M. Davidenko, and A.M. Pertsov.
     Mechanisms of cardiac fibrillation. Science, 270:1222–1223, 1995.
 [4] M.P. Nash, A. Mourad, R.H. Clayton, P.M. Sutton, C.P. Bradley, M. Hayward, D.J. Pa-
     terson, and P. Taggart. Evidence for multiple mechanisms in human ventricular fibrillation.
     Circulation, 114(6):536–542, 2006.

                                                  9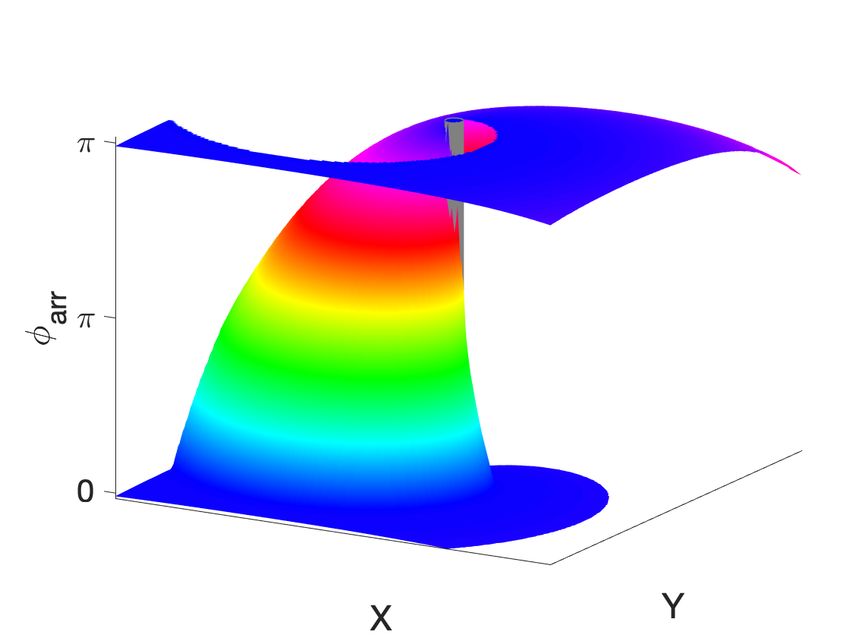
[5] J. Christoph, M. Chebbok, C. Richter, J. Schroder-Schetelig, P. Bittihn, S. Stein, I. Uzelac,
     F.H. Fenton, G. Hasenfuss, R.F. Gilmour, and S. Luther. Electromechanical vortex filaments
     during cardiac fibrillation. Nature, 555:667–672, 2018.
 [6] Sanjiv M. Narayan, David E. Krummen, Kalyanam Shivkumar, Paul Clopton, Wouter-Jan
     Rappel, and John M. Miller. Treatment of atrial fibrillation by the ablation of localized
     sources. Journal of the American College of Cardiology, 60(7):628–636, August 2012.
 [7] M. Haissaguerre, M. Hocini, A. Denis, A. J. Shah, Y. Komatsu, S. Yamashita, M. Daly,
     S. Amraoui, S. Zellerhoff, M.-Q. Picat, A. Quotb, L. Jesel, H. Lim, S. Ploux, P. Bordachar,
     G. Attuel, V. Meillet, P. Ritter, N. Derval, F. Sacher, O. Bernus, H. Cochet, P. Jais, , and
     R. Dubois. Driver domains in persistent atrial fibrillation. Circulation, 130:530–538, 2014.
 [8] R.H. Clayton, E.A. Zhuchkova, and A.V. Panfilov. Phase singularities and filaments: Sim-
     plifying complexity in computational models of ventricular fibrillation. Prog Biophys Molec
     Biol, 90:378–398, 2005.
 [9] D. Noble. A modification of the Hodgkin−Huxley equation applicable to purkinje fiber action
     and pacemaker potential. J. Physiol., 160:317–352, 1962.
[10] R.R. Aliev and A.V. Panfilov. A simple two-variable model of cardiac excitation. Chaos,
     Solitons and Fractals, 7:293–301, 1996.
[11] F.H. Fenton and A. Karma. Vortex dynamics in three-dimensional continuous myocardium
     with fiber rotation: filament instability and fibrillation. Chaos, 8:20–47, 1998.
[12] R.H. Clayton, O. Bernus, E.M. Cherry, H. Dierckx, F.H. Fenton, L. Mirabella, A.V. Panfilov,
     F. Sachse, G. Seemann, and H. Zhang. Models of cardiac tissue electrophysiology: Progress,
     challenges and open questions. Prog Biophys Molec Biol, 104:22–48, 2011.
[13] J.C Neu and W. Krassowska. Homogenization of syncytial tissues. Critical Reviews in Biomed-
     ical Engineering, 21:137–199, 1993.
[14] J.P. Keener. A geometrical theory for spiral waves in excitable media. Siam J Appl Math,
     46:1039–1056, 1986.
[15] V.N. Biktashev, A.V. Holden, and H. Zhang. Tension of organizing filaments of scroll waves.
     Phil. Trans. R. Soc. Lond. A, 347:611–630, 1994.
[16] M. Wellner, O.M. Berenfeld, J. Jalife, and A.M. Pertsov. Minimal principle for rotor filaments.
     Proc Natl Acad Sci USA, 99:8015–8018, 2002.
[17] H. Verschelde, H. Dierckx, and O. Bernus. Covariant stringlike dynamics of scroll wave
     filaments in anisotropic cardiac tissue. Phys. Rev. Lett., 99:168104, 2007.
[18] J.P. Keener. The dynamics of three-dimensional scroll waves in excitable media. Physica D,
     31:269–276, 1988.
[19] I.V. Biktasheva and V.N. Biktashev. Wave-particle dualism of spiral wave dynamics. Phys.
     Rev. E, 67:026221, 2003.
[20] H. Henry and V. Hakim. Scroll waves in isotropic excitable media: linear instabilities, bifur-
     cations, and restabilized states. Phys Rev E, 65:046235, 2002.
[21] C. D. Marcotte and R. O. Grigoriev. Adjoint eigenfunctions of temporally recurrent single-
     spiral solutions in a simple model of atrial fibrillation. Chaos: An Interdisciplinary Journal
     of Nonlinear Science, 26(9):093107, 2016.
[22] H. Dierckx, H. Verschelde, and A.V. Panfilov. Measurement and structure of spiral wave
     response functions. Chaos, 27:093912 1–10, 2017.

                                                10
[23] K.H.W. ten Tusscher and A.V. Panfilov. Alternans and spiral breakup in a human ventricular
tissue model. Am. J. Physiol. Heart Circ. Physiol., 291:1088–100, 2006.
[24] MA Bray and JP Wikswo. Considerations in phase plane analysis for nonstationary reentrant
cardiac behavior. Physical Review E, 65(5, 1), 2002.
[25] P. Kuklik, S. Zeemering, A. Van Hunnik, B. Maesen, d Lau D.H. Pison, L. a, J. Maessen,
P. Podziemski, C. Meyer, B. Schaäffer, H. Crijns, S. Willems, and U. Schotten. Identification
of rotors during human atrial fibrillation using contact mapping and phase singularity detec-
tion: Technical considerations. IEEE Transactions on Biomedical Engineering, 64:310–318,
2017.
[26] S. Shima and Y. Kuramoto. Rotating spiral waves with phase-randomized core in nonlocally
coupled oscillators. Physical Review E, 69:036213 1–9, 2004.
[27] A. Bueno-Orovio, E.M. Cherry, and F.H. Fenton. Minimal model for human ventricular action
potentials in tissue. J Theor Biol, 253:544–560, 2008.
[28] Elizabeth M. Annoni, Shivaram Poigai Arunachalam, Suraj Kapa, Siva K. Mulpuru, Paul A.
Friedman, and Elena G. Tolkacheva. Novel Quantitative Analytical Approaches for Ro-
tor Identification and Associated Implications for Mapping. IEEE Trans. Biomed. Eng.,
65(2):273–281, FEB 2018.
[29] Piotr Podziemski, Stef Zeemering, Pawel Kuklik, Arne van Hunnik, Bart Maesen, Jos
Maessen, Harry J. Crijns, Sander Verheule, and Ulrich Schotten. Rotors detected by phase
analysis of filtered, epicardial atrial fibrillation electrograms colocalize with regions of con-
duction block. Circulation: Arrhythmia and Electrophysiology, 11(10):e005858, 2018.
[30] S.V. Pandit and J. Jalife. Rotors and the dynamics of cardiac fibrillation. Circulation Re-
search, 112:849–862, 2013.
[31] K.N. Aronis, R.D. Berger, and H. Ashikaga. Rotors. how do we know when they are real?
Arrhythmia and Electrphysiology, 10, 2017.
[32] Laura R. Bear, Oumayma Bouhamama, Matthijs Cluitmans, Josselin Duchateau, Richard D.
Walton, Emma Abell, Charly Belterman, Michel Haissaguerre, Olivier Bernus, Ruben Coro-
nel, and Rémi Dubois. Advantages and pitfalls of noninvasive electrocardiographic imaging.
Journal of Electrocardiology, 57:S15 – S20, 2019.
[33] Miguel Rodrigo, Andreu M. Climent, Alejandro Liberos, Francisco Fernandez-Avilas, Omer
Berenfeld, Felipe Atienza, and Maria S. Guillem. Technical considerations on phase mapping
for identification of atrial reentrant activity in direct- and inverse-computed electrograms.
Circulation: Arrhythmia and Electrophysiology, 10(9):e005008, 2017.
[34] R.J. Young and A.V. Panfilov. Anisotropy of wave propagation in the heart can be modeled
by a riemannian electrophysiological metric. Proc Natl Acad Sci USA, 107:15063–8, 2010.
11You can also read