Detecting Texts of Arbitrary Orientations in Natural Images
←
→
Page content transcription
If your browser does not render page correctly, please read the page content below
Detecting Texts of Arbitrary Orientations in Natural Images

                      Cong Yao1,2 Xiang Bai1,2 Wenyu Liu1 Yi Ma2 Zhuowen Tu2,3
                              1
                                Huazhong University of Science and Technology
                                        2
                                          Microsoft Research Asia
                    3
                      Lab of Neuro Imaging and Department of Computer Science, UCLA
    yaocong2010@gmail.com, {xbai,liuwy}@hust.edu.cn, mayi@microsoft.com, ztu@loni.ucla.edu

                         Abstract
    With the increasing popularity of practical vision sys-
tems and smart phones, text detection in natural scenes be-
comes a critical yet challenging task. Most existing meth-
ods have focused on detecting horizontal or near-horizontal
texts. In this paper, we propose a system which detects texts
of arbitrary orientations in natural images. Our algorithm
is equipped with a two-level classification scheme and two                   Figure 1. Detected texts in natural images.
sets of features specially designed for capturing both the
                                                                 isting methods [16, 7, 22] have focused on detecting hori-
intrinsic characteristics of texts. To better evaluate our al-
                                                                 zontal or near-horizontal texts. Detecting texts of arbitrary
gorithm and compare it with other competing algorithms,
                                                                 orientations in complex natural images has received much
we generate a new dataset, which includes various texts
                                                                 less attentions and remains a challenge for most practical
in diverse real-world scenarios; we also propose a proto-
                                                                 systems. In this work, we make an effort to build an ef-
col for performance evaluation. Experiments on benchmark
                                                                 fective and practical detection system for texts of arbitrary
datasets and the proposed dataset demonstrate that our al-
                                                                 orientations in complex natural scenes.
gorithm compares favorably with the state-of-the-art algo-
rithms when handling horizontal texts and achieves signifi-          When directly applied to detect texts of arbitrary orienta-
cantly enhanced performance on texts of arbitrary orienta-       tions, conventional features (such as SWT used in [7]) that
tions in complex natural scenes.                                 are primarily designed for horizontal texts would lead to
                                                                 significant false positives. In this paper, we introduce two
1. Introduction                                                  additional sets of rotation invariant features for text detec-
                                                                 tion. To further reduce false positives produced by these
   The great success of smart phones and large demands in        low-level features, we have also designed a two-level classi-
content-based image search/understanding have made text          fication scheme that can effectively discriminate texts from
detection a crucial task in human computer interaction. It       non-texts. Hence, combining the strengths of specially de-
is desirable to build practical systems that are robust and      signed features and discriminatively trained classifiers, our
fast enough to deal with natural scenes of various condi-        system is able to effectively detect texts of arbitrary orien-
tions; as shown in Fig. 1, we want to detect texts of large      tations but produce fewer false positives.
variations in language, font, color, scale and orientation in        To evaluate the effectiveness of our system, we have con-
complex scenes. Although text detection has been studied         ducted extensive experiments on both conventional and new
extensively in the past [19, 15], the problem remains un-        image datasets. Compared with the state-of-the-art text de-
solved. The difficulties mainly come from two aspects: (1)       tection algorithms, our system performs competitively in
the diversity of the texts and (2) the complexity of the back-   the conventional setting of horizontal texts. We have also
grounds. On one hand, text is a high level concept but better    tested our system on a very challenging large dataset of 500
defined than the generic objects [8]; on the other hand, re-     natural images containing texts of various orientations in
peated patterns (such as windows and barriers) and random        complex backgrounds (see Fig. 8 (a)). On this dataset, our
clutters (such as grasses and leaves) may be similar to texts,   system works significantly better than any of the existing
and thus lead to potential false positives.                      systems, with an F-measure about 0.6, more than twice that
   As our survey of related work shows below, most ex-           of the closest competitor.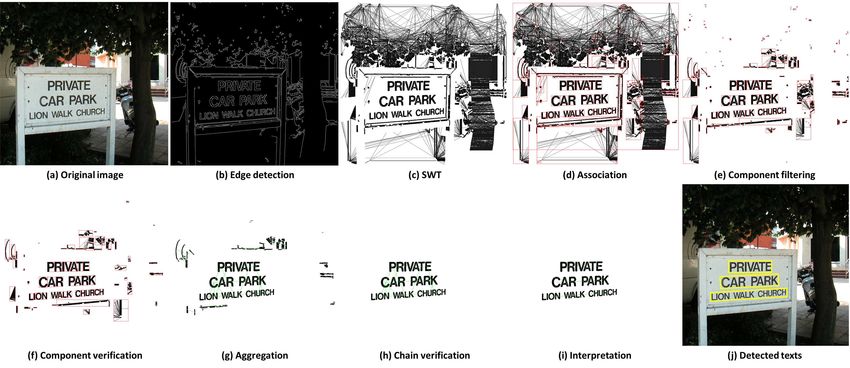
2. Related Work
There have been a large number of methods dealing with
text detection in natural images and videos [18, 16, 30, 27,
22, 26]. Comprehensive surveys can be found in [15, 19].
Existing approaches to text detection can be roughly di-
vided into three categories: texture-based methods, region-
based methods, and hybrid methods. Texture-based meth-
ods [16, 6, 10] treat texts as a special type of texture and
make use of their properties, such as local intensities, fil-
ter responses and wavelet coefficients. These methods are
computation demanding as all locations and scales are ex-
haustively scanned. Moreover, these algorithms mostly de-
tect horizontal texts. Region-based methods [14, 7, 22]
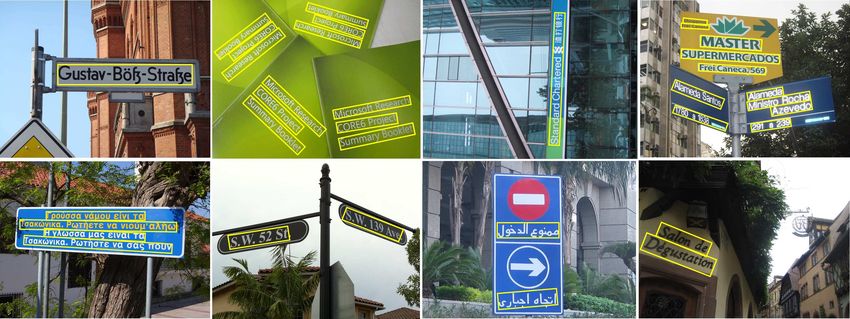
first extract candidate text regions through edge detection Figure 2. Pipeline of the proposed approach.
or clustering and then eliminate non-text regions using vari- 3. Methodology
ous heuristic rules. The third category, hybrid methods [23],
is a mixture of texture-based and region-based methods. In this section, we present the details of the proposed
Most existing algorithms, e.g. [23, 7], have focused on algorithm. Specifically, the pipeline of the algorithm will
detecting horizontal texts. In this paper, we address the be presented in Sec. 3.1 and the details of the features will
problem of detecting texts of large variations in natural im- be described in Sec. 3.2.
ages, which has great practical importance but has not been 3.1. Algorithm Pipeline
well studied. In [29, 26], methods that can detect text strings 3.1.1 overview
of arbitrary directions are proposed but they have a large set
of rules and parameters; how general and applicable they The proposed algorithm consists of four stages: (1) com-
are in dealing with scenes of large variation is unclear. ponent extraction, (2) component analysis, (3) candidate
linking, and (4) chain analysis, which can be further cat-
We observe two-sides aspects about the current text de-
egorized into two procedures, bottom-up grouping and top-
tection algorithms: (1) methods built on heavy learning
down pruning, as shown in Fig. 2. In the bottom-up group-
(nearly black-box) [6] by training classifiers on a large
ing procedure, pixels first form connected components and
amount of data reach certain but limited level of success
later these connected components are aggregated to form
(system [6] obtained from the authors produces reason-
chains; in the top-down pruning procedure non-text compo-
able results on horizontal English texts but has poor per-
nents and chains are successively identified and eliminated.
formances in the general cases); (2) systems based on smart
Component extraction: At this stage, edge detection is
features, such as Stroke Width Transform (SWT) [7], are
performed on the original image and the edge map is input
robust to variations in texts but they involve many hand tun-
to SWT [7] module to produce an SWT image. Neighbor-
ings and are still far from producing all satisfactory results,
ing pixels in the SWT image are grouped together to form
especially for non-horizontal texts.
connected components using a simple association rule.
In this paper, we adopt SWT and also design various Component analysis: Many components extracted at the
features that are intrinsic to texts and robust to variations; component extraction stage are not parts of texts. The
a two-level classification scheme is devised to moderately component analysis stage therefore identifies and filters out
utilize training to remove sensitive manual parameter tun- those non-text components by a trained classifier.
ing. We observe significant improvement over the existing Candidate linking: The remaining components are taken
approaches in dealing with real-world scenes. as character candidates1 . The first step of the candidate link-
Though widely used in the community, the ICDAR ing stage is to link the character candidates into pairs. Two
datasets [20, 24] only contain horizontal English texts. adjacent candidates are grouped into a pair if they have sim-
In [29], a dataset with texts of different directions is re- ilar geometric properties and colors. The candidate pairs are
leased, but it includes only 89 images without enough di- then aggregated into chains in a recursive fashion.
versity in the texts and backgrounds. Here we collect a new Chain analysis: At the chain analysis stage, the chains de-
dataset with 500 images of indoor and outdoor scenes. In termined at the former stage are verified by a chain level
addition, the evaluation methods used in [13] and the IC- 1 Infact, components do not necessarily correspond to characters, be-
DAR competitions [21, 20] are designed for horizontal texts cause a single character in some languages may consist of several strokes;
only. Hence, we use a different protocol that is suitable to however, we still call them characters (or character candidates) hereafter
handle texts of arbitrary orientations (see Sec. 4). for simplicity.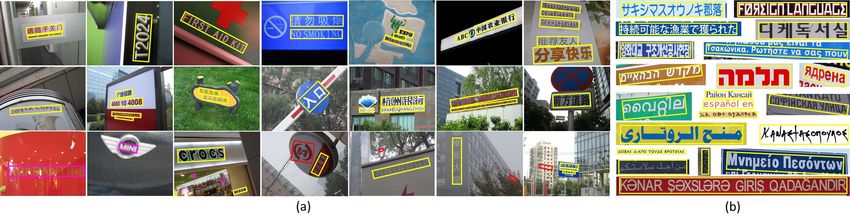
Table 1. Basic component properties and their valid ranges.
       Property                Definition                   Range
                                        σ(c)
    width variation          W V (c) =                      [0, 1]
                                        µ(c)
                                      w(c) h(c)
      aspect ratio      AR(c) = min{       ,    }          [0.1, 1]
                                      h(c) w(c)
                                         q
    occupation ratio      OR(c) =                          [0.1, 1]
                                    w(c) ∗ h(c)                       Figure 4. Component characteristics. The green points are the centers of
                                                                      the components. The radii of the pink circles represent their characteristic
classifier. The chains with low classification scores (proba-         scales while the yellow lines indicate the major orientations. The two im-
bilities) are discarded. The chains may be in any direction,          ages, which contain the same text line, are taken from different viewpoints
so a candidate might belong to multiple chains; the inter-            and distances.
pretation step is aimed to dispel this ambiguity. The chains          ponents, are used to train this classifier. The criteria for
that pass this stage are the final detected texts.                    feature design are: scale invariance, rotation invariance and
                                                                      low computational cost. To meet these criteria, we propose
3.1.2 Component Extraction                                            to estimate the center, characteristic scale and major ori-
To extract connected components from the image, SWT [7]               entation of each component (Fig. 4) before computing the
is adopted for its effectiveness and efficiency. In addition,         component level features. Based on these characteristics,
it provides a way to discover connected components from               features that are both effective and computational efficient
edge map directly. We use Canny edge detector [5] to                  can be obtained. The details of these component level fea-
produce an edge map (Fig. 3 (b)) from the original image              tures are discussed in Sec. 3.2.1.
(Fig. 3 (a)). SWT is a local image operator which com-                   For a component c, the barycenter o(c), major axis L(c),
putes per pixel width of the most likely stroke containing            minor axis l(c), and orientation θ(c) are estimated using
the pixel. See [7] for details. The resulting SWT image is            Camshift algorithm [3] by taking the SWT image of com-
shown in Fig. 3 (c).                                                  ponent c as distribution map. The center, characteristic
    The next step of this stage is to group the pixels in the         scale and major orientation of component c are defined as:
SWT image into connected components. The pixels are as-               O(c) = o(c), S(c) = L(c) + l(c), and Θ(c) = θ(c).
sociated using a simple rule that the ratio of SWT values of             These characteristics are invariant to translation, scale
neighboring pixels is less than 3.0. The connected compo-             and rotation to some degree (Fig. 4). As we will explain
nents are shown in Fig. 3 (d). Note the red rectangles in the         in Sec. 3.2.1, this is the key to the scale and rotation invari-
image. Each rectangle contains a connected component.                 ance of the component level features.
                                                                         We train a component level classifier using the compo-
3.1.3 Component Analysis
                                                                      nent level features. Random Forest [4] is chosen as the
The purpose of component analysis is to identify and elim-            strong classifier. The component level classifier is the first
inate the connected components that are unlikely parts of             level of the two-level classification scheme. The probabil-
texts. Towards this end, we devise a two-layer filtering              ity of component c, p1 (c), is the fraction of votes for the
mechanism. The first layer is a filter consists of a set of           positive class (text) from the trees. The components whose
heuristic rules. This filter runs on a collection of statis-          probabilities are lower than a threshold T1 are eliminated
tical and geometric properties of components, which are               and the remaining components are considered as character
very fast to compute. For a connected component c with                candidates (Fig. 3 (f)).
q foreground pixels (black pixels in the SWT image), we
                                                                      3.1.4 Candidate Linking
first compute its bounding box bb(c) (its width and height
are denoted by w(c) and h(c), respectively) and the mean              The character candidates are aggregated into chains at this
as well as standard deviation of the stroke widths, µ(c) and          stage. This stage also serves as a filtering step because the
σ(c). The definitions of these basic properties and the cor-          candidate characters cannot be linked into chains are taken
responding valid ranges are summarized in Tab. 1.                     as components casually formed by noises or background
    The components with one or more invalid properties will           clutters, and thus are discarded.
be taken as non-text regions and discarded. This prelimi-                 Firstly, character candidates are linked into pairs. In [7],
nary filter proves to be both effective and efficient. A large        whether two candidates can be linked into a pair is deter-
portion of obvious non-text regions are eliminated after this         mined based on the heights and widths of their bounding
step. Notice the difference between Fig. 3 (d) and Fig. 3 (e).        boxes. However, bounding boxes of candidates are not ro-
    The second layer is a classifier trained to identify and re-      tation invariant, so we use their characteristic scales instead.
ject the non-text components that are hard to remove with             If two candidates have similar stroke widths (ratio between
the preliminary filter. A collection of component level fea-          the mean stroke widths is less than 2.0), similar sizes (ra-
tures, which capture the differences of geometric and textu-          tio between their characteristic scales does not exceed 2.5),
ral properties between text components and non-text com-              similar colors and are close enough (distance between them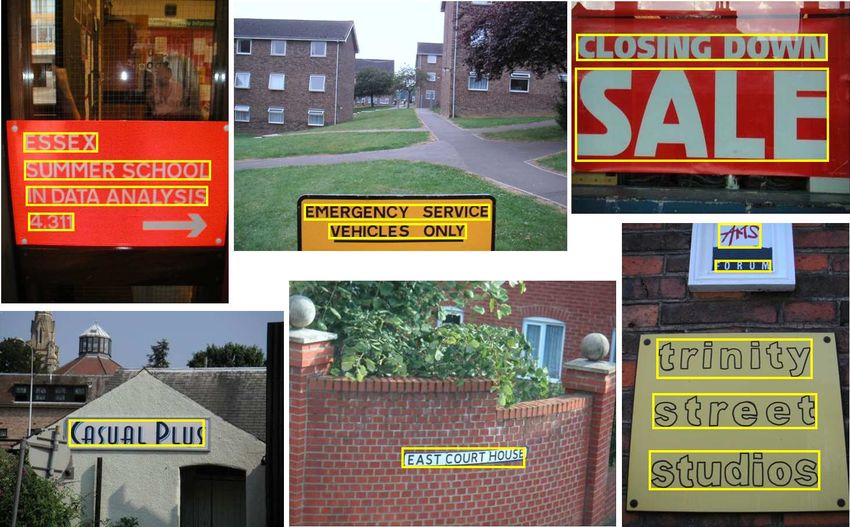
Figure 3. Text detection process. See text for details.

is less than two times the sum of their characteristic scales),                      At last, the character candidates not belonging to any
they are labeled as a pair. Unlike [7], which only considers                      chain are discarded. The candidate chains after aggrega-
horizontal linkings, the proposed algorithm allows linkings                       tion are shown in Fig. 3 (g). Each green line represents a
of arbitrary directions. This endows the system with the                          candidate chain.
ability of detecting texts of arbitrary orientations, not lim-
ited to horizontal texts (see Fig. 1). Note that a character                      3.1.5 Chain Analysis
candidate may belong to several pairs.                                            The candidate chains formed at the previous stage might in-
    Next, a greedy hierarchical agglomerative clustering [12]                     clude false positives that are random combinations of scat-
method is applied to aggregate the pairs into candidate                           tered background clutters (such as leaves and grasses) and
chains. Initially, each pair constitutes a chain. Then the sim-                   repeated patterns (such as bricks and windows). To elimi-
ilarity between each couple of chains that share at least one                     nate these false positives, a chain level classifier is trained
common candidate and have similar orientations is com-                            using the chain level features (Sec. 3.2.2). Random For-
puted; chains with the highest similarity are merged to-                          est [4] is again used. The chain level classifier is the second
gether to form a new chain. The orientation consistency                           level of the two-level classification scheme. The probability
so (C1 , C2 ) and population consistency sp (C1 , C2 ) between                    of chain C, p2 (C), is the fraction of votes for the positive
two chains C1 and C2 , which share at least one common                            class (text) from the trees. The chains with probabilities
candidate, are defined as:                                                        lower than a threshold T2 are eliminated.
                   (
                                γ(C1 , C2 )                      π
                                                                                     To make better decisions, the total probability of each
                           1−                 if γ(C1 , C2 ) ≤                    chain is also calculated. For a chain C with n candi-
  so (C1 , C2 ) =                 π/2                            8    ,     (1)
                           0                  otherwise                           dates ci , iP
                                                                                              = 1, 2, · · · , n, the total probability is defined as:
                                                                                                n
                                                                                                    p1 (ci )
and                                                                               p(C) = ( i=1                + p2 (C))/2. The chains whose total
                                                                                                   n
                   (                                                              probabilities are lower than a threshold T are discarded.
                               |nC1 − nC2 |                       π
                       1−                      if γ(C1 , C2 ) ≤                      As texts of arbitrary orientations are considered, the re-
 sp (C1 , C2 ) =               |nC1 + nC2 |                       8       , (2)   maining chains may be in any direction. Therefore, a can-
                       0                       otherwise
                                                                                  didate might belong to multiple chains. For example, in
where γ(C1 , C2 ) is the included angle of C1 and C2 while                        Fig. 3 (h) the character ‘P’ in the first line is linked in three
nC1 and nC2 are the candidate numbers of C1 and C2 . The                          chains (note the green lines). In reality, however, a char-
similarity between two chains C1 and C2 is:                                       acter is unlikely to belong to multiple text lines. If several
                                                                                  chains compete for the same candidate, only the chain with
 s(C1 , C2 ) = ω · so (C1 , C2 ) + (1 − ω) · sp (C1 , C2 ), (3)                   the highest total probability will survive (note the difference
                                                                                  between Fig. 3 (h) and Fig. 3 (i)).
where ω ∈ [0, 1] is a control parameter. ω is set to 0.5 to                          The survived chains are outputted by the system as de-
give equal weights to so (C1 , C2 ) and sp (C1 , C2 ). Accord-                    tected texts (Fig. 3 (j)). For each detected text, its orienta-
ing to this similarity definition, the chains with proximal                       tion is calculated through linear least squares [12] using the
sizes and orientations are merged with priority. This merg-                       centers of the characters; its minimum area rectangle [9] is
ing process proceeds until no chains can be merged.                               estimated using the orientation and the bounding boxes of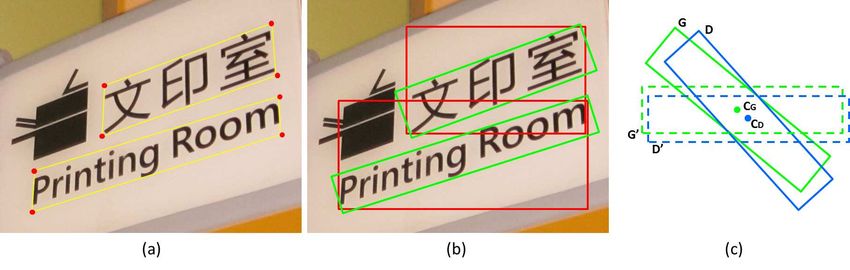
– Edge shape [11]. Edge shape is also a histogram of
                                                                              oriented gradients; but the gradients are computed at all the
                                                                              pixels in the sector (Fig. 5 (d)).
                                                                                  – Occupation ratio. Occupation ratio is defined as the
                                                                              ratio between the number of the foreground pixels of the
                                                                              component within the sector and the sector area (Fig. 5 (e)).
                                                                                  To achieve rotation invariance, the gradient orientations
                                                                              are rotated by an angle Θ(c), before computing contour
Figure 5. Templates and calculation of scalable rotative descriptors. (a)     shape and edge shape. Then, the gradient orientations are
Two templates used for computing the descriptors. The radius space and        normalized to the range [0, π]. 6 orientation bins are used
angle space are partitioned evenly in a coarse-to-fine manner. The red
                                                                              for computing histograms of contour shape and edge shape,
arrows indicate the reference orientations of the templates. (b) Component
and its characteristics. (c)(d)(e) Calculation of contour shape, edge shape   to cope with different fonts and local deformations. For
and occupation ratio. See text for details.                                   each cue, the signals computed in all the sectors of all the
                                                                              templates are concatenated to form a descriptor. We call
the characters. Word partition, which divides text lines into
                                                                              these descriptors scalable rotative descriptors, because they
separate words, is also implemented in the proposed algo-
                                                                              are computed based on templates that are scalable and rota-
rithm; but it is not shown in Fig. 3 since the general task of
                                                                              tive. Scalable rotative descriptors are similar to PHOG [2],
text detection does not require this step.
                                                                              as they both adopt spatial pyramid representation [17].
    The whole algorithm is performed twice to handle both                         Different from the templates used for computing PHOG,
bright text on dark background and dark text on bright back-                  our templates are circular and their scale and orientation are
ground, once along the gradient direction and once along                      adaptive to the component being described. This is the key
the inverse direction. The results of two passes are fused                    to the scale and rotation invariance of these descriptors. We
to make final decisions. For clarity, only the results of one                 found through experiments (not shown in this paper) that
pass are presented in Fig. 3.                                                 using finer templates can slightly improve the performance,
3.2. Feature Design                                                           but will largely increase the computational burden.
    We design two collections of features, component level                        Another three types of features are also considered:
features and chain level features, for classifying text and                       – Axial ratio. Axial ratio is computed by dividing
non-text, based on the observation that it is the median de-                  the major axis of the component c with its minor axis:
gree of regularities of text rather than particular color or                  XR(c) = L(c)/l(c).
shape that distinguish it from non-text, which usually has                        – Width variation. This feature is the same as defined
either low degree (random clutters) or high degree (repeated                  in Tab. 1.
patterns) of regularities. At character level, the regularities                   – Density. The density of component c is defined as
of text come from nearly constant width and texturelessness                   the ratio between its pixel number q and characteristic area
of strokes, and piecewise smoothness of stroke boundaries;                    (here the characteristic area is π · S 2 (c), not the area of the
at line level, the regularities of text are similar colors, sizes,            bounding box): D(c) = q/(π · S 2 (c)).
orientations and structures of characters, and nearly con-
stant spacing between consecutive characters.                                 3.2.2 Chain Level Features
                                                                              Eleven types of chain level features are designed to discrim-
3.2.1 Component Level Features                                                inate text lines from false positives (mostly repeated pat-
Inspired by Shape Context [1] and Feature Context [28], we                    terns and random clutters) that cannot be distinguished by
devise two templates (Fig. 5 (a)) to capture the regularities                 the component level features.
of each component in coarse and fine granularity, respec-                          For a candidate chain C with n (n ≥ 2) candidates
tively. The radius and orientation of the templates are not                   ci , i = 1, 2, . . . , n, the features are defined as below:
stationary, but adaptive to the component. When comput-                            – Candidate count. This feature is adopted based on the
ing descriptors for a component, each template is placed at                   observation that false positives usually have very few (ran-
the center and rotated to align with the major orientation of                 dom clutters) or too many (repeated patterns) candidates.
the component; the radius is set to the characteristic scale                       – Average probability. The probabilities given by the
of the component. Different cues from the sectors are en-                     component level classifier are reliable. This feature is the
coded and concatenated into histograms. In this paper, the                    average of all the probabilities (p1 (ci ), i = 1, 2, . . . , n) of
following cues are considered for each sector:                                the candidates belonging to C.
   – Contour shape [11]. Contour shape is a histogram                              – Average turning angle. Most texts present in linear
of oriented gradients. The gradients are computed on the                      form, so for a text line the mean of the turning angles at the
component contour (Fig. 5 (c)).                                               interior characters (τ (ci ), i = 2, 3, . . . , n − 1) is very small;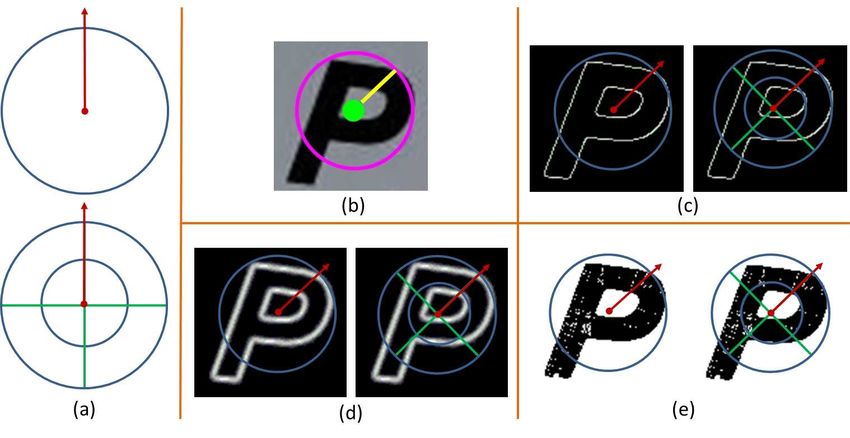
however, for random clutters this property will not hold.
τ (ci ) is the included angle between the line O(ci−1 )O(ci )
and O(ci )O(ci+1 ).
    – Size variation. In most cases characters in a text line
have approximately equal sizes; but it’s not that case for
random clutters. The size of each component is measured           Figure 6. Ground truth generation and overlap ratio calculation. (a) Hu-
by its characteristic scale S(ci ).                               man annotations. The annotators are required to bound each text line using
                                                                  a four-vertex polygon (red dots and yellow lines). (b) Ground truth rect-
    – Distance variation. Another property of text is that        angles (green). The ground truth rectangle is generated automatically by
characters in a text line are distributed uniformly, i.e. the     fitting a minimum area rectangle using the polygon. (c) Calculation of
distances between consecutive characters have small devia-        overlap ratio between detection rectangle and ground truth rectangle.
tion. The distance between two consecutive components is          MSRA Text Detection 500 Database (MSRA-TD500)2, be-
the distance of their centers O(ci−1 ) and O(ci ).                cause it contains 500 natural images in total. These im-
    – Average direction bias. For most text lines, the major      ages are taken from indoor (office and mall) and outdoor
orientations of the characters are nearly perpendicular to the    (street) scenes using a packet camera. The indoor images
major orientation of the text line.                               are mainly signs, doorplates and caution plates while the
    – Average axial ratio. Some repeated patterns (e.g. bar-      outdoor images are mostly guide boards and billboards in
riers) that are not texts consist of long and thin components,    complex background. The resolutions of the images vary
this feature can help differentiate them from true texts.         from 1296 × 864 to 1920 × 1280. Some typical images
    – Average density. On the contrary, other repeated pat-       from this dataset are shown in Fig. 8 (a).
terns (e.g. bricks) consist of short and fat components, this         This dataset is very challenging because of both the di-
feature can be used to eliminate this kind of false positives.    versity of the texts and the complexity of the backgrounds in
    – Average width variation. False positives formed by          the images. The texts may be in different languages (Chi-
foliage usually have varying widths while texts have con-         nese, English or mixture of both), fonts, sizes, colors and
stant widths. This feature is defined as the mean of all the      orientations. The backgrounds may contain vegetation (e.g.
width variation values of the candidates.                         trees and grasses) and repeated patterns (e.g. windows and
    – Average color self-similarity. Characters in a text         bricks), which are not so distinguishable from text.
line usually have similar but not identical color distribu-           The dataset is divided into two parts: training set and
tions with each other; yet in false positive chains, color        test set. The training set contains 300 images randomly
self-similarities [25] of the candidates are either too high      selected from the original dataset and the rest 200 images
(repeated patterns) or too low (random clutters). The color       constitute the test set. All the images in this dataset are
similarity cs(x, y) is defined as the cosine similarity of the    fully annotated. The basic unit in this dataset is text line
color histograms of the two candidates x and y.                   rather than word, which is used in the ICDAR dataset, be-
    – Average structure self-similarity. Likewise, charac-        cause it is hard to partition Chinese text lines into individual
ters in a text line have similar structure with each other        words based on their spacings; even for English text lines,
while false positives usually have almost the same structure      it is non-trivial to perform word partition without high level
(repeated patterns) or diverse structures (random clutters).      information. The procedure of ground truth generation is
The structure similarity ss(x, y) is defined as the cosine        shown in Fig. 6 (a) and (b).
similarity of the edge shape descriptors of the two compo-            Minimum area rectangles [9] are used in our protocol be-
nents x and y.                                                    cause they (green rectangles in Fig. 6 (b)) are much tighter
                                                                  than axis-aligned rectangles (red rectangles in Fig. 6 (b)).
4. Dataset and Evaluation Protocol                                However, a problem imposed by using minimum area rect-
    In this section, we introduce a dataset for evaluating text   angles is that it is difficult to judge whether a text line is
detection algorithms, which contains images of real-world         correctly detected. As shown in Fig. 6 (c), it is not trivial
complexity; a new evaluation method is also proposed.             to directly compute the overlap ratio between the estimated
    Although widely used in the community, the ICDAR              rectangle D and the ground truth rectangle G. Instead, we
dataset [21, 20] has two major drawbacks. First, most of          compute the overlap ratio using axis-aligned rectangles G′
the text lines (or single characters) in the ICDAR dataset        and D′ , which are obtained by rotating G and D round
are horizontal. In real scenarios, however, text may appear       their centers CG and CD , respectively. The overlap ratio
                                                                                                                     A(G′ ∩ D′ )
in any orientation. The second drawback is that all the text      between G and D is defined as: m(G, D) =
lines or characters in this dataset are in English. These two                                                        A(G′ ∪ D′ )
                                                                               ′      ′           ′    ′
                                                                  where A(G ∩ D ) and A(G ∪ D ) denote the areas of the
shortcomings are also pointed out in [23, 29]. In this work,
                                                                  intersection and union of G′ and D′ . Similar to the evalu-
we generate a new multilingual image dataset with horizon-
tal as well as skewed and slant texts. We name this dataset          2 http   : //users.loni.ucla.edu/∼ztu/Download f ront.htm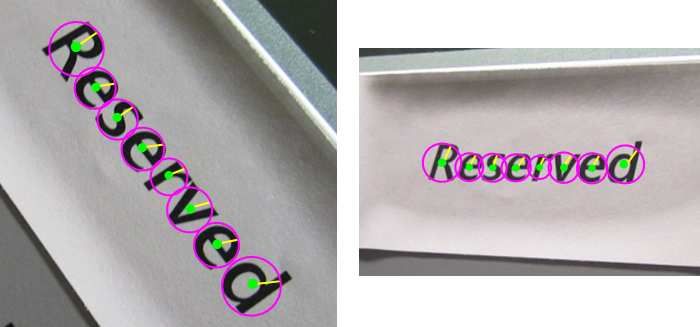
Table 2. Performances of different text detection methods evaluated on
                                                                   the ICDAR test set.
                                                                              Algorithm          Precision   Recall   F-measure
                                                                              TD-Mixture           0.69       0.66        0.67
                                                                              TD-ICDAR             0.68       0.66        0.66
                                                                           Epshtein et al. [7]     0.73       0.60        0.66
                                                                              Yi et al. [29]       0.71       0.62        0.62
                                                                           Becker et al. [20]      0.62       0.67        0.62
     Figure 7. Detected texts in images from the ICDAR test set.             Chen et al. [6]       0.60       0.60        0.58
ation method for the PASCAL object detection task [8], in                    Zhu et al. [20]       0.33       0.40        0.33
our protocol detections are considered true or false positives               Kim et al. [20]       0.22       0.28        0.22
based on the overlap ratio between the estimated minimum                    Ezaki et al. [20]      0.18       0.36        0.22
area rectangles and the ground truth rectangles. If the in-        Table 3. Performances of different text detection methods evaluated on
cluded angle of the estimated rectangle and the ground truth       the proposed dataset.
rectangle is less than π/8 and their overlap ratio exceeds
                                                                              Algorithm          Precision   Recall   F-measure
0.5, the estimated rectangle is considered a correct detec-
                                                                              TD-Mixture           0.63       0.63        0.60
tion. Multiple detections of the same text line are taken
                                                                              TD-ICDAR             0.53       0.52        0.50
as false positives. The definitions of precision and recall
                                                                           Epshtein et al. [7]     0.25       0.25        0.25
are: precision = |T P |/|E|, recall = |T P |/|T | where
                                                                             Chen et al. [6]       0.05       0.05        0.05
T P is the set of true positive detections while E and T
are the sets of estimated rectangles and ground truth rectan-      Table 4. Performances of different text detection methods evaluated on
gles. The F-measure, which is a single measure of algorithm        the Oriented Scene Text Database (OSTD) [29].
performance, is a combination of the two above measures:                      Algorithm          Precision   Recall   F-measure
f = 2 · precision · recall/(precision + recall).                              TD-Mixture           0.77       0.73        0.74
                                                                              TD-ICDAR             0.71       0.69        0.68
5. Experiments
                                                                              Yi et al. [29]       0.56       0.64        0.55
    We implemented the proposed algorithm and trained two                  Epshtein et al. [7]     0.37       0.32        0.32
text detectors, one on the mixture of the ICDAR training set                 Chen et al. [6]       0.07       0.06        0.06
and the training set of the proposed dataset, and the other
only on the ICDAR training set. These two text detectors           with the presence of vegetation and buildings. The images
are denoted by TD-Mixture and TD-ICDAR, respectively.              in the last row of Fig. 8 (a) are some typical cases where
200 trees are used for training the component level classi-        our algorithms failed to detect the texts or gave false posi-
fier and 100 trees for the chain level classifier. The threshold   tives. The misses (pink rectangles) are mainly due to strong
values are: T1 = 0.1, T2 = 0.3 and T = 0.4. We found em-           highlights, blur and low resolution; the false positives (red
pirically that the text detectors under this parameter setting     rectangles) are usually caused by windows, trees, or signs
work well for all the datasets used in this paper.                 that are very alike text.
    In order to compare the proposed algorithm with exist-            The performances are measured using the proposed eval-
ing methods, we evaluated the algorithm on the standard            uation protocol and shown in Tab. 3. Our algorithm
benchmark ICDAR dataset [21, 20]. The ICDAR dataset                achieves significantly enhanced performance when detect-
contains 509 fully annotated text images. 258 images from          ing texts of arbitrary orientations. The performances of
the dataset are used for training and 251 for testing.             other competing algorithms are not presented because of
    Some text detection examples of the proposed algorithm         unavailability of their executables. The average process-
are presented in Fig. 7. The algorithm can handle several          ing time of our algorithm on this dataset is 7.2s and that of
types of challenging scenarios, e.g. variations in text font,      Epshtein et al. is 6s (both tested on a 2.53GHz CPU with-
color and size, as well as repeated patterns and background        out optimization). Our algorithm is a bit slower, but with
clutters. The quantitative comparisons of different meth-          the advantage of being able to detect multi-oriented texts.
ods evaluated on the ICDAR test set are shown in Tab. 2.              In [29], a dataset called Oriented Scene Text Database
Our algorithm compares favorably with the state-of-the-art         (OSTD), which contains texts of various orientations, is re-
algorithms when dealing with horizontal texts.                     leased. This dataset contains 89 images of logos, indoor
    Besides the ICDAR dataset, we also tested the proposed         scenes and street views. We perform text detection on all
algorithm and the systems of Chen et al. [6] and Epshtein          the images in this dataset. The quantitative results are pre-
et al. [7] on the proposed dataset. Examples of our algo-          sented in Tab. 4. Our method outperforms [29] on the Ori-
rithm on this dataset are shown in Fig. 8 (a). Our algorithm       ented Scene Text Database (OSTD), with an improvement
is able to detect texts of large variation in natural scenes,      of 0.19 in F-measure.
Figure 8. (a) Detected texts in images from the proposed dataset. Yellow rectangles: true positives, pink rectangles: false negatives, red rectangles: false
positives. Best viewed in color. (b) Detected texts in various languages in images collected from the internet. Note that the texts are detected in full images.
We only show cropped sub images because of space limitation.
From Tab. 3 and Tab. 4, we observe that even TD- [6] X. Chen and A. Yuille. Detecting and reading text in natural scenes. In Proc.
CVPR, 2004.
ICDAR (only trained on horizontal texts) achieves much
[7] B. Epshtein, E. Ofek, and Y. Wexler. Detecting text in natural scenes with stroke
better performance than other methods on non-horizontal width transform. In Proc. CVPR, 2010.
texts. It demonstrates the effectiveness of the proposed fea- [8] M. Everingham, L. V. Gool, C. K. I. Williams, J. Winn, and A. Zisserman. The
tures. Fig. 8 (b) shows some detected texts in various lan- pascal visual object classes (voc) challenge. IJCV, 2010.
[9] H. Freeman and R. Shapira. Determining the minimum-area encasing rectangle
guages, including both oriental and western languages, such for an arbitrary closed curve. Comm. ACM, 1975.
as Japanese, Korean, Arabic, Greek, and Russian. Though [10] J. Gllavata, R. Ewerth, and B. Freisleben. Text detection in images based on
our text detector is only trained on Chinese and English unsupervised classification of high-frequency wavelet coefficients. In Proc.
ICPR, 2004.
texts, it can effortlessly generalize to texts in different lan-
[11] C. Gu, J. Lim, P. Arbelaez, and J. Malik. Recognition using regions. In Proc.
guages. It indicates that the proposed algorithm is quite CVPR, 2009.
general and it can serve as a multilingual text detector if [12] T. Hastie, R. Tibshirani, and J. Friedman. The elements of statistical learning:
Data mining, inference, and prediction, second edition. New York: Springer,
sufficient training examples are available. 2009.
[13] X. S. Hua, W. Liu, and H. J. Zhang. An automatic performance evaluation
6. Conclusions and Future Work protocol for video text detection algorithms. IEEE Trans. CSVT, 2004.
We have presented a text detection system that detects [14] A. Jain and B. Yu. Automatic text location in images and video frames. PR,
1998.
texts of arbitrary directions in natural images. Our sys- [15] K. Jung, K. Kim, and A. Jain. Text information extraction in images and video:
tem compares favorably with the state-of-the-art algorithms a survey. PR, 2004.
when handling horizontal texts and achieves significantly [16] K. I. Kim, K. Jung, and J. H. Kim. Texture-based approach for text detection
in images using support vector machines and continuously adaptive mean shift
enhanced performance on texts of arbitrary orientations in algorithm. IEEE Trans. PAMI, 2003.
complex natural scenes. [17] S. Lazebnik, C. Schmid, and J. Ponce. Beyond bags of features: Spatial pyra-
The component level features are actually character de- mid matching for recognizing natural scene categories. In Proc. CVPR, 2006.
[18] H. P. Li, D. Doermann, and O. Kia. Automatic text detection and tracking in
scriptors that can distinguish among different characters, digital video. IEEE Trans. IP, 2000.
thus they can be adopted to recognize characters. We plan to [19] J. Liang, D. Doermann, and H. Li. Camera-based analysis of text and docu-
make use of this property and develop an unified framework ments: a survey. IJDAR, 2005.
for text detection and character recognition in the future. [20] S. M. Lucas. Icdar 2005 text locating competition results. In Proc. ICDAR,
2005.
Acknowledgment [21] S. M. Lucas, A. Panaretos, L. Sosa, A. Tang, S. Wong, and R. Young. Icdar
2003 robust reading competitions. In Proc. ICDAR, 2003.
This work was supported by National Natural Science [22] L. Neumann and J. Matas. A method for text localization and recognition in
real-world images. In Proc. of ACCV, 2010.
Foundation of China (grant No. 61173120 and 60903096),
[23] Y. Pan, X. Hou, and C. Liu. A hybrid approach to detect and localize texts in
Office of Naval Research Award N000140910099 and NSF natural scene images. IEEE Trans. IP, 2011.
CAREER award IIS-0844566. [24] A. Shahab, F. Shafait, and A. Dengel. Icdar 2011 robust reading competition
challenge 2: Reading text in scene images. In Proc. ICDAR, 2011.
References [25] E. Shechtman and M. Irani. Matching local self-similarities across images and
videos. In Proc. CVPR, 2007.
[1] S. Belongie, J. Malik, and J. Puzicha. Shape matching and object recognition [26] P. Shivakumara, T. Q. Phan, and C. L. Tan. A laplacian approach to multi-
using shape contexts. IEEE Trans. PAMI, 2002. oriented text detection in video. IEEE Trans. PAMI, 2011.
[2] A. Bosch, A. Zisserman, and X. Munoz. Representing shape with a spatial [27] K. Wang and S. Belongie. Word spotting in the wild. In Proc. ECCV, 2010.
pyramid kernel. In Proc. CIVR, 2007.
[28] X. Wang, X. Bai, W. Liu, and L. J. Latecki. Feature context for image classifi-
[3] G. R. Bradski. Real time face and object tracking as a component of a per- cation and object detection. In Proc. CVPR, 2010.
ceptual user interface. In Proc. IEEE Workshop on Applications of Computer [29] C. Yi and Y. Tian. Text string detection from natural scenes by structure-based
Vision, 1998. partition and grouping. IEEE Trans. IP, 2011.
[4] L. Breiman. Random forests. Machine Learning, 2001. [30] M. Zhao, S. T. Li, and J. Kwok. Text detection in images using sparse repre-
[5] J. F. Canny. A computational approach to edge detection. IEEE Trans. PAMI, sentation with discriminative dictionaries. IVC, 2010.
1986.You can also read