First measurements with the new 3He-filled Monoblock Aluminium Multitube neutron detector developed at the ILL for ANSTO PLATYPUS reflectometer
←
→
Page content transcription
If your browser does not render page correctly, please read the page content below
Journal of Neutron Research 23 (2021) 53–67                                                                                                53
DOI 10.3233/JNR-200179
IOS Press

First measurements with the new 3He-filled
Monoblock Aluminium Multitube neutron
detector developed at the ILL for ANSTO
PLATYPUS reflectometer
Luis Abuel a , Friedl Bartsch a , Andrew Berry a , Jean-Claude Buffet b , Sylvain Cuccaro b ,
Patrick van-Esch b , Bruno Guerard b , Stephen A. Holt a , Julien Marchal b,∗ , Paolo Mutti b ,
Kevin Ollivier b , Jerome Pentenero b , Martin Platz b , Adeline Robert b , Damien Roulier b and
James Spedding a
a Australian  Centre for Neutron Scattering, Australian Nuclear Science and Technology Organisation, New
Illawarra Road, Lucas Heights NSW 2234, Australia
b Institut Laue-Langevin, 71 avenue des Martyrs CS 20156, 38042 GRENOBLE Cedex 9, France

Abstract. A detector upgrade was carried out on the PLATYPUS instrument dedicated to neutron reflectometry at the Australian Nuclear
Science and Technology Organisation (ANSTO). The new detector, developed in the framework of a research collaboration between the ILL
and ANSTO, is based on the Monoblock Aluminium Multi-tube (MAM) detector design already in use on several reflectometers and SANS
instruments at the ILL. This article provides a technical description of the mechanical design and read-out electronics of the PLATYPUS de-
tector and its commissioning on the PLATYPUS instrument. The main detector performance parameters have been measured and are presented
here as well as the characterisation methods and the results of several reflectometry measurements. These measurements show an improvement
in experimental data quality resulting from high positional resolution, high detection efficiency and reduced neutron scattering background in
the 2.5–19 Å neutron wavelength range used in PLATYPUS instrument.
Keywords: Neutron detector, 3 He-based detector, gaseous detector, neutron reflectometry

1. Introduction

   Neutron reflectometry enables the study of both hard matter and soft matter phenomena and is integral in tack-
ling cutting-edge scientific problems. Neutron reflectometers require two-dimensional detectors combining both
high spatial resolution and high counting rate. The counting rate requirements are very challenging for the future
reflectometers instruments of the upcoming European Spallation Source, where 10 B detectors are currently being
built [12,13], based on the 10 B Multi-Blade detector concept [2]. However, the performance of 3 He detectors is ac-
ceptable for reflectometry experiments in most of the present neutron science facilities. Reflectometry experiments
are only marginally impacted by the cost fluctuation and scarcity of 3 He since they require a relatively low volume
of 3 He (typically around 15 litres) to provide high detection efficiency in the thermal neutron energy range over an
active area typically around 20 cm by 20 cm.
   Neutron detectors based on ZnS scintillators have a fast scintillation decay time component combined to a slower
decay time component of the order of several microseconds, whereas the signal development in a 3 He detector is
  * Corresponding author. E-mail: marchalj@ill.fr.

1023-8166 © 2021 – The authors. Published by IOS Press. This is an Open Access article distributed under the terms of the
Creative Commons Attribution-NonCommercial License (CC BY-NC 4.0).
54        L. Abuel et al. / First measurements with the new 3 He-filled Monoblock Aluminium Multitube neutron detector developed

ten times faster. Li-glass (GS20) scintillators which are also widely used for neutron detection have a very fast
decay time of the order of 50 ns but they are also sensitive to gamma rays. On the other hand, 3 He proportional
chambers provide both high counting rate and high neutron/gamma discrimination capabilities.
   At the ILL, for several years, reflectometry instruments such as FIGARO [4] and D17 [14] have benefited from
the fast response of two-dimensional position sensitive neutron detectors based on the Monoblock Aluminium
Multitube (MAM). Similar detectors, consisting of several Multitube blocks welded together to make larger detec-
tors, have also been installed on instruments dedicated to Small Angle Neutron Scattering (SANS) such as D33 [6]
at the ILL or PAXY and PA20 [5] instruments at the Léon Brillouin Laboratory (LLB).
   In these detectors, adjacent tubes are machined in a block of aluminium using wire electro-erosion; compared to
independent PSDs, these tubes can be fabricated with a smaller section (down to 5 mm pitch) and can be machined
side by side with high precision without the need for a complex mechanics to support them. These tubes are
usually machined with a rectangular section to enhance the detection efficiency and provide a uniform response
across each tube. The position measurement along the tubes being independent from one tube to the others, several
tubes can count simultaneous neutrons. This configuration and the simplicity of its design are the main advantages
of the Multitube. Other types of 3 He-based detectors structures, in particular Multi-Wire-Proportional-Chambers
or Microstrip detectors, are still considered for neutron reflectometry to overcome the limit of spatial resolution
resulting from the section of the tubes [1].
   PLATYPUS is a multipurpose Time-Of-Flight (TOF) neutron reflectometer situated on Cold Guide 3 at the
OPAL reactor at ANSTO [7,8,15]. For hard matter studies, PLATYPUS enables investigation of the properties of
magnetic materials, including determining the magnetisation of an iron monolayer or of a grain boundary in nickel.
PLATYPUS instrument also allows the study of interface roughness and magnetic direction across the interfaces
in computer hard-drive read-heads. For soft matter it enables the study of solid-liquid or air-liquid interfaces,
including the self-assembly of silicate structures at air-water surfaces, or of the nature and properties of lung
surfactants and proteins in membranes.
   PLATYPUS was designed with a horizontal sample plane to enable the study of free liquid, solid surfaces and
interfaces. This is coupled with a neutron polarisation and analysis system for investigations of magnetic structures.
Scattering from free liquid surfaces is achieved via the use of supermirrors to deflect incoming neutron beam down
onto the liquid surface, for which two configurations are possible: a double bounce system with fixed deflection
angle; and a single bounce mirror mounted on a rotation stage for low angle incident data. For solid interfaces,
a sample table on top of a goniometer controls the incident angle and allows positive or negative angles with
the outgoing beam being reflected above or below the horizontal respectively. In all cases, standard practice is to
track the position of the reflected beam on the detector by means of a height stage such that the beam is always
incident in the same region of the detector. The PLATYPUS instrument’s scientific research highlights include
investigating plasma-polymer coatings for biopassivation, Titania nanoclusters embedded in polymer matrices and
a commercial Ni-Ti multilayer system. The detector used during the experiments producing these scientific research
highlights was a 2-dimensional MWPC 3 He detector which produced high-quality data for many years since its
commissioning on the instrument in 2006 [8].
   In 2016, a research collaboration between ILL and ANSTO was set-up to upgrade PLATYPUS instrument with
a new detector based on MAM concept and fabrication techniques. This project led to the fabrication of a MAM
detector with a configuration adapted to the mechanical constraints of PLATYPUS instrument.

2. PLATYPUS MAM detector

   The PLATYPUS MAM detector was designed to operate inside the large vacuum tank of the reflectometer
instrument at ANSTO. The PLATYPUS detector system consists of three parts:
     • a Monoblock Aluminium Multitube detector head filled with 3 He
     • a vacuum tight mechanical enclosure hosting the air-cooled front-end electronics
L. Abuel et al. / First measurements with the new 3 He-filled Monoblock Aluminium Multitube neutron detector developed 55
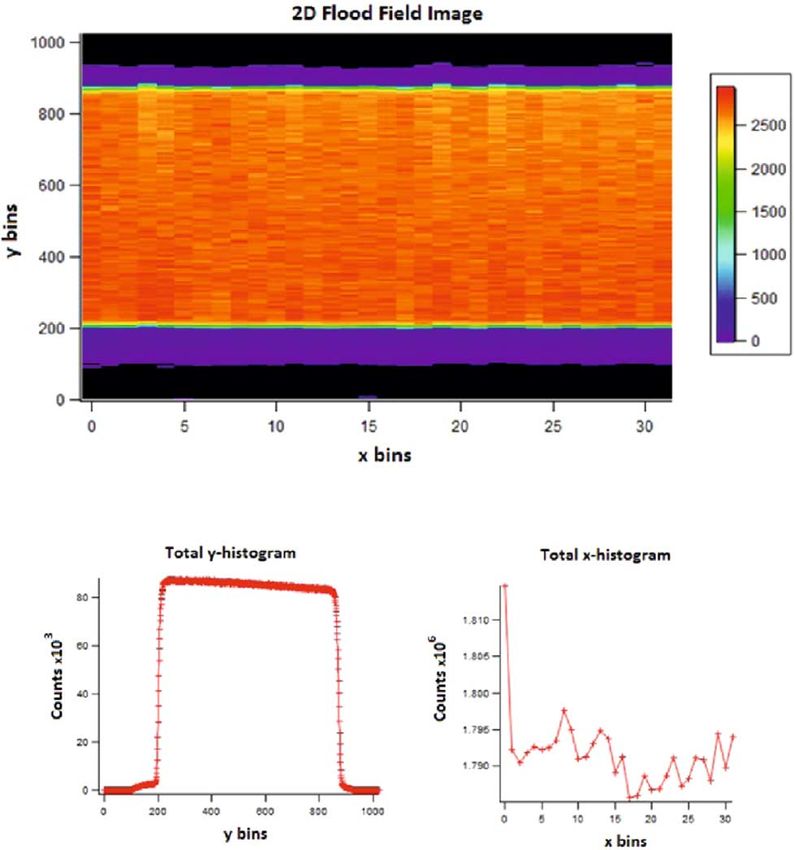
Fig. 1. Photograph of the PLATYPUS MAM detector system showing the 3 He-filled detector head (a) and the front-end electronics enclosure
(b).
• back-end electronics located outside the vacuum tank and integrated in the data acquisition system of the
instrument
The detector head is bolted onto the front of the electronics enclosure as shown in Fig. 1. The total weight of the
detector is 120 kg and the overall dimensions are 60 cm (width) × 65 cm (height) × 45 cm (depth). The detector
head vessel itself contains 64 adjacent vertical tubes (at a pitch of 5 mm), operated as standard gas proportional
counters. These tubes are gathered in 2 adjacent sectors of 32 tubes. Only one 32-tubes sector is operated, the other
one serving as a spare. The two sectors share the same gas volume and only one sector is powered at a time even if
both sectors are always equipped with their independent read-out electronics. The spare sector is available so that
in case of a fault with the main sector, it is possible to translate laterally the detector inside the vacuum tank and
power-up the spare sector. The active area of one sector covers 16 cm horizontally by 21 cm vertically.
For each neutron interacting with the detection gas, the front-end electronics compute the coordinates of the
interaction point and record the timestamp of the interaction, allowing neutron time-of-flight studies. A fibre optic
link is used to transfer detector data from the front-end electronics to the acquisition system located at several tens
of meters of the detector which can be moved along a 1 meter range inside the 3.5-meter long vacuum tank of
PLATYPUS instrument.
In the axis of the tubes the spatial resolution of 1.5 mm is determined by the pressure of the stopping gas
(ArCO2 ) and the signal processing technique (resistive charge-division along anode wires) whereas the resolution
in the direction orthogonal to the tubes is defined by the tube width of 5 mm.
The main characteristics of PLATYPUS detector are summarised in Table 1 and more details regarding the
mechanical and electronics read-out design of the detector are given in the next sections.
2.1. Mechanical design
2.1.1. Detector head
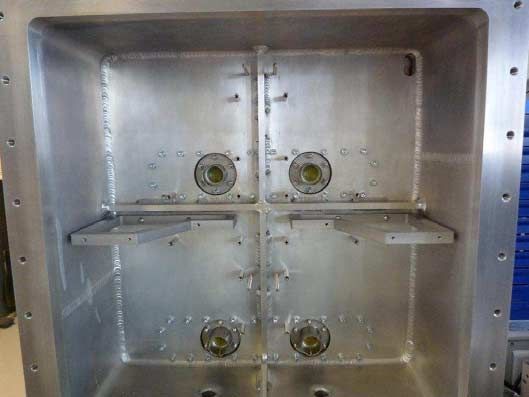
The detector head in Fig. 2(a) consists of a vessel body (aluminium block inside which 64 adjacent tubes have
been machined) covered by two aluminium plates used to seal the gas volume shared by these 64 tubes. The gas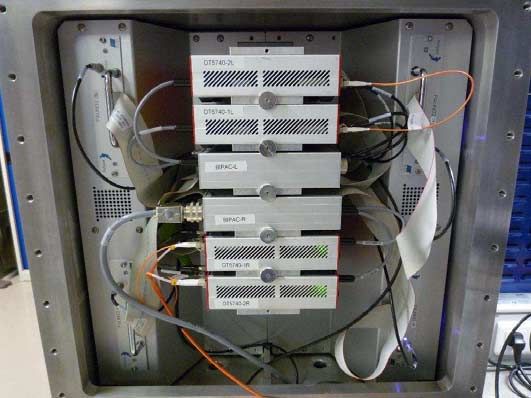
56 L. Abuel et al. / First measurements with the new 3 He-filled Monoblock Aluminium Multitube neutron detector developed
Table 1
Specifications of PLATYPUS MAM detector
Gas mixture 3 He (10 bar) and ArCO (5 bar)
2
Active area 21 cm (height) × 16 cm (width) per detector sector
Spatial resolution 5 mm (hor.) × 1.5 mm (vert.)1
Detection efficiency 66% for 2Å neutrons
Number of tubes 32 per detector sector
Tube internal section 4.5 mm (hor.) × 7.5 mm (depth)
Overall dimensions 60 cm (width) × 65 cm (height) × 45 cm (depth)
Detector head volume 1.5 litres (for the 2 detector sectors)
1 The spatial resolution in the vertical direction is determined by the charge-division electronics. Details on spatial resolution measurements are
given in Section 3.2
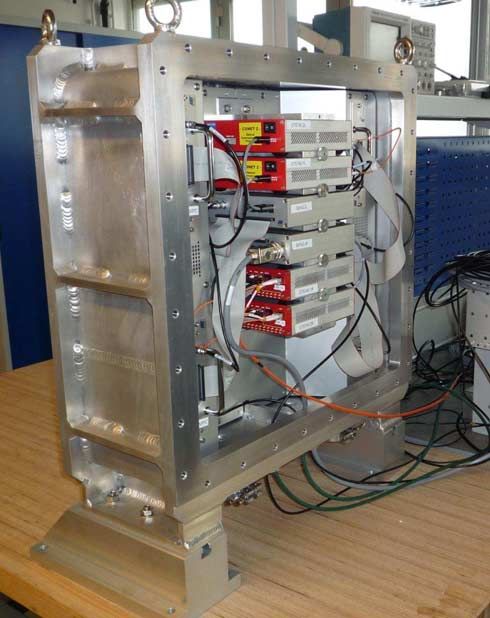
Fig. 2. (a) Photograph of the detector head showing the vessel body (b) adjacent tubes machined inside the vessel body (c) cross-sectional view
of the vessel body showing the dimensions of the tubes.
tightness of the detector head is provided by means of metallic gaskets inserted in grooves machined on the surface
of the 2 aluminium covers.
The 64 square tubes which were spark-eroded in the aluminium block are shown in Fig. 2(b). These tubes are
21 cm long with a rectangular section of 7.5 mm × 4.5 mm and a separation of 0.5 mm between them, as illustrated
in Fig. 2(c). A metallic (anode) resistive wire (not shown in Fig. 2(b)) is stretched inside each tube and the two
extremities of each wire are soldered onto a polyimide circuit connecting them electrically to custom multi-pin
high-voltage feedthroughs developed for high-pressure applications. During operation a positive voltage of around
2kV is applied to the anode wires in order to amplify (by electron avalanche multiplication) the charge resulting
from the neutron interaction process in the detection gas. These electrical signals are transferred via the multi-pin
feedthrough directly to the front-end electronics located at the back of the detector head.
The 1.5 litres detector head vessel is designed to operate at a maximum (absolute) pressure of 15 bar. Finite
element modelling was performed to confirm that this vessel complies with the European Pressure Equipment
Directive 2014/68/EU. The detector head was filled to 15 bar at room temperature with a partial pressure of 10 bar
of 3 helium, 4.9 bar argon and 0.1 bar of CO2 . A mixture of argon and CO2 was selected as the stopping gas.
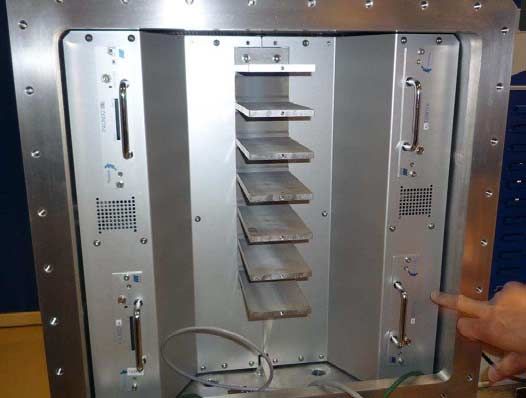
2.1.2. Front-end electronics enclosure
In previous versions of MAM detector systems developed at the ILL, analogue signals produced at the output of
pre-amplifiers located in the front-end electronics enclosure were transferred to signal digitisation and processing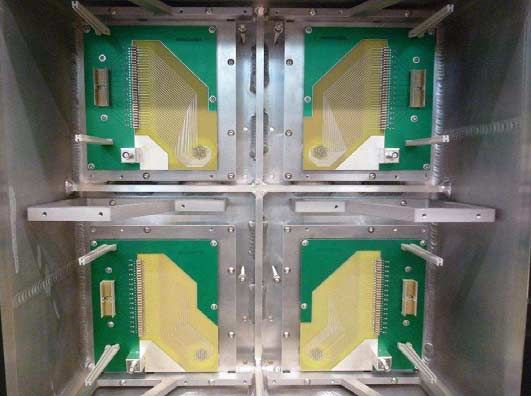
L. Abuel et al. / First measurements with the new 3 He-filled Monoblock Aluminium Multitube neutron detector developed   57

modules located in the back-end acquisition system, via individual coaxial cables or RJ45 cables. In the PLATY-
PUS detector system, cable management was simplified by integrating the signal digitisation and processing units
in the front-end electronics enclosure and transferring data via a fibre link to the back-end electronics. However,
this approach requires the design of a larger enclosure and also leads to additional power dissipation requirements
(50W to be dissipated in the electronics enclosure instead of 2W for 32 tubes).
   A large aluminium vessel 60 cm (width) × 65 cm (height) × 30 cm (depth) was manufactured to mount the var-
ious front-end electronics boards (described in the next section) performing signal pre-amplification, digitisation
and processing. The electronics enclosure is located in the vacuum tank of the instrument and cooling-air is circu-
lated inside the enclosure at a pressure slightly above the atmospheric pressure. During operation, the temperature
of the FPGA boards located in the digitizers and monitored by the read-out software stabilises at 50°C and the
temperature of the thermocouple mounted onto the digitizer heatsink stabilises at 40°C.
   High-vacuum flanges were welded on the electronics enclosure for air-cooling pipes connection, electrical cables
and the fibre-optic data link. A large plate can be unbolted at the back of the enclosure to facilitate maintenance
work on the front-end electronics. Vacuum tightness is obtained by means of FPM o-ring gaskets and KF-standard
feedthroughs. A 75 mm-thick polyethylene block covered on both sides by a 5 mm-thick boron-loaded elastomer
sheet (50% SBR/50% boron carbide) is mounted between the detector head and the electronics enclosure to prevent
backscattering of neutrons into the detector tubes and to shield the electronics.

2.2. Read-out electronics

   One of the main features of the PLATYPUS design compared to MAM systems installed previously at ILL or
LLB is the integration of the digitising units in the front-end electronics located inside the vacuum tank of the
instrument. This has the advantage of reducing the number of air-filled pipes which have to be routed along the
movable detector inside the vacuum tank.
2.2.1. Front-end electronics
  Each 32-tube sector of the detector is equipped with its own front-end electronics including the following com-
ponents:
  • Two decoupling boards (Fig. 3(b)): These boards connect directly to the multi-pin high-voltage feedthrough
    of the detector head (Fig. 3(a)). They are used to apply High-Voltage to anode wires and to decouple fast
    signals pulses from the high-voltage DC signal.
  • Two pre-amplification boards (Fig. 3(c)): 8-layer 32 channel PreAmp boards with UNIpolar outputs (PAUNI)
    have been designed for this project. They provide 32 charge-sensitive amplifiers with transimpedance gain of
    1V/pC and 32 unipolar voltage drivers matching the 2V input range of the digitizers.
  • Two digitizers (Fig. 3(d)): The digitization and processing of neutron-induced pulses produced on both sides
    of each detector tube are performed by CAEN DT5740-D digitizers.1 The DT5740-D is a 32 Channel 12 bit
    62.5 MS/s Desktop Waveform Digitizer with 2 Vpp single ended input dynamics on ERNI SMC connectors.
    The DT5740-D FPGA firmware was modified by ILL to meet the requirements of the resistive charge division
    technique used at the ILL [16]. This processing includes digital filtering of the pre-amplified signals produced
    on both ends of each tube, calculation of the positional information (neutron interaction point along the wire)
    and transmission of this positional information together with a 48-bit event timestamp. The digital filter takes
    12-bit ADU values and outputs 16-bit filtered signal values. A 16-bit detection threshold, adjusted according
    to the procedure described in Section 3.6, is applied to the sum of the two filtered signals from each tube
    (“A + B”). The two DT5740-D house USB 2.0 and Optical Link interfaces. The Optical Link, supporting
    transfer rate of 80 MB/s, is daisy-chained across the two digitizers to transfer data signals to the back-end
    electronics.
  1 https://www.caen.it/products/dt5740/
58           L. Abuel et al. / First measurements with the new 3 He-filled Monoblock Aluminium Multitube neutron detector developed

Fig. 3. Front-end electronics at various assembly stages: (a) electronics enclosure with HV feedthroughs, (b) decoupling boards connnected
to the HV feedthroughs, (c) pre-amplification cards connected to the decoupling boards, (d) digitizers and interface boards mounted in the
enclosure.

     • An interface board (Fig. 3(d)): The BIPAC (Box Interface for PAuni board and Caen DT5740 board) dis-
       tributes power, clock and gate signals to the various boards and reroute the outputs of the pre-amplification
       boards so that signals produced at both ends of a tube are connected to the same digitizer, since each 32-
       channel digitizer can process the 16 pairs of signals (top and bottom) produced by 16 tubes.
2.2.2. Back-end electronics
   Data read-out is performed by a CAEN PCI-E connect controller A3818B2 with CONNECT 2 CAEN propri-
etary protocol. The controller A3818B is a 32-bit 33 MHz PCI-E card, which allows the control, through a standard
PC, of up to 8 CAEN Optical Slave Cards per optical link. The 2 DT5740-D digitizers are continuously processing
and transmitting neutron position and timestamp data from the 32 tubes. Neutron events data are coded over 3
words of 32 bits including 48 bits for the timestamp, 16 bits for the pulse height at one side of the tube (“A”), 16
bits for the sum of the pulse heights at both sides of the tube (“A + B”), 4 bits for the tube number and some extra
bits for the status of various acquisition system flags. The back-end electronics decodes the data and uses the “A”
an “A + B” information to calculate the neutron interaction position (A/A + B) along the tube, and re-bins it into
1024 pixels.
   The data are transferred via a 80 MB/s fibre optic link and the DAQ system can handle sustained transfer rates
up to 500 Mbit/s corresponding to a count-rate of ∼5 MHz with 96-bits events and data packets overheads (tested
with a pulse generator). During the tests with neutrons, global count rates up to 500 kHz were reached without any
limitation or dead-time introduced by the DAQ system.
     2 https://www.caen.it/products/a3818/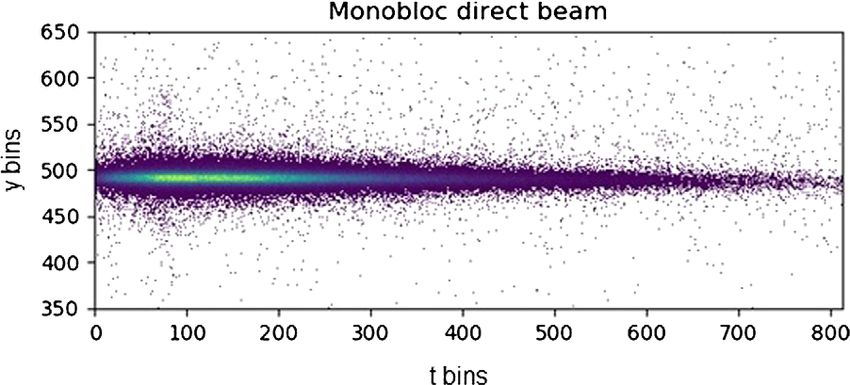
L. Abuel et al. / First measurements with the new 3 He-filled Monoblock Aluminium Multitube neutron detector developed   59

   In order to synchronise the acquisition with other equipment such as beam choppers or monitors, a TTL Gate
signal is sent to the digitizers and a flag is set to 1 in the data when the Gate signal level is high.
2.2.3. Acquisition control
   Experiment and acquisition control is performed by the Histogram Memory Server (HMS) which was custom-
built at ANSTO within the GumTree integrated scientific experiment environment [9]. A custom device driver was
written to integrate the A3818B PCI-E card with the HMS, enabling the HMS to configure the two DT5740-D
digitizers and accept or ignore the continuously streamed neutron data. The time, position, energy and gate data
from neutron pulses are then stored in arrays and made available for data reduction.

3. PLATYPUS detector characterisation with neutrons

   The performance of PLATYPUS detector was evaluated with neutrons on CT2 test instrument which has been
used at ILL to characterize various types of detector technologies [3,11]. The beam of neutrons with 2.5 Å wave-
length was produced with a Highly Oriented Pyrolytic Graphite monochromator. Sintered B4C slits were used to
define the size of the neutron beam and the neutron flux was varied by inserting various PMMA sheet in front
of the slits. The next sections describe the experimental method and the results obtained when measuring various
detector performance parameters.

3.1. Image uniformity and background counts

   A PMMA sheet was used to scatter the main neutron beam to produce a uniform illumination on the detector
and acquire a flat-field image. This flat-field image shown in Fig. 4(a) was projected along each dimension of the
detector in Fig. 4(b) and (c). The uniformity of the detector response obtained across tubes is better than +/−0.3%.
It can also be noted in Fig. 4(b) that the illumination used for this flat-field measurement was not perfectly uniform
(slope visible between bins 200–900). This is because the flat-field illumination was performed with a water sample
producing 4π scattering and the detector was raised vertically out of the direct beam, meaning that the effect of
the solid-angle on the uniformity of the flat-field illumination was more important in the vertical direction. Images
were also acquired without neutron beam to confirm the absence of spurious signal pulses and confirm that the
signal discrimination threshold settings of the detection channels were high enough to suppress the electronics
noise of pre-amplification channels. These background images acquired during a reactor shutdown period at ILL
resulted in a background count-rate below 1 Hz per sector of 32 tubes.

3.2. Spatial resolution

   The spatial resolution of the detector was measured by acquiring images of 0.5 mm slits machined in a cadmium
mask mounted between two aluminium plates. The mask mounted on the detector front window is shown in Fig. 5
(the 0.7 mm cadmium sheet was inserted between 2 plates of aluminium so that high precision could be achieved
when machining the slits). Gaussian fitting was applied to the images obtained at a high-voltage of 2250V and
resulted in a measured spatial resolution of 1.5 mm FWHM after deconvolving the 0.5 mm width of the slits. This
value corresponds to the theoretical spatial resolution expected for the pressure (5 bar) of the stopping gas (ArCO2 )
in the detector [10]. The small offset (
60        L. Abuel et al. / First measurements with the new 3 He-filled Monoblock Aluminium Multitube neutron detector developed

Fig. 4. (a) A two-dimensional flood-field image acquired on the PLATYPUS instrument showing uniform illumination and response from the
detector; (b) a histogram of all tubes showing uniform y-directional response from the detector; (c) a histogram across all bins showing a
uniform response from each tube in the detector. A slightly elevated response in tube 0 is caused by reflection from the metallic detector lip.

3.3. Gain uniformity

   The height of neutron-induced pulses produced on both sides of the tubes is recorded by the digitizers in order
to calculate the position of the neutron interaction point. The output data of the digitizers contains not only the
calculated position but also the pulse heights, allowing for pulse-height spectra to be plotted for each tube by the
acquisition system. These spectra can be used to check the uniformity of the amplification gain between tubes.
Pulse-height spectra obtained under flood-field illumination of the detector with 2.5 Å neutrons resulted in a max-
imum gain deviation of 2% across the 32 tubes of the detector. It should be noted that in all the measurements
presented in this paper as well as when the detector is in operation on PLATYPUS instrument, the same detection
threshold is applied to the 32 channels even if it is possible to upload individual thresholds for each channel to
correct any strong gain variation between channels. However this is not necessary to use this feature of the acquisi-
tion set-up because of the good uniformity between amplification gains observed on the PLATYPUS detector. This
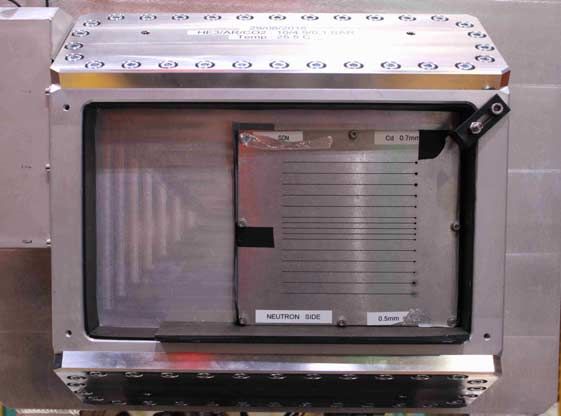
L. Abuel et al. / First measurements with the new 3 He-filled Monoblock Aluminium Multitube neutron detector developed         61

Fig. 5. (a) Cadmium slit-mask used to measure the spatial resolution of the detector in the vertical direction; (b) example of Gaussian fits
performed on the position data obtained on one tube behind the cadmium mask.

gain uniformity results from the high mechanical precision achieved by the wire electro-erosion technique used to
machine the tubes in the vessel body and the precision achieved in stretching and crimping anode wires along the
central axis of each tube.

3.4. Count rate linearity

   In gas-filled proportional chambers, the linearity of the counting response can be affected by signal pile-up
effects or by space-charge effects occurring when a high neutron flux is localised on a small region of the detector.
The second effect should be dominant when the counting rate on one tube does not exceed 50 kHz, which is the
case for most reflectometry experiments. To investigate the space-charge effect, the detector was exposed to a 1 cm-
high neutron beam covering 10 tubes. This narrow beam was obtained using a pair of cadmium slits collimating
the direct beam and 2-dimensional images were acquired for various thicknesses of PMMA attenuators.
   The measured count-rate was plotted as a function of attenuator thickness in Fig. 6 and a linear count-rate was
observed up to 20 kHz per tube obtained without any attenuators. This local count-rate of 40 kHz/cm2 achieved
without significant count loss (
62        L. Abuel et al. / First measurements with the new 3 He-filled Monoblock Aluminium Multitube neutron detector developed

Fig. 6. Count-rate linearity measurement: (a) individual tube count-rate as a function of attenuator thickness. (b) Linear fit to the data in log
scale, excluding the points corresponding to high attenuator thickness (with low counting statistics).

offset variations between electronics channels and additional resistances present at both ends of the tubes, due the
electrical connections. These effects lead to a distortion of the 2-dimensional image as shown in the uncalibrated
image in Fig. 7.
   Image distortion is corrected by computing gain and offset correction coefficients for each tube. These coeffi-
cients are applied to neutron position data in the digitizer firmware. The accuracy of the geometrical correction was
investigated by using a cadmium calibration mask consisting of a central slit (5 mm wide) between 2 edges located
at 53 mm from the central slit. On the image of Fig. 7(a), the pixel position corresponding to the top edge and the
pixel position corresponding to the bottom edge of the mask are calculated for each tube. Knowing the physical
distance between these two positions (106 mm in our case), it is possible to compute the 2 coefficients required for
linear correction of the position data. Figure 7(b) shows the mask image after correction. One way of confirming
that this linear correction is effective consists in plotting the position of the central slit (which was not used for
the calculation of the correction coefficients) before and after correction. The maximum position error (maximum
distance between the measured slit position and the physical slit position half way between top and bottom edges)
is reduced from 3.5 mm (no correction) to 0.4 mm (after correction).

3.6. Gamma-ray rejection

   Gamma-ray rejection could not be measured precisely on CT2 test instrument. However spectra recorded during
the threshold adjustment procedure, described below, show that at the recommended HV, the detection threshold
can be set in the valley of the Pulse Height Spectrum between gamma-ray pulse heights and neutron pulse heights,
indicating that the detector benefits fully from the advantage of 3 He-based detectors in terms of gamma-ray rejec-
tion.
   Threshold adjustment was performed by plotting Pulse Height Spectra for various thresholds values as shown
in Fig. 8. The threshold value was increased by steps of 500 ADUs via the acquisition software at the operating
voltage of 2150V. The plots show the valley between gamma rays and neutron pulse heights which is characteristic
of 3 He-filled detectors. The detection threshold was set at the centre of this valley. This corresponds to a threshold
of 3700 ADUs at a HV of 2150V and optimum digital filter settings. The same method was used to determine the
optimum threshold of 2700 ADUs at the higher HV of 2250V corresponding to an improved spatial resolution of
1.5 mm FWHM.
L. Abuel et al. / First measurements with the new 3 He-filled Monoblock Aluminium Multitube neutron detector developed           63

Fig. 7. Position linearity correction: (a) uncalibrated mask image; (b) mask image after applying linear correction coefficients obtained with
top and bottom edge positions; (c) position error reduction observed on central slit image after linear correction.

Fig. 8. Threshold adjustement: (a) pulse height spectra recorded at various threshold settings for HV = 2150 V; (b) close-up view showing the
valley between gamma-ray and neutron pulse heights in the spectra.
64        L. Abuel et al. / First measurements with the new 3 He-filled Monoblock Aluminium Multitube neutron detector developed

                            Fig. 9. A time of flight histogram showing reflection data from a plain silicon wafer.

Fig. 10. Vertical position versus time response for the neutron pulse, as measured by the new Monoblock Aluminium Multitube detector. The
y-axis represents approximately half the detector y-range.

4. Experimental data from PLATYPUS instrument

   First reflection experiments were performed to demonstrate the data quality of the new PLATYPUS detector,
using neutrons from the OPAL reactor’s CG3 cold neutron beam, while rotating choppers and collimating slits
were used to create a pulsed, collimated neutron spectrum. Figure 9 shows a time of flight histogram of neutron
reflection data from a plain silicon wafer, acquired with the MAM detector. On this image, the upper line represents
the reflected beam, while the lower line represent the direct beam transmitted through the silicon sample. Finally,
the slightly curved line between the two shows the refracted beam.
   The high spatial resolution (1.8 mm in the vertical direction) of the MAM detector combined to its high tim-
ing resolution result in a very precise y-registration of events. This positional and timing resolution is illustrated
in Fig. 10, plotting the vertical position of neutron events versus their timestamp while the MAM detector was
illuminated with the direct beam on PLATYPUS instrument.
   Comparative datasets were collected on a multilayer Bragg mirror film consisting of 25 bilayers of Ni and Ti
deposited on float glass under the same conditions with the MWPC detector and then the MAM detector. These
L. Abuel et al. / First measurements with the new 3 He-filled Monoblock Aluminium Multitube neutron detector developed 65 Fig. 11. (a) Data collected on the PLATYPUS instrument using the previous MWPC detector and the new MAM detector (the two dataset were offset for clarity). Reflection data are from a multilayer Bragg mirror film consisting of 25 bilayers of Ni and Ti deposited on float glass. (b) Close-up view on the lower Q region corresponding to longer wavelengths (no offset). (c) Close-up view on the higher Q region corresponding to shorter wavelengths (no offset). runs consisted of the final and first datasets collected on each detector respectively. Data was collected at three incident angle settings, 0.8, 3.4 and 5.0 degrees. Direct beams through air were recorded for each angle with instrument settings corresponding to that for the data collection. Data was reduced using the Slim package which essentially divided the reflected data through by the direct beam spectrum and rebinned to the defined instrument resolution. Individual angles were then stitched together into a final single dataset. Figure 11(a) shows the full Q range with the datasets offset for clarity. The agreement between datasets appears to be very good. Closer inspection though reveals some variations at low and high Q values. In Fig. 11(b) it can be
66         L. Abuel et al. / First measurements with the new 3 He-filled Monoblock Aluminium Multitube neutron detector developed

                                                                   Table 2
                                        Detector/monitor count rates ratio as a function of detector type
Detector   Angle    Collection   Time (s)   Detector Counts     Monitor Counts     Detector (counts/s)      Monitor (counts/s)   Detector/Monitor
MWPC         0.8    Reflection    600           3.75E+06           4.74E+06            6.25E+03                 7.91E+03            7.90E–01
MWPC         3.4    Reflection   3600           4.81E+06           5.51E+07            1.34E+03                 1.53E+04            8.73E–02
MWPC         5      Reflection   9921.8         2.48E+06           1.52E+08            2.50E+02                 1.53E+04            1.63E–02
MAM          0.8    Reflection    600           8.58E+06           4.47E+06            1.43E+04                 7.46E+03            1.92E+00
MAM          3.4    Reflection   1800           5.24E+06           2.56E+07            2.91E+03                 1.42E+04            2.04E–01
MAM          5      Reflection   3600           2.46E+06           5.11E+07            6.83E+02                 1.42E+04            4.81E–02

seen that there is excellent agreement above the critical edge but that there is a divergence in the datasets below this
position where the data from the MAM detector is flat but the data from the MWPC detector slopes down slightly.
The beam footprint was much smaller than the sample size so the slightly lower reflectivity at the critical edge is
not an artefact from data collection. It may be due to the absorption or scatter of long wavelength neutrons by the
thicker window on the MWPC detector. At high Q values, in Fig. 11(c), it can be seen that the MAM dataset has an
inherently lower background and better defined peaks at the higher Q values. This region of the data is determined
by the shorter wavelength neutrons where the MAM detector has a significantly higher detection efficiency.
   When one examines the number of counts and counting time for the data presented in Fig. 9 greater differences
in performance become apparent. Table 2 presents the total counts and counting time for both detectors when
reflection data were collected. In all cases the same slits sizes were used for the same angles. It can be noted
that there is some small variation in monitor counts where the data collection times are equivalent, this is due to
variations in reactor power as the data were collected in different cycles. The same monitor is used for all data
collections. Despite the MAM detector counting for less than half the time, the statistics at high Q (5° angle) are
comparable with lower inherent background. It can be seen from the table that the detector count rate (in counts
per second) from low to high angle is 6.25E+03, 1.34E+03 and 2.50E+02 for the MWPC whereas for the MAM
detector the same configuration results in count rates of 1.43E+04, 2.91E+03 and 6.83E+02 more than double that
observed for the MWPC detector. The final column of the table lists the ratio of detector to monitor counts which
will correct for variations in reactor power between the different cycles. For the MWPC we see ratios of 7.90E–01,
8.73E–02 and 1.63E–02 versus 1.92E+00, 2.04E–01 and 4.81E–02 for the MAM suggesting a performance ratio
of ca 2.4.

5. Conclusion

   A new Monoblock Aluminium Multitube detector has been developped for the PLATYPUS reflectometer at
ANSTO. The mechanical design of the front-end detector is based on the concept of rectangular position-sensitive
proportional tubes precisely machined side by side in a single block of aluminium. This concept has already
been used in several reflectometry detectors at ILL as well as several SANS detectors in various reactor-based
neutron research organisations. The geometry of the detector was adapted to the requirements of the PLATYPUS
instrument. At the detector High-Voltage used on PLATYPUS instrument, the detector provides a spatial resolution
of 1.8 mm in the vertical direction along the detection tubes and 5 mm in the direction perpendicular to the tubes.
A higher spatial resolution down to 1.5 mm in the vertical direction was also achieved at a higher High-Voltage.
The overall mechanical design was optimised to fit the existing detector support inside PLATYPUS vacuum tank.
The read-out electronics of this detector includes a signal processing stage based on commercial digitizers with
custom firmware. These digitizers are mounted in an air-cooled electronics enclosure located at the back of the
detector front-end, inside the PLATYPUS vacuum tank. The first reflectometry experiments performed at ANSTO
with the new MAM detector demonstrated a high signal to background ratio of reflected data resulting from the
high detection efficiency and the thin aluminium entrance window of the MAM detector.
L. Abuel et al. / First measurements with the new 3 He-filled Monoblock Aluminium Multitube neutron detector developed 67
Acknowledgements
The authors are grateful to Isabelle Petit and Lilian Pereira Bahia from the ILL who supervised administrative
aspects of this research collaboration between the two neutron science institutes. We thank Valerie Brachet for
supervising the packaging and shipment of the detector system from ILL to ANSTO. The expertise of Jérôme
Locatelli from ILL was very much appreciated when setting-up the linux-based environment of the detector data
acquisition system at the start of the project. ANSTO is grateful to Kenneth Kwok for developing the CAEN device
driver that enabled the new hardware to be integrated into ANSTO’s existing data acquisition software, and is also
especially grateful to Andrew Nelson, Anton LeBrun and the ACNS Electrical and Mechanical technicians for
their careful and professional installation of the new MAM detector.
References
[1] https://sine2020.eu/about/the-road-to-ess/msgcs.html.
[2] J.C. Buffet et al., Study of a 10B-based Multi-Blade detector for neutron scattering science, IEEE Nucl. Sci. Symp. Med. Im. Conf. Rec.
171 (2012).
[3] J.C. Buffet et al., Characterisation of a neutron diffraction detector prototype based on the Trench-MWPC technology, JINST 12 (2017),
C12009.
[4] R.A. Campbell, H.P. Wacklin, I. Sutton, R. Cubitt and G. Fragneto, Eur. Phys. J. Plus 126 (2011), 107. doi:10.1140/epjp/i2011-11107-8.
[5] G. Chaboussant et al., PA20: A new SANS and GISANS for soft matter, material and magnetism, J. of Physics: Conference Series 340
(2012), 012002.
[6] C. Dewhurst et al., The small-angle neutron scattering instrument D33 at the Institut Laue Langevin, J. Appl. Cryst. 49 (2016), 1–14.
doi:10.1107/S1600576715021792.
[7] M. James, A. Nelson, A. Brule and J.C. Schulz, PLATYPUS: A time-of-flight neutron reflectometer at Australia’s new research reactor,
J. Neutron Res. 14 (2006), 91–108. doi:10.1080/10238160500472688.
[8] M. James, A. Nelson, S.A. Holt, T. Saerbeck, W.A. Hamilton and F. Klose, The multipurpose time-of-flight neutron reflectometer PLATY-
PUS at Australia’s OPAL reactor, Nuclear Inst. and Methods in Physics Research A 632 (2011), 112–123. doi:10.1016/j.nima.2010.12.
075.
[9] T. Lam et al., GumTree – an integrated scientific experiment environment, Phys. B: Condensed Matter 385–386 (2006), 1330–1332.
doi:10.1016/j.physb.2006.06.069.
[10] A. Oed, Detectors for thermal neutrons, Nucl. Instr. Meth. Phys. Res. A 525 (2004), 62–68. doi:10.1016/j.nima.2004.03.025.
[11] F. Piscitelli, Novel boron 10-based detectors for neutron scattering science, Eur. Phys. J. Plus 130 (2015), 27.
[12] F. Piscitelli et al., Study of high spatial resolution 10 B-based thermal neutron detector for application in neutron reflectometry: The
Multi-Blade prototype, JINST 9 (2014), P03007.
[13] F. Piscitelli et al., Characterisation of the Multi-Blade 10B-based detector at the CRISP reflectometer at ISIS for neutron reflectometry at
ESS, JINST 13 (2018), P05009.
[14] T. Saerbeck et al., Recent upgrades of the neutron reflectometer D17 at ILL, J. Appl. Cryst. 51 (2018), 249–256. doi:10.1107/
S160057671800239X.
[15] T. Saerbeck, F. Klose, A.P. Le Brun, J. Füzi, A. Brule, A. Nelson, S.A. Holt and M. James, Polarization “down under”: The polarized
time-of-flight neutron reflectometer PLATYPUS, Rev. Sci. Instrum. 83 (2012), 081301. doi:10.1063/1.4738579.
[16] P. Van Esch et al., Design criteria for electronics for resistive charge division in thermal neutron detection, Nucl. Instr. Meth. Phys. Res. A
526 (2004), 493–500. doi:10.1016/j.nima.2004.02.024.You can also read