Developing an Integrated Ocean Observing System for New Zealand
←
→
Page content transcription
If your browser does not render page correctly, please read the page content below
MINI REVIEW
published: 26 March 2019
doi: 10.3389/fmars.2019.00143
Developing an Integrated Ocean
Observing System for New Zealand
Joanne O’Callaghan 1* , Craig Stevens 1,2 , Moninya Roughan 3,4 , Chris Cornelisen 5 ,
Philip Sutton 1,6 , Sally Garrett 7 , Giacomo Giorli 1 , Robert O. Smith 8 , Kim I. Currie 1,9 ,
Sutara H. Suanda 10 , Michael Williams 1 , Melissa Bowen 2,6 , Denise Fernandez 1 ,
Ross Vennell 5 , Benjamin R. Knight 5 , Paul Barter 5 , Peter McComb 10 , Megan Oliver 11 ,
Mary Livingston 12 , Pierre Tellier 13 , Anna Meissner 14 , Mike Brewer 1 , Mark Gall 1 ,
Scott D. Nodder 1 , Moira Decima 1 , Joao Souza 4 , Aitana Forcén-Vazquez 4 ,
Sarah Gardiner 4 , Kura Paul-Burke 1 , Stephen Chiswell 1 , Jim Roberts 1 , Barb Hayden 1 ,
Barry Biggs 1 and Helen Macdonald 1
1
Edited by: National Institute of Water and Atmospheric Research (NIWA), Auckland, New Zealand, 2 Department of Physics,
John Siddorn, The University of Auckland, Auckland, New Zealand, 3 School of Mathematics and Statistics, University of New South Wales,
Met Office, United Kingdom Sydney, NSW, Australia, 4 MetService, Wellington, New Zealand, 5 Cawthron Institute, Nelson, New Zealand, 6 School
of Environment, The University of Auckland, Auckland, New Zealand, 7 New Zealand Defence Force (NZDF), Wellington,
Reviewed by:
New Zealand, 8 Department of Marine Science, University of Otago, Dunedin, New Zealand, 9 Department of Chemistry,
Jun She,
University of Otago, Dunedin, New Zealand, 10 MetOcean Solutions Ltd., New Plymouth, New Zealand, 11 Greater Wellington
Danish Meteorological Institute (DMI),
Regional Council, Wellington, New Zealand, 12 Ministry for Primary Industries, Wellington, New Zealand, 13 Ministry
Denmark
for the Environment, Wellington, New Zealand, 14 Land Information New Zealand, Wellington, New Zealand
James Richard Fishwick,
Plymouth Marine Laboratory,
United Kingdom New Zealand (NZ) is an island nation with stewardship of an ocean twenty times
*Correspondence: larger than its land area. While the challenges facing NZ’s ocean are similar to other
Joanne O’Callaghan
joanne.ocallaghan@niwa.co.nz maritime countries, no coherent national plan exists that meets the needs of scientists,
stakeholders or kaitiakitanga (guardianship) of NZ’s ocean in a changing climate. The NZ
Specialty section: marine science community used the OceanObs’19 white paper to establish a framework
This article was submitted to
Ocean Observation, and implementation plan for a collaborative NZ ocean observing system (NZ-OOS). Co-
a section of the journal production of ocean knowledge with Māori will be embedded in this national strategy for
Frontiers in Marine Science
growing a sustainable, blue economy for NZ. The strengths of an observing system for
Received: 16 November 2018
Accepted: 06 March 2019
a relatively small nation come from direct connections between the science impetus
Published: 26 March 2019 through to users and stakeholders of an NZ-OOS. The community will leverage off
Citation: existing ocean observations to optimize effort and resources in a system that has
O’Callaghan J, Stevens C, historically made limited investment in ocean observing. The goal of the community
Roughan M, Cornelisen C, Sutton P,
Garrett S, Giorli G, Smith RO, paper will be achieved by bringing together oceanographers, data scientists and marine
Currie KI, Suanda SH, Williams M, stakeholders to develop an NZ-OOS that provides best knowledge and tools to the
Bowen M, Fernandez D, Vennell R,
Knight BR, Barter P, McComb P,
sectors of society that use or are influenced by the ocean.
Oliver M, Livingston M, Tellier P,
Keywords: ocean observation network, ocean modeling, marine community, Mātauranga Māori, changing
Meissner A, Brewer M, Gall M, ocean climate
Nodder SD, Decima M, Souza J,
Forcén-Vazquez A, Gardiner S,
Paul-Burke K, Chiswell S, Roberts J,
Hayden B, Biggs B and Macdonald H
INTRODUCTION
(2019) Developing an Integrated
Ocean Observing System
New Zealand (NZ) is an island nation with stewardship of an ocean area twenty times its landsize,
for New Zealand. yet it does not currently have an ocean observing system (OOS). NZ’s marine space spans the
Front. Mar. Sci. 6:143. subtropics to the subantarctics with islands to the north, south and east far beyond its two main
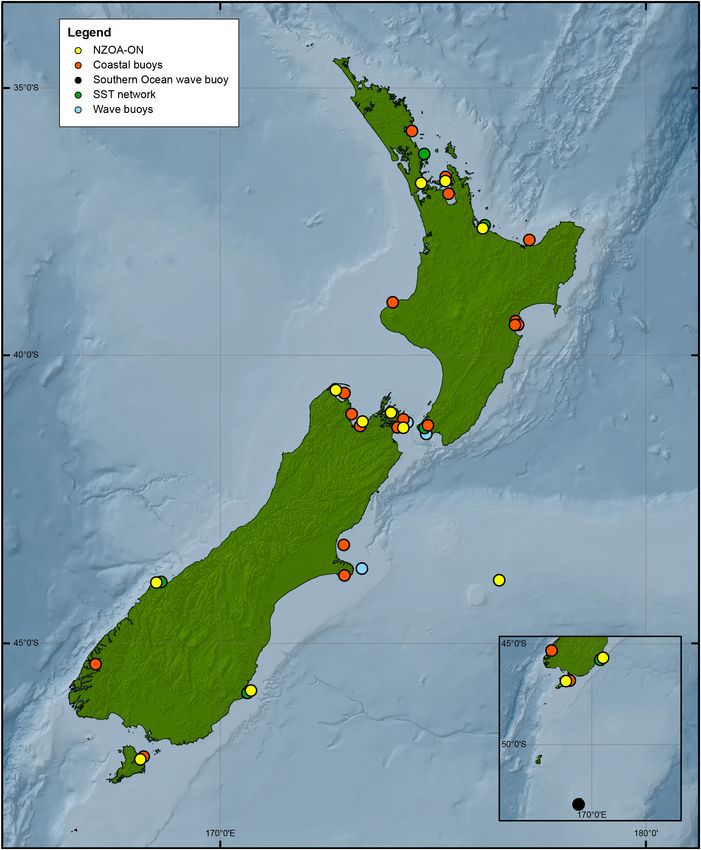
doi: 10.3389/fmars.2019.00143 islands (Figure 1). The shelf sea environment includes broad plateaus, narrow steep shelves and
Frontiers in Marine Science | www.frontiersin.org 1 March 2019 | Volume 6 | Article 143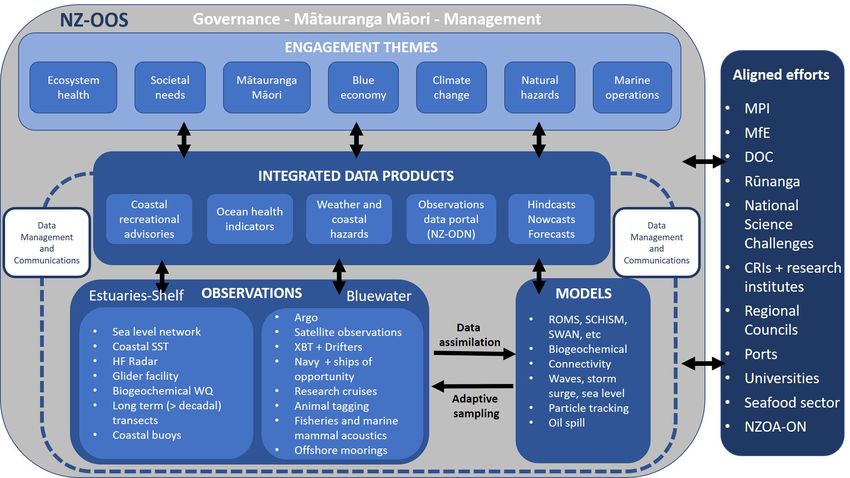
O’Callaghan et al.                                                                                          Ocean Observing System New Zealand

wide continental shelves incised with submarine canyons. Warm,                The concept of an OOS is not new to NZ; factors relating to
saline subtropical water (STW) arrives in NZ from the north                national priorities and NZ’s policy and science systems, combined
via the South Pacific Gyre and East Auckland Current (EAUC).               with limited resources have inhibited the development of an
From the south, subantarctic water (SAW) with lower salinity               NZ-OOS. Resources commensurate with a population of ∼5
and temperature flow near NZ in the Southland Current adjacent             million people and a dominant agricultural sector for many years
to the South Island and in the northernmost branches of the                underpinned a landward focus (Hendy and Callaghan, 2013).
Antarctic Circumpolar Current (Chiswell et al., 2015). Dynamic             Long term coastal warming (Shears and Bowen, 2017) and recent
processes in the shelf seas include strong tidal flows in Central          variability in fish stocks and impacts on aquaculture along with
NZ, large internal tides and significant terrestrial inputs of             extremes in ocean temperature have prompted an urgent rethink
freshwater, sediment and carbon after storms (Zeldis and Swaney,           of how marine sectors will respond to changing environmental
2018; Stevens et al., 2019).                                               drivers (Salinger et al., 2019).
    In dollar terms, NZ’s marine economy is estimated to be
worth around $NZ four billion (Ministry for the Environment                The NZ Science System
[MfE], 2016). NZ’s exclusive economic zone (EEZ) underpins                 The NZ science system is small, which can be both advantageous
an emerging blue economy; it is globally recognized to support             and limiting in terms of developing and implementing
high biodiversity of seabirds and marine mammals, a productive             an OOS. The OECD Research & Development (R&D)
fisheries sector and a growing aquaculture industry. Stewardship           survey identified R&D as a percentage of GDP as 1.263 and
of this large area’s resources and values requires robust scientific       researchers per thousand employment (FTE) as 7.94 (OECD,
knowledge and understanding to ensure sustainable management               2018). The R&D expenditure proportion is around half
of marine ecosystems, which are influenced by multiple stressors           the OECD average. Several significant changes have taken
and a changing climate.                                                    place in the NZ science system sector over the last three
    Indigenous perspectives are a key aspect of NZ’s policy                decades. In 1991 Crown Research Institutes (CRIs) were
and science landscape and are particularly relevant in                     formed, essentially restructuring the Government science
developing effective ocean stewardship that is informed by                 sector from a single research provider (the Department
an NZ-OOS. The government’s Vision Mātauranga (VM)                        of Scientific and Industrial Research, DSIR) into several
policy was developed to unlock the potential of Mātauranga                institutes that were built around a hybrid business and
Māori, which is broadly defined as Māori or traditional                  public-good model.
knowledge, comprehension or understanding of the universe                     Marine scientist capacity is modest across NZ. Major
(Ministry of Research Science and Technology [MoRST],                      employers in the sector are the National Institute of Water
2007). Guardianship or kaitiakitanga of Aotearoa’s (te reo                 and Atmospheric Research (NIWA, a CRI), four (out of
Māori for NZ) land and sea is an intrinsic concept in                     seven) universities, Meteorological Service of New Zealand
Māori science. Joint efforts between Mātauranga Māori                   (MetService), MetOcean Solutions and the Cawthron
and western science practices are becoming more common                     Institute (independent research organization). Research foci
providing a holistic, inclusive, system-wide knowledge of                  of the national institutes has evolved over the past 25 years
the natural world.                                                         from public-good science to stakeholder “co-production.”
                                                                           Current hallmarks of the funding landscape include (1)
The Why and Why Now                                                        separation between climate science and ecosystem research,
New Zealand faces similar challenges – managing multiple                   (2) under-valuing of sustained monitoring of the ocean and
stressors, climate change, sea-level rise, ocean acidification, and        (3) inability to support long term (greater than 5 years)
impacts from changing terrestrial fluxes – as other maritime               projects. Funding for the development and implementation
countries. A sense of urgency exists to understand, predict and            of an NZ-OOS will require a combination of long-term
mitigate, at a national scale, the ocean and ecosystem responses to        government investment, organizational co-investment and
these global problems (Stevens and O’Callaghan, 2015). Figure 2            private sector contributions.
outlines high-level themes of interest for users and beneficiaries
of an NZ-OOS and its integrated data products. Underlying these            NZ-OOS Planning Workshop
themes are six key issues identified by the NZ community as                A successful workshop with multi-institutional support was
kaitiakitanga priorities.                                                  held in August 2018. Participant organizations were NIWA,
                                                                           Cawthron, MetService, Centre for Space Science Technology
    1. Land-sea connectivity and associated stressors (e.g.,               (CSST), Ministry for Primary Industries (MPI), Ministry for
       sedimentation, contaminants).                                       the Environment (MfE), Department of Conservation (DOC),
    2. Coastal and bluewater carbon budgets.                               NZ Navy, Defence Technology Agency (DTA), Auckland and
    3. Sustainable extraction of marine resources (e.g., seabed            Otago Universities, and the Coastal Special Interest Group (C-
       mining, tidal energy).                                              SIG) that represents the national network of regional councils
    4. Sustainable seafood sector including both wild caught               with jurisdiction out to 12 nautical miles. NIWA’s Pou Hononga
       fisheries and aquaculture.                                          for Māori and the Marine Environment provided a Mātauranga
    5. Multi-scale drivers and response of the ocean state.                Māori contribution. Outcomes from workshop discussions form
    6. Maritime safety and transport optimization.                         the basis of this white paper.

Frontiers in Marine Science | www.frontiersin.org                      2                                       March 2019 | Volume 6 | Article 143
O’Callaghan et al. Ocean Observing System New Zealand
FIGURE 1 | Map of New Zealand (NZ) with observational assets are overlaid on the bathymetry. Assets shown are wave buoys (blue dots), coastal buoys (orange
dots), NZOA-ON (yellow dots), SST network (green dots) and the Southern Ocean wave buoy (black dot).
OCEAN OBSERVATIONS SAW for 10 years from 2002 to 2012 to resolve oceanic carbon
budgets (Nodder et al., 2016).
Present State of NZ Observations University of Otago and NIWA established the NZ Ocean
The two longest sea surface temperature (SST) monitoring Acidification observing network (NZOA-ON) with 14 sites
sites are from opposite ends of Aotearoa, with the Portobello around NZ, linked to the Global Ocean Acidification Observing
station (University of Otago) started in 1953, followed by Leigh Network (GOA-ON). The NZOA–ON expands on the successful
(University of Auckland) in 1967. Growth and reduction of a Munida transect off the coast of the South Island established in
coastal SST monitoring network has occurred over intervening 1998 that is the southern hemisphere’s longest-running record of
years (Greig et al., 1988) and as of writing there are five coastal pH (Bates et al., 2014) and surface variability across STW and
SST stations (Figure 1). Other long term observations are the sea SAW (Currie et al., 2011).
level network around NZ1 , which has also had to rationalizatise There are few wave and coastal moorings considering the
the number of sites in recent years. Two biophysical moorings length (15,000 km) and variability of NZ’s coastline. The Firth
were located at 41◦ S, 178◦ 300 E and 46◦ 400 S, 178◦ 300 E in STW and of Thames mooring is the longest at 20 +years (1998 to now,
Zeldis and Swaney, 2018). Sampling durations are typically
1
https://www.niwa.co.nz/our-services/online-services/sea-levels shorter (O’Callaghan et al. Ocean Observing System New Zealand
FIGURE 2 | Framework for the NZ-OOS building on existing efforts in NZ. The proposed structure illustrated has been adapted from that used for the Southeast
Coastal Ocean Observing Regional Association.
in conjunction with Cawthron or NIWA and tend to have a regulatory agencies, CRIs and universities. These workshops will
focus on surface coastal water quality issues and sedimentation define the mix of what infrastructure is most likely to address the
(Figure 1). Passive acoustics moorings to characterize marine key research themes in an ambitious and affordable way for the
mammal migratory pathways have also been deployed for next 1, 5 and 10 years. With international experience to draw on,
12 months in Central NZ. Recently, ocean gliders have been used we are well placed to implement an NZ-OOS in a cost-effective
to observe NZ shelf seas processes with 20 missions since 2015 manner to achieve meaningful and sustained observational
(O’Callaghan, pers comm). coverage with potential to grow strategically in the future.
Bluewater observations have historically been dominated We propose a number of sentinel sites (analogous to the
by mooring deployments of less than 2 year duration and National Reference stations in the Australian IMOS context) that
voyage-based hydrographic surveys to characterize boundary are physically occupied at adequate frequency for biogeochemical
currents around NZ. For example, Tasman Sea boundary and physical water sampling of essential ocean variables (EOVs).
experiments (Stanton and Moore, 1992), and variability studies Sentinel sites will be instrumented appropriately to develop
of the East Auckland Current (EAUC) (e.g. Stanton et al., 1997; environmental baselines in a changing climate. In addition, we
Fernandez et al., 2018, and many others), Norfolk Ridge (Sutton will identify a backbone network of high frequency (HF) radar
and Bowen, 2014) and, Southland Current (Sutton, 2003). and glider deployments to provide boundary current data, and
New Zealand has been an important part of the Global Argo context for model data assimilation.
program since the early 2000s with NIWA’s vessel R/V Kaha A creative approach will be required to get meaningful
Ora deploying 1287 floats in the Pacific, Indian and Southern coverage across NZ’s large EEZ. It is recognized that the NZ
Oceans. NIWA’s RV Tangaroa has deployed a further 147 floats. seafood sector provides an opportunistic pathway for data
The most southerly wave buoy in the world has been maintained collection and effort is already being made with this sector. The
◦
by the MetService since 2016 at 52.7 S. EXpendable Bathy NZ Navy has plans to facilitate oceanographic data collection. By
Thermographs (XBTs) have been deployed along two tracks using vessels of opportunity, we can optimize data coverage while
ending in NZ roughly four times per year (Sutton et al., 2005). minimizing costs to NZ-OOS.
XBTs are also routinely deployed by the NZ Navy.
OCEAN MODELING
Plans for a Future Observational
Network Present Status
Building on the framework of existing observations, a series of Physical and biogeochemical ocean modeling is undertaken by a
workshops will be held with scientists and key stakeholders in number of organizations with each team having their preferred
Frontiers in Marine Science | www.frontiersin.org 4 March 2019 | Volume 6 | Article 143O’Callaghan et al. Ocean Observing System New Zealand
model (ROMS, Schism/SELFE, SWASH, SWAN, WW3, Gerris, the funding agencies will strengthen the requirements for data
and Basilisk), domain (coastal to global scale), grid (structured, sharing. New Zealand Government Open Access and Licensing
unstructured, curvilinear or adaptive), timeframe (days, weeks [NZGOAL], 2019 provides a framework for open data to apply to
to years) and parameters (physics, biogeochemistry, sediment all sector data.
transport, waves). Typically these models have been developed In 2017 the New Zealand Ocean Data Network (NZODN)3
either for specific process studies (e.g., Hadfield et al., 2007), or was launched, modeled on the Australian Open Data Network
in response to stakeholder requirements and resource consent (AODN). It is now a collaboration between NIWA and Land
applications. Operational forecasts of waves, storm surge and Information New Zealand (LINZ). The AODN Portal provides
barotropic circulation exist at the national scale. access to all available Australian marine and climate science data
An OOS is acknowledged as incomplete without a nationally and provides the primary access to IMOS data. A key point
coordinated ocean modeling program. The benefits are 2-fold: of difference is that IMOS is national collaborative research
observational design is optimized from model simulations while infrastructure, supported by Australian Government – no
modeling efforts are constrained by relevant observations. The equivalent exists yet in the New Zealand system, although this is
Australian Integrated Marine Observing system (IMOS) program our aspiration. The NZODN and AODN are regional reflections
did not initially include funding for ocean modeling. Australian of a growing international trend for open data resources.
Coastal and Oceans Modeling and Observations (ACOMO)
was born 5 years after IMOS and provides a valuable national Data Science Products and Tools
perspective on modeling and observational networks. It is The evolution of useful data products becomes iterative as users
considered prudent to incorporate an integrated modeling system tend to be resourceful and can use data in ways not obvious in
in NZ-OOS from the outset. the initial planning. This ad hoc co-production can be enhanced
through better and wider end-user input to the design phase.
Plans for Ocean Modeling and Data The impact of the NZ-OOS will be enhanced if it provides easy
Assimilation pathways for uptake, manipulations and re-dissemination from
Close connections between the NZ science community and the outset. Stakeholders are likely users of tools and while uptake
stakeholders means that knowledge relevant to industry is may be slow they will provide robust interrogation of the results
paramount. A national modeling framework that assimilates whereas the public are likely to be fast and idiosyncratic in
new and historic observations is essential for an integrated their usage. Both pathways provide connections between science
NZ-OOS. In this way the observations and modeling initiatives product and government policy.
are intimately coupled. A high resolution coastal ocean
reanalysis (ocean state estimate) is being developed by MetOcean Mātauranga Māori
Solutions2 . This modeling system will include a 25-year data It is possible that NZ can be among the world leaders in
assimilating physical model and will provide open access daily the integration of traditional knowledge with western science
coastal ocean forecasts in the next 1 to 3 years. Model hindcasts into an NZ-OOS. Mātauranga-a-iwi is being advanced through
of physics and biogeochemistry are being developed by NIWA Treaty settlements legislation and other negotiated agreements,
at the EEZ scale. Observation impact experiments (Kerry et al., which is creating co-management arrangements and increased
2018) and observing system simulation experiments (Kourafalou participation by Māori in all areas of ocean research, policy and
et al., 2015) provide both context for ongoing model development management. Māori are seeking Mātauranga and science advice
and the evolution of the observing system. to address aspirations in halting ocean degradation through
adaptive management strategies, inclusive of both traditional
and contemporary forms of kaitiakitanga. There is potential
DATA, TOOLS, AND DELIVERY for non-sacred traditional knowledge to be shared through
knowledge platforms such as Māori environmental forums
Open Data and Legacy Data Issues and Rûnanga (a recognized iwi or tribal authority) therefore
Open access to data underpins OOS frameworks globally and enhancing uptake and integration.
success of the proposed NZ-OOS will be intertwined with
availability of data, data uptake and publications. The necessary
shift in perspective is underway in NZ but is happening against TOWARD AN INTEGRATED NZ-OOS
a backdrop of a better understanding of what open data means
and resourcing open data. The proprietary nature of data The NZ-OOS is a bottom-up community-driven initiative and
from commercial projects is questionable, particularly if they its success depends on a joint, inclusive approach. Overcoming
were collected with resources and capacity co-supported by longstanding limitations established by the hybrid science model
government funding. over nearly 30 years will require ongoing and meaningful
Open data is universally recognized as a “good thing” cross-institutional engagement. With collaborative governance,
(Schmidt et al., 2016), however, there remain issues relating to broad participation, and sustainable central government funding,
quality assurance and usage restrictions. Stronger mandates from NZ is fully capable of implementing a world-leading OOS that
2 3
https://www.moanaproject.org/ https://nzodn.nz/
Frontiers in Marine Science | www.frontiersin.org 5 March 2019 | Volume 6 | Article 143O’Callaghan et al. Ocean Observing System New Zealand
provides effective kaitiakitanga of its vast EEZ in a changing 3. Access to model hindcast and reanalysis products for
climate. This white paper is the first step in the implementation simulating and visualizing NZ’s EEZ.
process. Figure 2 provides the framework for the proposed 4. The ability for rapid response for forecasting coastal hazards,
NZ-OOS from governance through to details of data collection oil spill trajectories, and biosecurity risk.
platforms. Ecosystem-based management tools that are being 5. Implementation of a network of sentinel sites for observing
developed in National Science Challenges (aligned efforts) EOVs along latitudinal and anthropogenic gradients.
will allow integration of monitoring components at the 6. Develop and implement sentinel fish and marine megafauna
10-year time scale. data collection programs that indicate ecosystem change.
Without doubt the biggest hurdle to overcome is sufficient
and sustained resourcing of the proposed NZ-OOS. Often the After ten years, the NZ-OOS could include:
limiting factor in the development of a highly sophisticated ocean
1. A widely accessible OOS visualization system that enables
observing system such as the one detailed here is the available
society to engage with ocean data in new and exciting ways.
funding mechanisms. Observational data streams obtained via
2. Data assimilating operational models providing near-real time
existing research programs from central government funding will
forecasting of our entire EEZ.
be the backbone of NZ-OOS in the short- to medium term.
3. Commitment from the seafood industry, with the
Resources to support working group progress will come from
entire fishing fleet and aquaculture farms established as
individual organizations. Long-term funding was identified by
observing platforms.
the community as much more difficult to secure. Ultimately, this
4. Integration of ecological layers and the inclusion of,
will require a business case to be submitted to the NZ government
biogeochemical and molecular ocean data through aligned
to fund future ocean infrastructure.
sampling programs.
By the end of the first year, we aim to develop a draft strategic
5. Successful integration of Mātauranga Māori into a national
plan built on a well-designed framework and collaborative
OOS framework.
governance structure. With a sound plan in place, a business
case for funding an NZ-OOS will be developed. Many of the To summarize, with the integration of Mātauranga Māori,
elements, both observational and modeling, already exist in NZ. NZ’s science, technologies and closely connected community
It is encouraging that the NZ-OOS framework has begun to provides a timely opportunity to develop an exemplary NZ-OOS
provide, since the August 2018 workshop, a mechanism for new that will provide a world-leading example of ocean stewardship,
connections of aligned efforts from organizations (Figure 2). and enable ocean knowledge, data and tools to be openly
To achieve the year 1 objective, we will establish: accessed for the benefit of NZ’s economy, social well-being
1. A pan-NZ steering committee and governance board. and ocean health.
2. Four working groups focused on estuaries to shelf, bluewater,
data systems, and communications. The scope of each group
will be expansive to overcome organization and science AUTHOR CONTRIBUTIONS
discipline silos.
3. A catalog of observational assets and existing marine data for JO led the writing and NZ-OOS workshop. CS, MR, and
NZ (Figure 1). CC contributed to respective sections of the manuscript.
4. A strategy for implementing Mātauranga Māori in All other authors either participated in the August
an NZ-OOS. workshop or provided feedback on various versions
of the manuscript.
After 5 years, the NZ-OOS could include:
1. A widely subscribed data system built around the NZ-Ocean
Data Network (NZ-ODN) providing data to a wide range FUNDING
of users.
2. A network of coastal monitoring assets in key regions The NZ-OOS workshop and resources for manuscript was
across a range of organizations that follow standardized data funded by NIWA under Coasts and Oceans Research Program
exchange protocols. 2 (2018/19 SCI).
REFERENCES Currie, K. I, Malcolm, R., Reid, K., and Hunter, A. (2011). Interannual variability
of carbon dioxide drawdown by subantarctic surface water near New Zealand,
Bates, N. R., Astor, Y. M., Church, M. J., Currie, K., Dore, J. E., Gonzalez-Davila, M., SpringerLink. Biogeochemistry 104, 23–34. doi: 10.1007/s10533-009-
et al. (2014). Changing ocean chemistry: a time-series view of ocean uptake 9355-3
of anthropogenic CO2 and ocean acidification. Oceanography 27, 126–141. Fernandez, D., Bowen, M., and Sutton, P. (2018). Variability, coherence and forcing
doi: 10.5670/oceanog.2014.16 mechanisms in the New Zealand ocean boundary currents. Prog. Oceanogr. 165,
Chiswell, S. M., Bostock, H. C., Sutton, P. J., and Williams, M. J. (2015). 168–188. doi: 10.1016/j.pocean.2018.06.002
Physical oceanography of the deep seas around New Zealand: a review. Greig, M. J., Ridgway, N. M., and Shakespeare, B. S. (1988). Sea surface temperature
N. Z. J. Mar. Freshw. Res. 49, 286–317. doi: 10.1080/00288330.2014. variations at coastal sites around New Zealand. N. Z. J. Mar. Freshw. Res. 22,
992918 391–400. doi: 10.1080/00288330.1988.9516310
Frontiers in Marine Science | www.frontiersin.org 6 March 2019 | Volume 6 | Article 143O’Callaghan et al. Ocean Observing System New Zealand
Hadfield, M. G., Rickard, G. J., and Uddstrom, M. J. (2007). A hydrodynamic N. Z. J. Mar. Freshw. Res. 26, 339–358. doi: 10.1080/00288330.1992.951
model of Chatham rise, New Zealand. N. Z. J. Mar. Freshw. Res. 41, 239–264. 6528
doi: 10.1080/00288330709509912 Stanton, B. R., Sutton, P. J. H., and Chiswell, S. M. (1997). The East Auckland
Hendy, S., and Callaghan, P. (2013). Get off the Grass: Kickstarting New Zealand’s current, 1994–95. N. Z. J. Mar. Freshw. Res. 31, 537–549. doi: 10.1080/00288330.
Innovation Economy. Auckland: Auckland University Press. 1997.9516787
Kerry, C. G., Roughan, M., and Powell, B. S. (2018). Observation impact in a Stevens, C., and O’Callaghan, J. (2015). When the holiday is over: being clever in
regional reanalysis of the East Australian current. J. Geophys. Res. Oceans 123, New Zealand’s marine domain. J. R. Soc. N. Z. 45, 89–94. doi: 10.1080/03036758.
7511–7528. doi: 10.1029/2017JC013685 2015.1014377
Kourafalou, V., De Mey, P., Le Hénaff, M., Charria, G., Edwards, C., He, R., et al. Stevens, C., O’Callaghan, J., Chiswell, S., and Hadfield, M. (2019). Review of NZ
(2015). Coastal ocean forecasting: system integration and evaluation. J. Oper. Shelf Seas oceanography. N. Z. J. Mar. Freshw. Res. doi: 10.1080/00288330.2019.
Oceanogr. 8, s127–s146. doi: 10.1080/1755876X.2015.1022336 1588746
Ministry for the Environment [MfE] (2016). Our Marine Environment 2016. Sutton, P. J. H. (2003). The southland current: a subantarctic current.
Available at: https://www.mfe.govt.nz/publications/marine-environmental- N. Z. J. Mar. .Freshw. Res. 37, 645–652. doi: 10.1111/j.1365-294X.2010.04
reporting/our-marine-environment-2016 842.x
Ministry of Research Science and Technology [MoRST] (2007). Vision Sutton, P. J. H., and Bowen, M. (2014). Flows in the Tasman front south of
Mātauranga: Unlocking the Innovation Potential of Māori Knowledge, Resources Norfolk Island. J. Geophys. Res.: Oceans 119, 3041–3053. doi: 10.1002/2013JC00
and People. Available at: https://www.mbie.govt.nz/assets/9916d28d7b/vision- 9543
matauranga-booklet.pdf Sutton, P. J. H., Bowen, M., and Roemmich, D. (2005). Decadal temperature
New Zealand Government Open Access and Licensing [NZGOAL] (2019). changes in the Tasman Sea. N. Z. J. Mar. Freshw. Res. 39, 1321–1329.
New Zealand Government Open Access and Licensing. Available at: https://www. doi: 10.1080/00288330.2005.9517396
data.govt.nz/manage-data/policies/nzgoal [accessed February 27, 2019]. Zeldis, J. R., and Swaney, D. P. (2018). Balance of catchment and offshore nutrient
Nodder, S. D., Chiswell, S. M., and Northcote, L. C. (2016). Annual cycles of deep- loading and biogeochemical response in four New Zealand coastal systems:
ocean biogeochemical export fluxes in subtropical and subantarctic waters, implications for resource management. Estuaries Coasts 41, 2240–2259.
southwest Pacific Ocean. J. Geophys. Res. Oceans 121, 2405–2424. doi: 10.1002/ doi: 10.1007/s12237-018-0432-5
2015JC011243
OECD (2018). Main Science and Technology Indicators. Available at: http://www. Conflict of Interest Statement: The authors declare that the research was
oecd.org/sti/msti.htm conducted in the absence of any commercial or financial relationships that could
Salinger, J. M., Behrens, E., Mullan, B. A., Diamond, H. J., Renwick, J., Sirguey, P., be construed as a potential conflict of interest.
et al. (2019). The unprecedented coupled ocean-atmosphere summer heatwave
in the New Zealand region 2017/18: drivers, mechanisms and impacts. Environ. Copyright © 2019 O’Callaghan, Stevens, Roughan, Cornelisen, Sutton, Garrett,
Res. Lett. doi: 10.1088/1748-9326/ab012a Giorli, Smith, Currie, Suanda, Williams, Bowen, Fernandez, Vennell, Knight,
Schmidt, B., Gemeinholzer, B., and Treloar, A. (2016). Open data in global Barter, McComb, Oliver, Livingston, Tellier, Meissner, Brewer, Gall, Nodder, Decima,
environmental research: the Belmont Forum’s open data survey. PLoS One Souza, Forcén-Vazquez, Gardiner, Paul-Burke, Chiswell, Roberts, Hayden, Biggs and
11:e0146695. doi: 10.1371/journal.pone.0146695 Macdonald. This is an open-access article distributed under the terms of the Creative
Shears, N. T., and Bowen, M. M. (2017). Half a century of coastal temperature Commons Attribution License (CC BY). The use, distribution or reproduction in
records reveal complex warming trends in western boundary currents. Sci. Rep. other forums is permitted, provided the original author(s) and the copyright owner(s)
7:14527. doi: 10.1038/s41598-017-14944-2 are credited and that the original publication in this journal is cited, in accordance
Stanton, B., and Moore, M. (1992). Hydrographic observations during the Tasman with accepted academic practice. No use, distribution or reproduction is permitted
boundary experiment off the west coast of South Island, New Zealand. which does not comply with these terms.
Frontiers in Marine Science | www.frontiersin.org 7 March 2019 | Volume 6 | Article 143You can also read