A 40-year High Arctic climatological dataset of the Polish Polar Station Hornsund (SW Spitsbergen, Svalbard) - ESSD
←
→
Page content transcription
If your browser does not render page correctly, please read the page content below
Earth Syst. Sci. Data, 12, 805–815, 2020
https://doi.org/10.5194/essd-12-805-2020
© Author(s) 2020. This work is distributed under
the Creative Commons Attribution 4.0 License.

                 A 40-year High Arctic climatological dataset of
                       the Polish Polar Station Hornsund
                          (SW Spitsbergen, Svalbard)
                                         Tomasz Wawrzyniak and Marzena Osuch
                            Institute of Geophysics, Polish Academy of Sciences, Warsaw, Poland
                                Correspondence: Tomasz Wawrzyniak (tomasz@igf.edu.pl)

                                Received: 8 November 2019 – Discussion started: 20 December 2019
                           Revised: 28 February 2020 – Accepted: 5 March 2020 – Published: 3 April 2020

       Abstract. The article presents the climatological dataset from the Polish Polar Station Hornsund located in the
       southwest part of Spitsbergen – the biggest island of the Svalbard archipelago. Due to a general lack of long-term
       in situ measurements and observations, the High Arctic remains one of the largest climate-data-deficient regions
       on the Earth. Therefore, the described time series of observations in this paper are of unique value. To draw
       conclusions on the climatic changes in the Arctic, it is necessary to analyse and compare the long-term series of
       continuous, in situ observations from different locations, rather than relying on the climatic simulations only. In
       recent decades, rapid environmental changes occurring in the Atlantic sector of the Arctic are reflected in the data
       series collected by the operational monitoring conducted at the Hornsund station. We demonstrate the results of
       the 40-year-long series of observations. Climatological mean values or totals are given, and we also examined
       the variability of meteorological variables at monthly and annual scale using the modified Mann–Kendall test for
       trend and Sen’s method. The relevant daily, monthly, and annual data are provided on the PANGAEA repository
       (https://doi.org/10.1594/PANGAEA.909042, Wawrzyniak and Osuch, 2019).

1   Introduction                                                   tion of heat from the oceanic and atmospheric circulations
                                                                   with regional differences throughout the area. Mechanisms
For the analysis of the Arctic climate change, the long-term       of Arctic amplification are still not fully understood but in-
operational monitoring of meteorological variables includ-         clude feedback of reduced summer albedo due to reduction
ing reliable observations and measurements is obligatory.          of sea ice extent and snow cover loss, higher sea surface
Weather conditions are crucial drivers that have feedback          temperatures, an increase of atmospheric water vapour con-
on many environmental components, and it is important to           tent, cloud conditions, and changes in atmospheric circula-
have a relevant dataset of atmospheric observation data when       tion (IPCC, 2019). The growing number of positive annual
analysing the variability and fluctuations of climate at any       air temperature anomalies in the Arctic varies substantially
given location. Climate change in the Arctic reflects a global     within the region, with the strongest changes observed in the
warming trend, but the warming here is much faster than in         Atlantic sector (Przybylak, 2016). Here, the Greenland Sea
lower latitudes (IPCC, 2019). The characteristics of Earth’s       to the west of Svalbard is dominated by the West Spitsber-
climate zones are primarily determined by astronomical fac-        gen Current, carrying warm (3–6 ◦ C) and salty (> 35 ‰) At-
tors, but there are differences in the mechanisms that cause       lantic waters towards the Fram Strait. In this region, this flow
a regional warming trend and determine their magnitude.            is over 200 km wide and strongly influences the air tempera-
The presence of solar radiation, modified by the degree of         ture in the SW Spitsbergen area, especially during the winter
cloudiness and type of clouds, is the main factor influenc-        (Walczowski et al., 2017). The specific maritime and mild
ing the transfer of energy. In polar regions during the po-        climatic conditions are also influenced by local and regional
lar night, the sole source of energy is the dynamic advec-         factors such as sea ice cover and its distribution (Dahlke et

Published by Copernicus Publications.
806                                                T. Wawrzyniak and M. Osuch: A 40-year High Arctic climatological dataset

al., 2020), the presence of glaciers, orography of the terrain,    physics Polish Academy of Sciences), year-round, system-
and location near the seashore. The climatic variables such        atic, continuous measurements and observations at WMO
as air temperature, humidity, and precipitation vary signifi-      standards have been conducted since July 1978. The results
cantly across the archipelago (Nordli et al., 2014; Osuch and      of automatic measurements and visual observations are sent
Wawrzyniak, 2017a) as well as around the Hornsund fjord            as the SYNOP code to WMO database every 60 min and 3 h,
(Araźny et al., 2018). Long-term, high-quality, in situ consis-   respectively. Since January 2001 most of the traditional in-
tent meteorological observations have been collected at the        struments had been replaced by an automatic weather station
Hornsund station located at the northern shore of this fjord.      with Vaisala QLC-50 logger. The sensors of the new system
Relative to the other parts of the Arctic, air temperatures in     have been installed on meteorological mast, situated 160 m
Svalbard are the highest at this latitude and their observed       SW of the main station building. To replace Vaisala QLC-
changes are one of the largest on Earth (IPCC, 2019). There        50, in September 2016 a new system called Vaisala MAWS
is evidence for anomalies and changes in recent years in At-       301 was set on the same meteorological mast. To determine
lantic sector of the Arctic, along western Spitsbergen, includ-    the degree of compatibility and homogeneity of the measure-
ing higher air temperature (Gjelten et al., 2016) and higher       ments, the old and new sensors were operating simultane-
liquid precipitation (Osuch and Wawrzyniak, 2017a). These          ously for more than 1 year. The results of the analysis al-
changes have many environmental implications, leading to           lowed us to combine time series; since January 2018 the data
prolongation of the ablation season (Osuch and Wawrzyniak,         have come from Vaisala MAWS 301. A comprehensive de-
2017b), the negative mass balance of glaciers (van Pelt et         scription of measurements and instruments can be found in a
al., 2019), and permafrost degradation (Wawrzyniak et al.,         collective work edited by Marsz and Styszyńska (2013) and
2016).                                                             in Table 1. Although the time series of the data stretches up
                                                                   to July 1978, here we analyse the variability of climatic con-
                                                                   ditions over the period 1979–2018 and in some cases 1983–
2   Study area                                                     2018, based on the availability of observations without gaps.
                                                                   The daily, monthly, and annual averages or sums, and the ex-
The Stanisław Siedlecki Polish Polar Station in Hornsund           treme range (min and max) computed from observations are
(77◦ 000 N 15◦ 330 E), located 300 m from the shore of the Is-     provided in the scientific digital data repository PANGAEA
bjørnhamna Bay of the Hornsund fjord in SW Spitsbergen             (Wawrzyniak and Osuch, 2019).
(Fig. 1), was established during the International Geophys-
ical Year in 1957. Since 1978 it has conducted year-round          3     Meteorological variables
scientific research, and it is the northernmost permanent Pol-
ish scientific site, which throughout the years has become         Interseasonal weather fluctuations are determined by the
a modern interdisciplinary scientific platform that carries out    changing Arctic climate system and atmospheric circulation.
research projects aimed at a better understanding of the func-     The changing global climate also modifies regional condi-
tioning of the arctic nature and the changes it undergoes. The     tions. Weather conditions are crucial factors that have local
Hornsund fjord is approximately 35 km long and approxi-            feedback on many environmental components. Meteorologi-
mately 14.5 km wide at its mouth to the Greenland Sea. The         cal variables collected at the Hornsund station help to char-
coastline of Hornsund is diversified, with multiple bays and       acterise the climate variability in this part of the Arctic and
glaciated valleys. A recent expansion of the ice-free areas is     for a long time have been the background for multiple studies
observed in Svalbard, with the most significant retreats of the    conducted in the SW Spitsbergen (Osuch and Wawrzyniak,
tidewater glaciers (Błaszczyk et al., 2013), so the recognition    2017b; Wawrzyniak et al., 2017). Due to the diurnal variabil-
of the changes in the functioning of the environmental system      ity of all meteorological variables, in this study, we use de-
becomes more and more essential. The station is set on a ma-       scriptive statistic methods to present the course and variation
rine terrace at 10 m a.s.l. This terrace, raised during Holocene   of multiple parameters. For most meteorological parameters,
(Lindner et al., 1991), consists of sea gravel and is covered      monthly mean values are calculated from daily mean values
by a diversity of tundra vegetation types. The slopes of the       which are retrieved using the 3-hourly values (eight values a
nearest mountain ranges Fugleberget (569 m) and Ariekam-           day, between 00:00 and 21:00 UTC), in the case of precipi-
men (517 m) are located 1 km north from the station. Around        tation 6-hourly values (12:00, 18:00, and 00:00, 06:00 UTC
800 m NE from the station lies the lateral moraine of Hans-        of the following day), and daily sum of total solar radiation
breen glacier. Currently, the distance from the station to the     from Campbell–Stokes recorder obtained at the midnight.
front of Hansbreen is around 2.5 km. The ground here has a
continuous permafrost layer down to more than 100 m deep
                                                                   3.1    Air temperature
(Wawrzyniak et al., 2016).
   At Hornsund meteorological site (indexed by international       Air temperature (TA) can be presumed to be one of the most
numbering system 01003 (https://oscar.wmo.int/surface/, last       sensitive indicators of climatic changes. The time series of
access: 1 April 2020), managed by the Institute of Geo-            daily TA from the Hornsund station covers the period 1979

Earth Syst. Sci. Data, 12, 805–815, 2020                                            www.earth-syst-sci-data.net/12/805/2020/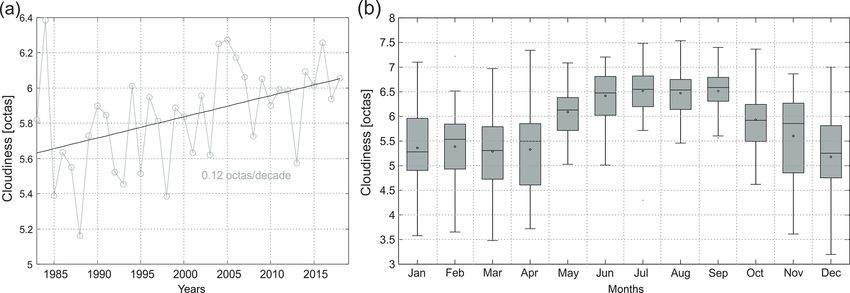
T. Wawrzyniak and M. Osuch: A 40-year High Arctic climatological dataset 807
Figure 1. Polish Polar Station Hornsund on Spitsbergen in the Svalbard archipelago.
Table 1. Meteorological data measured at Hornsund including variables, current sensors, the period of operation, height, units, and their
annual averages or sums.
Variable Location Sensor Period of operation Height Unit Mean/sum
Air temperature 77◦ 000 1.26100 N Traditional thermometer in a Stevenson 1979–2018 2 m a.g.l. ◦C TAmax = −1.3
(TA) 15◦ 320 12.26700 E screen, TAmean = −3.7
Vaisala HMP 45D (since January TAmin = −6.0
2001),
HMP155 (since January 2018)
Relative 77◦ 000 1.26100 N Hygrometer, HMP45D (since January 1979–2018 with 2 m a.g.l. % 79.7
humidity (RH) 15◦ 320 12.26700 E 2001), HMP155 (since January 2018) gap 1 July–16 Au-
gust 1982
Precipitation 77◦ 000 5.73400 N Hellmann rain gauge D-200 1979–2018 1 m a.g.l. mm 478
15◦ 320 17.07700 E
Atmospheric 77◦ 000 1.26100 N Mercury barometer, PTB200A (since 1983–2018 Reduced to the hPa 1008.7
pressure (PA) 15◦ 320 12.26700 E January 2001), sea level
Baro-1QML-AV (since January 2018)
Wind speed 77◦ 000 1.26100 N Fuess 90z wind meter, 1983–2000 10 m a.g.l. m s−1 5.5
(WS) and 15◦ 320 12.26700 E Vaisala WAA151 (since January 2001), 2001–2016
direction (WD) Vaisala WMT702 (since January 2018) 2017–2018
Sunshine 77◦ 000 5.93500 N Campbell–Stokes heliograph 1979–2018 2 m a.g.l. h 1030.8
duration (SD) 15◦ 320 14.300 E
Cloudiness On location Visual observations 1983–2018 octas 5.85
Visibility On location Visual observations 1983–2018 marine scale 7.40
to 2018. In the case of daily mean TA, there are no gaps in Kendall indicated that the trends are statistically significant;
data, while for maximum and minimum, daily TA data for the estimated p value is very small (less than 1 × 10⁻⁷ ) for
1 September 1979, 29 February 1980, 15 June 2012, and three presented variables.
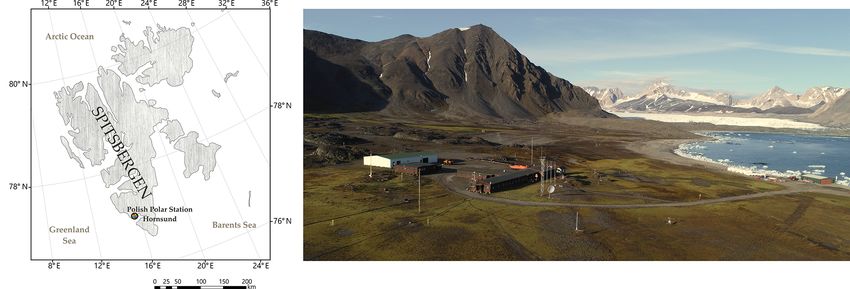
19 June 2017 are missing. Figure 2a presents the variabil- The estimated slope of trend equal to 1.34, 1.14, and
ity of the annual mean of minimum, mean, and maximum 1.00 ◦ C per decade for minimum, mean, and maximum TA
TA in 1979–2018 at the Hornsund station. An upward trend respectively. These are one of the highest increases of mean
is clearly visible for the three analysed variables. The sig- TA on the planet, more than 6 times higher than the global
nificance of the trend was estimated by the modified Mann– average of +0.17 ◦ C per decade (NOAA, 2020). The rest of
Kendall test (Mann, 1945; Kendall, 1975; Hamed and Rao, the world is not expected to experience such changes until the
1998) taking into account autocorrelation of time series. The end of this century (Hanssen-Bauer et al., 2019). The results
slope of the trend was estimated using Sen’s method (Sen, of trend analyses for mean monthly TA (min, mean, and max)
1968), where the slope is calculated as a median of the slopes are presented in Table 2. In almost all months there are statis-
of all pairs of points. The outcomes of the modified Mann– tically significant trends except March. In all analysed cases
www.earth-syst-sci-data.net/12/805/2020/ Earth Syst. Sci. Data, 12, 805–815, 2020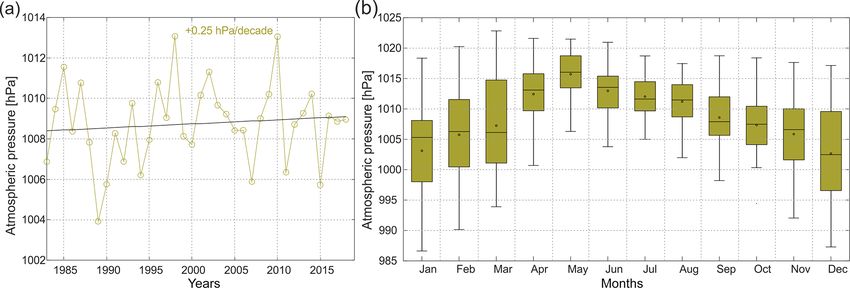
808 T. Wawrzyniak and M. Osuch: A 40-year High Arctic climatological dataset
the estimated slope of trend has positive values and indicated
0.05 level.
variables. The results of trend analysis by modified Mann–Kendall method to account for autocorrelation in the time series. Bold numbers denote a statistically significant trend at the
WS, sunshine duration – SD, cloudiness and visibility – VV) estimated by Sen’s method in the period 1979–2018 for air temperature and sunshine duration and in 1983–2018 for other
Table 2. The slope of the trend in monthly and annual data (air temperature – TA, relative humidity – RH, precipitation – Precip, atmospheric pressure at sea level – PA, wind speed –
Annual
December
November
October
September
August
July
June
May
April
March
February
January
Month
the increase in TA. A comparison of the results between vari-
ables shows that the largest changes were found for minimum
daily TA (1.34 ◦ C per decade), while the lowest changes were
found for the maximum daily TA (1.0 ◦ C per decade). Taking
(◦ C per decade)
into account changes between months, the largest changes
were estimated for January, February, and December (larger
TAmin
than 2.0 ◦ C per decade for minimum and mean daily TA).
1.34
2.56
1.73
1.16
0.73
0.37
0.36
0.61
0.97
1.37
0.74
2.46
2.70
The smallest statistically significant are trends in July and
August with slopes of the trend around 0.3 ◦ C per decade.
(◦ C per decade)
Figure 2b shows the box plots of monthly averages of
minimum, mean, and maximum daily TA from the period
TAmean
1.14
2.39
1.46
1.07
0.67
0.33
0.27
0.52
0.70
1.00
0.57
2.14
2.29
1979–2018. The variability of TA depends on the season,
with the highest amplitudes during winter months. Summer
(◦ C per decade)
TA is rather constant, with monthly means reaching usually
slightly below 5.0 ◦ C. Average monthly TA during winter
and early spring usually drop below −10.0 ◦ C. The results
TAmax
1.00
2.18
1.37
1.01
0.62
0.33
0.31
0.54
0.49
0.79
0.34
1.74
1.86
are in general accordance with observations made at other
Arctic stations and reveal that winter is characterised by the
( % per decade)
highest variability of TA (Gjelten et al., 2016; Osuch and
Wawrzyniak, 2016, 2017a). The amplitude between the ex-
treme high and low in this season may be several times higher
−0.27
−0.64
−0.41
−0.33
–0.65
–1.13
0.10
0.18
0.30
1.50
0.62
0.00
0.26
RH
than in summer. These fluctuations are determined by the rel-
atively stable anticyclonic subsidence with extreme cold and
(mm per decade)
the turbulent cyclonic disturbances that bring higher temper-
atures, greater cloudiness, and heavy precipitation. The low-
est recorded TA measured at a 2 m height above solid ground
−3.23
−0.41
−1.61
Precip
61.60
13.53
19.67
5.24
5.43
7.49
1.11
1.92
1.48
3.51
at Hornsund station was −35.9 ◦ C on 16 January 1981, while
the absolute maximum was 15.6 ◦ C on 31 July 2015. Mean
(hPa per decade)
annual air temperature (MAAT) in long-term 1979–2018 is
−3.7 ◦ C. The average coldest month is March with a mean
TA of −10.2 ◦ C, and on average the warmest month is July
–0.95
–0.60
–0.10
–0.66
–0.27
with a mean TA of 4.6 ◦ C. The coldest month on record with
0.25
1.15
0.18
0.30
0.67
0.27
0.50
1.54
a mean of −17.9 ◦ C was January 1981, and the warmest PA
July 2016 with a mean of 6.3 ◦ C. Additionally, in the dataset
(m per decade)
we also provided monthly and annual positive (PDD) and
negative degree days (NDD), calculated as the sum total of
−0.06
−0.12
−0.13
−0.14
0.08
0.24
0.05
0.50
0.09
0.12
0.23
0.40
0.06
WS
daily mean temperatures above or below the 0 ◦ C respec-
tively.
(h per decade)
−10.07
3.2 Air humidity
−8.39
−1.33
−5.92
−1.80
0.00
0.00
0.79
5.18
2.36
5.52
1.38
0.00
SD
The water vapour drives multiple atmospheric processes and
has a significant influence on the global climate. It is the
(octas per decade)
main greenhouse gas, affecting the surface by feedback cy-
Cloudiness
cle through changing energy balance through radiative fluxes
and cloud formation. According to general concepts, the Arc-
−0.01
0.12
0.13
0.26
0.28
0.16
0.02
0.12
0.11
0.00
0.16
0.04
0.12
tic warming of recent decades is accompanied by the hy-
drological cycle intensification (Vihma et al., 2016; Osuch
(change per decade)
et al., 2019). To understand the variability of water vapour
concentration and its causes is highly important, especially
for climate studies as well as in water balance calculations.
At the Hornsund station, the air humidity is currently mea-
−0.02
−0.10
−0.08
−0.10
−0.02
−0.07
−0.06
−0.06
−0.03
–0.17
0.13
0.11
0.15
VV
sured by sensor HMP155, which replaced the previously
used HMP45D sensor. The observations cover the period
Earth Syst. Sci. Data, 12, 805–815, 2020 www.earth-syst-sci-data.net/12/805/2020/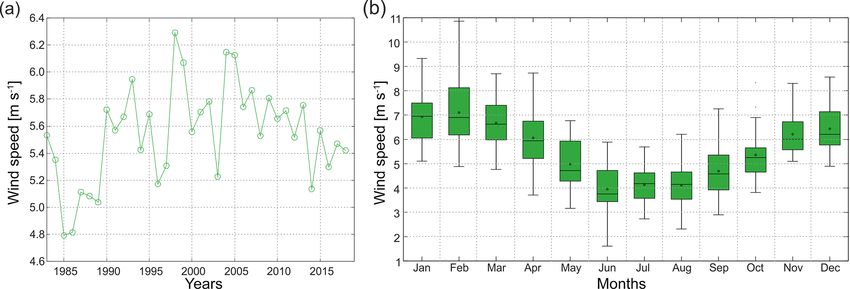
T. Wawrzyniak and M. Osuch: A 40-year High Arctic climatological dataset                                                              809

Figure 2. (a) Variability of an annual mean of min, mean, and max air temperatures in 1979–2018. (b) Variability of the monthly mean of
min, mean, and max air temperatures in 1979–2018. On each box, the central line indicates the median, the circle represents the mean, and
the bottom and top edges of the box indicate the 25th and 75th percentiles, respectively. The whiskers that extend to the most extreme data
points are not considered outliers, and the outliers are plotted individually as dots.

1979–2018, but measurements were performed four times                   3.3   Precipitation
a day (00:00, 06:00, 12:00, 18:00 UTC) within the periods
1 July 1978–26 July 1981 and 16 August 1982–31 July 1986,               In the case of precipitation, the daily sum at the Hornsund
two times a day (06:00 and 18:00 UTC) from 27 July 1981                 station is calculated from four measurements obtained from
to 30 June 1982, and eight times a day (00:00, 03:00, 06:00,            an unfenced Hellmann rain gauge at 12:00, 18:00, and 00:00,
09:00, 12:00, 15:00, 18:00, 21:00 UTC) since 1 August 1986.             06:00 of the following day, with the orifice 200 cm2 , placed
Daily time series of the relative humidity (RH) was calcu-              1 m above the ground level. The time series of the daily sum
lated as a mean of all available measurements within a partic-          of precipitation cover the period 1979–2018 with a gap in
ular day. There is a gap in the measurements from 1 July 1982           July 1982.
to 15 August 1982. Therefore the trend analyses were per-                  The influence of the West Spitsbergen Current creates a
formed for the period 1983–2018.                                        relatively moist climate in SW Spitsbergen region, which is
   The variability of the annual mean RH in the period 1983–            clearly reflected in the amount of precipitation. In compari-
2019 is presented in Fig. 3a. The average over the period               son to the other meteorological stations in Spitsbergen (Os-
1983–2018 is 79.7 %. The range of variability is from 75.7 %            uch and Wawrzyniak, 2017a; Hanssen-Bauer et al., 2019),
(2003) to 82.7 % in 1994. The trend analyses indicated a sta-           the annual amount reaching 477 mm is the highest. The vari-
tistically insignificant trend.                                         ability of the annual sums of precipitation in the period 1983–
   The course of the monthly mean RH in the period 1983–                2018 is shown in Fig. 4a. The amount of precipitation varies
2018 is presented in Fig. 3b. Higher values of mean RH are              from 230 mm in 1987 to 805.5 mm in 2016. The trend anal-
observed in warmer months of the year and lower during win-             yses indicated large changes, an increase of 61.6 mm per
ter. Such high values are attributed to continual dominance of          decade for the annual sums of precipitation.
marine air masses. The annual course of the RH is strongly                 The annual course of monthly sums of precipitation from
connected with the air temperature and shows typical vari-              the period 1983–2018 is presented in Fig. 4b. The driest
ability. It generally increases with warmer air temperatures.           months are April and May with averages of 23 and 24 mm
However, most of the trends are not statistically significant at        respectively. The highest precipitation is recorded in Septem-
the 0.05 level except March, June, and October.                         ber reaching on average 75 mm. Trend analyses presented in
   The analyses at daily timescale indicated that drops of RH           Table 2 indicate statistically significant changes in January
below 50 % are recorded rather sporadically, although these             (3.51 mm per decade), September (19.67 mm/decade), and
can occur throughout the year. Such situations are connected            October (13.53 mm per decade).
with advection of strongly cooled air masses, foehn effects,
or katabatic winds from Hansbreen (Marsz and Styszyńska,               3.4   The atmospheric pressure
2013). The minimum observed quantity reached 24 % on
15 January 1981. The maximum of the observed RH is equal                The measurements of the atmospheric pressure (PA) at Horn-
to 100 %. Such conditions occurred 27 times in the period               sund started in July 1978. In the beginning, PA was mea-
1979–2018.                                                              sured with a mercury barometer every 3 h. Since 2001 mea-
                                                                        surements have been conducted every 60 s with a Vaisala

www.earth-syst-sci-data.net/12/805/2020/                                                   Earth Syst. Sci. Data, 12, 805–815, 2020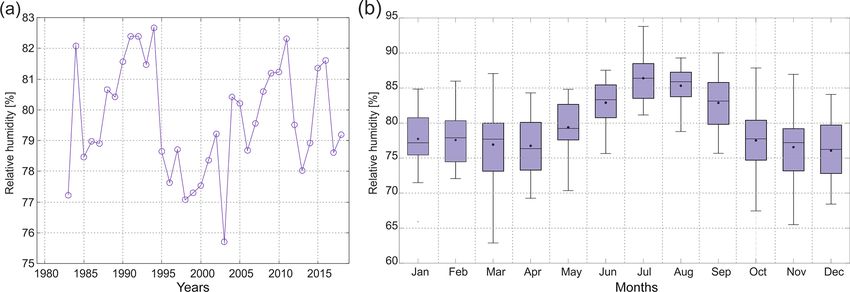
810                                                  T. Wawrzyniak and M. Osuch: A 40-year High Arctic climatological dataset

Figure 3. (a) Variability of an annual mean of relative humidity in 1983–2018 at Hornsund. (b) Variability of mean monthly relative humidity
in 1983–2018 at Hornsund.

Figure 4. (a) Variability of annual sums of precipitation in 1983–2018 at Hornsund. (b) Variability of mean monthly sums of precipitation
in 1983–2018 at Hornsund.

PTB200A sensor, replaced by BARO-1QML_AV in 2018.                       3.5    Wind speed and direction
The lowest recorded PA reduced to sea level at Hornsund
station was 982.2 hPa on 30 August 1994, while the absolute             The wind is a result of atmospheric circulation and is highly
maximum was 1028.5 hPa on 7 August 1987. Mean annual                    correlated with the intensity of cyclonic activity (Przybylak,
PA in long-term 1983–2018 is 1008.7 hPa, and its variabil-              2016). The wind regime results from the latitudinal shape of
ity is presented in Fig. 5a. An increasing trend (0.25 hPa per          the Hornsund fjord, location near the seashore and local to-
decade) is visible, but it is statistically insignificant (pval >       pography. The measurements of wind speed (WS) and wind
0.05).                                                                  direction (WD) were performed at Hornsund with different
   Figure 5b shows the variability of the mean monthly PA               sensors: 1978–2000 with the Fuess 90z wind meter, 2001–
over the period 1983–2018. Well-pronounced seasonality is               2017 with Vaisala WAA151 for direction and wind speed,
visible, with a mean monthly pressure higher than 1010 hPa              since 2018 with Ultrasonic Wind Sensor WMT702. At Horn-
from April to August. The month with the lowest mean PA is              sund station the height of the anemometer is 10 m above the
December with a mean of 1002.7 hPa, and the month with the              ground, around 20 m above sea level. WS is measured with
largest PA is May with a mean of 1015.7 hPa. The variability            an accuracy of 0.1 m s−1 and WD with 5◦ . The wind rose for
of mean monthly PA within the observation period also is                the Hornsund station is presented in Fig. 6. Winds blowing
visible with the largest variability in January and February            from the east, along the fjord, are prevailing.
(larger than 30 hPa) and the smallest in July (13.7 hPa). The              The variability of the mean annual WS at Hornsund in the
trend analyses of mean monthly PA resulted in a statistically           period 1983–2018 is shown in Fig. 7a. The average over the
insignificant trend for all months.                                     period 1983–2018 is equal to 5.5 m s−1 . The lowest values of
                                                                        WS were observed in 1985 (4.8 m s−1 ), while the largest ones

Earth Syst. Sci. Data, 12, 805–815, 2020                                                   www.earth-syst-sci-data.net/12/805/2020/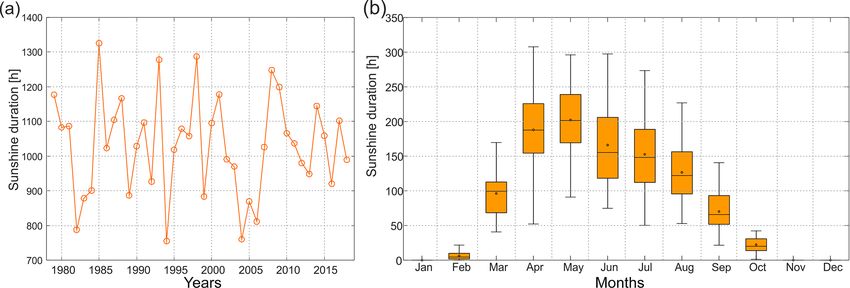
T. Wawrzyniak and M. Osuch: A 40-year High Arctic climatological dataset                                                          811

Figure 5. (a) Variability of mean annual air pressure reduced to sea level in 1983–2018 at Hornsund. (b) Variability of mean annual air
pressure reduced to sea level in 1983–2018 at Hornsund.

                                                                      and partly on the quantity of total solar energy. Daily SD
                                                                      is measured at Hornsund using a Campbell–Stokes sunshine
                                                                      recorder (CS). It uses a direct optical method with the heat
                                                                      energy of the Sun’s direct radiation burning the card. Such a
                                                                      traditional sunshine recorder has been in service worldwide
                                                                      since the 19th century; although there are multiple automatic
                                                                      radiometers used simultaneously at the Hornsund station, the
                                                                      longest data are recorded by CS. The time series of sunshine
                                                                      duration cover the period 1983–2018. At the Hornsund sta-
                                                                      tion, the polar night lasts 104 d (31 October–11 February),
                                                                      while the polar day lasts 117 d (24 April–18 August).
                                                                         Figure 8a shows the variability of the annual sums of SD
                                                                      at Hornsund in the period 1979–2018. The mean value is
                                                                      1030.8 h, which is about 28 % of the potential SD calculated
                                                                      for the station (Wojkowski et al., 2015). The large span in
                                                                      the annual SD is visible. The minimum value (755.4 h) was
                                                                      observed in 1994 and the maximum (1325.6 h) in 1985. The
                                                                      slightly decreasing trend in SD is visible but statistically in-
Figure 6. The wind rose for the Hornsund station for the period       significant at the 0.05 level.
1983–2018.                                                               Monthly total SD is presented in Fig. 8b. Its variability
                                                                      results from the different duration of the day at the location
                                                                      (latitude 77◦ N) with zero SD during the polar night.
were observed in 1998 (6.3 m s−1 ). There is a statistically
insignificant trend in mean annual WS.
   The variability of mean monthly WS in the period 1983–             3.7   Cloudiness
2018 is presented in Fig. 7b. WS regime is well visible with          Arctic clouds have a warming effect on the surface during
smaller average values during summer months (minimum                  most of the year because their effect of increasing the down-
4.0 m s−1 in June) and larger average values during winter            ward longwave radiation dominates their effect of reducing
(maximum 7.1 m s−1 in February). Such variability is a re-            the net solar radiation over high-albedo snow and ice sur-
sult of the extreme cyclone events that often occur during            faces. In summer, however, clouds typically have a cooling
Arctic winters (Rinke et al., 2017).                                  effect on surface types with a lower albedo, such as the open
                                                                      sea, melting sea ice, and ground (Intrieri et al., 2002; Shupe
3.6   Sunshine duration                                               and Intrieri, 2004). Observations of cloudiness at the Pol-
                                                                      ish Polar Station in Hornsund are conducted by meteorolo-
Sunshine duration (SD) is one of the important meteoro-               gists and describe the predominant sky condition based upon
logical variables that provides data on the time period dur-          octas (eighths) of the sky covered by opaque (not transpar-
ing which direct solar radiation reaches the Earth’s surface          ent) clouds. There are many factors that may hinder the het-

www.earth-syst-sci-data.net/12/805/2020/                                                Earth Syst. Sci. Data, 12, 805–815, 2020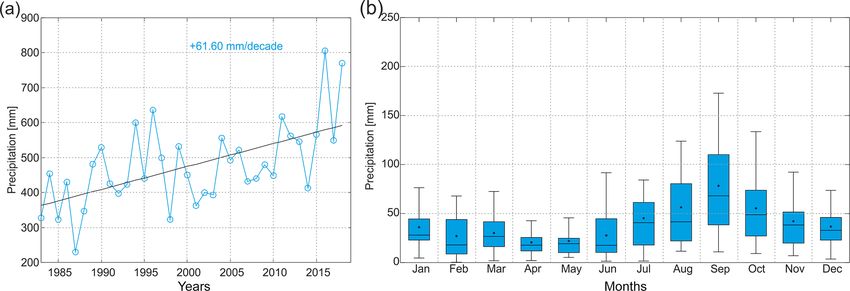
812                                                 T. Wawrzyniak and M. Osuch: A 40-year High Arctic climatological dataset

Figure 7. (a) Variability of mean annual wind speed in 1983–2018 at Hornsund. (b) Variability of the mean monthly wind speed at Hornsund
in the period 1983–2018.

Figure 8. (a) Variability of mean annual sunshine duration in 1979–2018 at Hornsund. (b) Variability of the monthly sums of sunshine
duration at Hornsund in the period 1979–2018.

erogeneity and evaluation of cloudiness, due to the annual            3.8   Visibility
change in the meteorological observers and the fact that ob-
servers might be subjective, although they are provided with          The horizontal visibility is quantified using observations
clear observable criteria.                                            made by meteorologists in the surroundings of the Hornsund
   Annual averages of cloudiness in the period 1983–2018              station with a marine scale that ranges from 1 to 9. The vi-
are presented in Fig. 9a. The mean over this period equals            sual observations are performed using known distances to
5.85 octas. The minimum value of annual mean was observed             the surrounding mountains and other objects. Values 1 and
in 1988 (5.16 octas) and the maximum in 1984 (6.39 octas).            2 correspond to very bad visibility, 0–50 and 50–200 m, re-
An increasing tendency of mean annual cloudiness is visible.          spectively. Bad visibility (200 m–1 km) is represented by a
The estimated trend (slope 0.13 octas per decade) is statisti-        value of 3. Weak horizontal visibility represents conditions
cally significant at the 0.05 level.                                  with 1–2 and 2–4 km that are quantified as 4 and 5 in the ap-
   The variability of the monthly cloudiness in the period            plied scale. Moderate horizontal visibility, described as 6 in
1983–2018 is presented in Fig. 9b. The annual cycle is char-          the scale, represents conditions when an object or light can
acterised by lower mean cloudiness during the cold period             be clearly discerned from 4 to 10 km. Good horizontal visi-
from October till April (5.5–6.0 octas), and this period is           bility (7 in the scale) is 10–20 km, very good (8) 20–50 km,
also characterised by large interannual variability. The period       and extremely good (9) is for horizontal visibility larger than
from May till September is on average cloudier (6.0–6.7 oc-           50 km. Noted visibility might be reduced by multiple factors,
tas), and interannual variability is lower.                           including all products of the condensation of water vapour
                                                                      such as fog, precipitation, and darkness during cloudy con-
                                                                      ditions throughout the polar night, as there are no artificial

Earth Syst. Sci. Data, 12, 805–815, 2020                                                 www.earth-syst-sci-data.net/12/805/2020/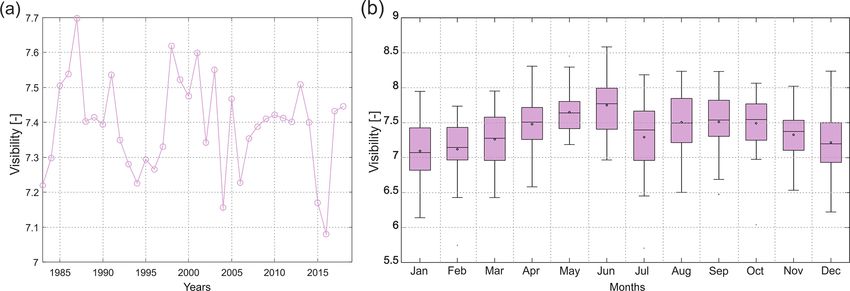
T. Wawrzyniak and M. Osuch: A 40-year High Arctic climatological dataset                                                              813

Figure 9. (a) Variability of mean annual cloudiness in 1983–2018 at Hornsund. (b) Variability of the monthly sums of cloudiness at Hornsund
in the period 1983–2018.

Figure 10. (a) Variability of mean annual visibility in 1983–2018 at Hornsund. (b) Variability of the mean monthly visibility at Hornsund
in the period 1983–2018.

lights in the area. There are no anthropogenic factors that             4   Quality control of the time series
would reduce visibility in the vicinity of the Hornsund sta-
tion as it is located in the middle of the strictly protected           All presented datasets have undergone a thorough quality
South Spitsbergen National Park. Due to that, reduced visi-             control process. Such a process consisted of multiple steps as
bility cannot be an indicator of poor air quality on the local          the measurements may not be homogenous due to the vary-
scale.                                                                  ing number of observations during the day, changes of sen-
   Figure 10a shows the variability of mean annual visibil-             sors, and other factors (Estévez et al., 2011). In the first step,
ity in the period 1983–2018. On average in this period, there           the data were visualised as a time series that allowed verifi-
is good horizontal visibility that amounts to 7.40; minimum             cation if all data had been collected and the record structure
mean annual visibility was observed in 2016 (7.08), while               were correct, complete, and without any gaps. In this way
a maximum was observed in 1987 (7.70). A decreasing ten-                also the presence of outliers and step change in the data was
dency is visible (slope of trend −0.02 per decade); however             tested. To determine the degree of compatibility and homo-
the trend is statistically insignificant at the 0.05 level. Vari-       geneity of the measurements from different sensors, which
ability of the mean monthly visibility at Hornsund in the pe-           changed over the years, the old and new sensors were op-
riod 1983–2018 is presented in Fig. 10b. It is characterised            erated simultaneously for more than 1 year. The results al-
by both low interannual and interseasonal variability and on            lowed us to combine time series. In the following step, dif-
average reaches values between 7 and 8.                                 ferent variables were compared to test the internal consis-
                                                                        tency between variables. Such analyses include a comparison
                                                                        of minimum, mean, and maximum daily TA that follow the

www.earth-syst-sci-data.net/12/805/2020/                                                   Earth Syst. Sci. Data, 12, 805–815, 2020
814 T. Wawrzyniak and M. Osuch: A 40-year High Arctic climatological dataset
rule TAmax > TAmean > TAmin . In the case of WS and WD, Acknowledgements. The authors would like to kindly thank
the following conditions were tested: WS = 0 and WD = 0, the meteorological staff from the Polish Polar Station Horn-
WS 6 = 0 and WD 6 = 0. In the third step temporal consistency sund (listed here: https://hornsund.igf.edu.pl/about-the-station/
of time series was analysed with the help of statistical tests expeditions/, last access: 1 April 2020) for collecting the data and
of homogeneity (Pettit and the standard normal homogene- maintaining the meteorological monitoring. The authors also thank
the two anonymous reviewers for valuable comments and sugges-
ity test). In the last step, the same variables but from differ-
tions. Financial support for this work was provided by the Polish
ent meteorological stations in Svalbard were compared. The National Science Centre through grant no. 2017/27/B/ST10/01269.
air temperature time series were tested against observations This work was also partially supported by the Institute of Geo-
in Barentsburg, Bjørnøya, Hopen, Longyearbyen (Svalbard physics, Polish Academy of Sciences within statutory activities no.
Lufthavn), Ny Ålesund, and Sveagruva. For that purpose, the 3841/E-41/S/2020 of the Ministry of Science and Higher Education
data were visualised and checked with the standard normal of Poland.
homogeneity test (Alexandersson, 1986; Nordli et al., 1996).
The applied algorithm showed good performance in both de-
tecting breakpoints and identifying homogeneous time se- Financial support. This research has been supported by the Pol-
ries. By application of the relative method, with comparison ish National Science Centre (grant no. 2017/27/B/ST10/01269) and
to the other available datasets from Svalbard, the gradual and the Ministry of Science and Higher Education of Poland (grant no.
step changes due to climate change were not found to be a 3841/E-41/S/2020).
source of inhomogeneity.
Review statement. This paper was edited by Jens Klump and re-
5 Data availability viewed by two anonymous referees.
The dataset described in this article is
available on the PANGAEA repository
(https://doi.org/10.1594/PANGAEA.909042, Wawrzyniak References
and Osuch, 2019).
Alexandersson, H.: A homogeneity test applied
to precipitation data, J. Climatol., 6, 661–675,
6 Summary https://doi.org/10.1002/joc.3370060607, 1986.
Araźny, A., Przybylak, R., Wyszyński, P., Wawrzyniak, T.,
This paper has presented details of a long-term (1979–2018) Nawrot, A., and Budzik, T.: Spatial variations in air temper-
dataset from the meteorological site at the Polish Polar Sta- ature and humidity over Hornsund fjord (Spitsbergen) from
tion Hornsund located in the SW part of Spitsbergen. The 1 July 2014 to 30 June 2015, Geogr. Ann. A, 100, 27–43,
data series includes daily, monthly, and annual air tempera- https://doi.org/10.1080/04353676.2017.1368832, 2018.
ture, PDD, NDD, the sum of precipitation, air humidity, at- Błaszczyk, M., Jania, J. A., and Kolondra, L.: Fluctuations of tide-
water glaciers in Hornsund Fjord (Southern Svalbard) since the
mospheric pressure, wind speed and direction, sunshine du-
beginning of the 20th century, Pol. Polar Res., 34, 327–352,
ration, cloudiness, and visibility. This rich dataset, now avail- https://doi.org/10.2478/popore-2013-0024, 2013.
able online, is a valuable source for documenting the state of Dahlke, S., Hughes, N. E., Wagner, P. M., Gerland, S., Wawrzy-
the climate in SW Spitsbergen, which represents the Atlantic niak, T., Ivanov, B., and Maturilli, M.: The observed recent
sector of the Arctic. With the positive trend of mean annual surface air temperature development across Svalbard and con-
temperature of +1.14 ◦ C per decade in the last four decades curring footprints in local sea ice cover, Int. J. Climatol.,
(1979–2018), the climate in Hornsund is warming in this pe- https://doi.org/10.1002/joc.6517, online first, 2020.
riod more than 6 times higher than the global average, which Estévez, J., Gavilán, P., and Giráldez, J. V.: Guidelines
amounts to +0.17 ◦ C per decade (NOAA, 2020). All clima- on validation procedures for meteorological data from
tological variables presented in this study have many envi- automatic weather stations, J. Hydrol., 402, 144–154,
ronmental implications, and there are both broad scientific https://doi.org/10.1016/j.jhydrol.2011.02.031, 2011.
Gjelten, H. M., Nordli, Øyvind, Isaksen, K., Førland, E.J.,
interest and societal need to understand climate variability
Sviashchennikov, P. N., Wyszynski, P., Prokhorova, U. V.,
and its influence on geoecosystems. Przybylak, R., Ivanov, B. V., and Urazgildeeva, A. V.:
Air temperature variations and gradients along the coast
and fjords of western Spitsbergen, Polar Res., 35, 29878,
Author contributions. TW and MO wrote the paper and carried https://doi.org/10.3402/polar.v35.29878, 2016.
out the data processing and analysis. Hamed, K. H. and Rao, R.: A modified Mann-Kendall trend test for
autocorrelated data, J. Hydrol., 204, 182–196, 1998.
Hanssen-Bauer, I., Førland, E. J., Hisdal, H., Mayer, S., Sandø, A.
Competing interests. The authors declare that they have no con- B., Sorteberg, A., Adakudlu, M., Andresen, J., Beldring, S., Ben-
flict of interest. estad, R., Bilt, W., Bogen, J., Borstad, C., Breili, K., Breivik,
Ø., Børsheim, K. Y., Christiansen, H. H., Dobler, A., Engeset,
Earth Syst. Sci. Data, 12, 805–815, 2020 www.earth-syst-sci-data.net/12/805/2020/T. Wawrzyniak and M. Osuch: A 40-year High Arctic climatological dataset 815 R., Frauenfelder, R., Gerland, S., Gjelten, H. M., Gundersen, J., Przybylak, R.: The climate of the Arctic, Atmospheric and Oceano- Isaksen, K., Jaedicke, C., Kierulf, H., Kohler, J., Li, H., Lutz, J., graphic Sciences Library 52, Heidelberg, Springer, 2nd Edn., 287 Melvold, K., Mezghani, A., Nilsen, F., Nilsen, I. B., Nilsen, J. pp., https://doi.org/10.1007/978-3-319-21696-6, 2016. E. Ø., Pavlova, O., Ravndal, O., Risebrobakken, B., Saloranta, Rinke, A., Maturilli, M., Graham, R. M., Matthes, H., Handorf, T., Sandven, S., Schuler, T. V., Simpson, M. J. R., Skogen, M., D., Cohen, L., Hudson, S. R., and Moore, J. C.: Extreme cy- Smedsrud, L. H., Sund, M., Vikhamar-Schuler, D., Westermann, clone events in the Arctic: Wintertime variability and trends, S., and Wong, W. K.: Climate in Svalbard 2100 – a knowledge Environ. Res. Lett., 12, 094006, https://doi.org/10.1088/1748- base for climate adaptation. Norwegian Centre for Climate Ser- 9326/aa7def, 2017. vices, Report no. 1/2019, ISSN 2387-3027, 205 pp., 2019. Sen, P. K.: Estimates of the regression coefficient based Intrieri, J. M., Fairall, C. W., Shupe, M. D., Persson, P. O. G., An- on Kendall’s tau, J. Am. Stat. Assoc., 63, 1379–1389, dreas, E. L., Guest, P., and Moritz, R. M.: An annual cycle of https://doi.org/10.2307/2285891, 1968. Arctic surface cloud forcing at SHEBA. J. Geophys. Res., 107, Shupe, M. D. and Intrieri, J. M.: Cloud radiative forc- 8039, https://doi.org/10.1029/2000JC000439, 2002. ing of the Arctic surface: The influence of cloud IPCC: The Ocean and Cryosphere in a Changing Climate, available properties, surface albedo, and solar zenith angle, J. at: https://www.ipcc.ch/srocc/home/ (last access: 1 April 2020), Climate, 17, 616–628, https://doi.org/10.1175/1520- 2019. 0442(2004)0172.0.CO;2, 2004. Kendall, M. G.: Rank Correlation Methods, Charles Griffin, Lon- van Pelt, W., Pohjola, V., Pettersson, R., Marchenko, S., Kohler, don, 1975. J., Luks, B., Hagen, J. O., Schuler, T. V., Dunse, T., Noël, Lindner, L., Marks, L., Roszczynko, W., and Semil, J.: Age of raised B., and Reijmer, C.: A long-term dataset of climatic mass bal- marine beaches of northern Hornsund Region, South Spitsber- ance, snow conditions, and runoff in Svalbard (1957–2018), The gen, Pol. Polar Res., 12, 161–182, 1991. Cryosphere, 13, 2259–2280, https://doi.org/10.5194/tc-13-2259- Mann, H.: Nonparametric tests against trend, Econometrica, 13), 2019, 2019. 245–259, https://doi.org/10.2307/1907187, 1945. Vihma, T., Screen, J., Tjernström, M., Newton, B., Zhang, X., Marsz, A. A. and Styszyńska, A.: Climate and Climate change Popova, V., Deser, C., Holland, M., and Prowse, T.: The atmo- at Hornsund, Svalbard, Gdynia Maritime University, Gdynia, spheric role in the Arctic water cycle: A review on processes, past Poland, 2013. and future changes, and their impacts, J. Geophys. Res.-Biogeo., NOAA: National Centers for Environmental information, Climate 121, 586–620, https://doi.org/10.1002/2015JG003132, 2016. at a Glance, Global Time Series, available at: https://www.ncdc. Walczowski, W., Beszczynska-Möller, A., Wieczorek, P., Merchel, noaa.gov/cag/, last access: 27 February 2020. M., and Grynczel, A.: Oceanographic observations in the Nordli, Ø., Przybylak, R., Ogilvie, A. E. J., and Isaksen, K.: Long- Nordic Sea and Fram Strait in 2016 under the IO PAN long- term temperature trends and variability on Spitsbergen: the ex- term monitoring program AREX, Oceanologia, 59, 187–194, tended Svalbard Airport temperature series, 1898–2012, Polar https://doi.org/10.1016/j.oceano.2016.12.003, 2017. Res., 33, 21349, https://doi.org/10.3402/polar.v33.21349, 2014. Wawrzyniak, T. and Osuch, M.: A consistent High Arc- Nordli, P. Ø., Hanssen-Bauer, I., and Førland, E. J.: Homogene- tic climatological dataset (1979–2018) of the Polish Polar ity Analyses of Temperature and Precipitation Series from Sval- Station Hornsund (SW Spitsbergen, Svalbard), PANGAEA, bard and Jan Mayen, Norwegian Meteorol. Inst. Report 16/96 https://doi.pangaea.de/10.1594/PANGAEA.909042, 2019. KLIMA, 41 pp., 1996. Wawrzyniak, T., Osuch, M., Napiórkowski, J. J., and Westerman, Osuch, M. and Wawrzyniak, T.: Climate projections in the Horn- S.: Modelling of the thermal regime of permafrost during 1990– sund area, Southern Spitsbergen, Pol. Polar Res., 37, 379–402, 2014 in Hornsund, Svalbard, Pol. Polar Res., 37, 219–242, https://doi.org/10.1515/popore-2016-0020, 2016. https://doi.org/10.1515/popore-2016-0013, 2016. Osuch, M. and Wawrzyniak, T.: Inter- and intra-annual changes Wawrzyniak, T., Osuch, M., Nawrot, A., and Napiórkowski, of air temperature and precipitation in western Spitsbergen, Int. J. J.: Run-off modelling in an Arctic unglaciated catch- J. Climatol., 37, 3082–3097, https://doi.org/10.1002/joc.4901, ment (Fuglebekken, Spitsbergen), Ann. Glaciol., 58, 36–46, 2017a. https://doi.org/10.1017/aog.2017.8, 2017. Osuch, M. and Wawrzyniak, T.: Variations and changes Wojkowski, J., Caputa, Z., and Leszkiewicz, J.: The impact of re- in snow depth at meteorological stations Barentsburg lief on the diversity of possible sunshine duration at Hornsund and Hornsund (Spitsbergen), Ann. Glaciol., 58, 11–20, region (SW Spitsbergen), Problemy Klimatologii Polarnej, 25, https://doi.org/10.1017/aog.2017.20, 2017b. 179–190, 2015. Osuch, M., Wawrzyniak, T., and Nawrot, A.: Diagnosis of the hydrology of a small Arctic permafrost catchment using HBV conceptual rainfall-runoff model, Hydrol. Res., 50, 459–478, https://doi.org/10.2166/nh.2019.031, 2019. www.earth-syst-sci-data.net/12/805/2020/ Earth Syst. Sci. Data, 12, 805–815, 2020
You can also read