A Comparison of Emotion Annotation Approaches for Text - MDPI
←
→
Page content transcription
If your browser does not render page correctly, please read the page content below
Article
A Comparison of Emotion Annotation Approaches
for Text
Ian D. Wood 1,2     ID
                         , John P. McCrae 1 , Vladimir Andryushechkin 1 and Paul Buitelaar 1, *
 1   Insight Centre for Data Analytics, National University of Ireland Galway, Galway H91 AEX4, Ireland;
     ian.wood@insight-centre.org (I.D.W.); john.mccrae@insight-centre.org (J.P.M.);
     vladimir.andryushechkin@insight-centre.org (V.A.)
 2   Aylien Ltd., Dublin D02 RH68, Irenland; ian@aylien.com
 *   Correspondence: paul.buitelaar@insight-centre.org

 Received: 27 March 2018; Accepted: 9 May 2018; Published: 11 May 2018

 Abstract: While the recognition of positive/negative sentiment in text is an established task with
 many standard data sets and well developed methodologies, the recognition of a more nuanced
 affect has received less attention: there are few publicly available annotated resources and there are
 a number of competing emotion representation schemes with as yet no clear approach to choose
 between them. To address this lack, we present a series of emotion annotation studies on tweets,
 providing methods for comparisons between annotation methods (relative vs. absolute) and between
 different representation schemes. We find improved annotator agreement with a relative annotation
 scheme (comparisons) on a dimensional emotion model over a categorical annotation scheme on
 Ekman’s six basic emotions; however, when we compare inter-annotator agreement for comparisons
 with agreement for a rating scale annotation scheme (both with the same dimensional emotion
 model), we find improved inter-annotator agreement with rating scales, challenging a common belief
 that relative judgements are more reliable. To support these studies and as a contribution in itself,
 we further present a publicly available collection of 2019 tweets annotated with scores on each of four
 emotion dimensions: valence, arousal, dominance and surprise, following the emotion representation
 model identified by Fontaine et al. in 2007.

 Keywords: emotion; annotation; annotator-agreement; social-media; affective-computing

1. Introduction
      Detection of affect in online social media and other text based sources forms an important part of
understanding the behaviour and choices of people, and has found widespread application in business
reputation management, understanding public preferences and choices in a political setting as well as
research into human behaviour [1,2].
      Research effort in the recognition of affect in text has focussed to a large extent on recognition
of positive/negative sentiment, while more nuanced emotion representation models have received
relatively little attention. In particular, there has been a lack of quality annotated resources for model
building and evaluation in that space [2]. Although recent years have seen a surge of interest [3–7],
there remains a lack of resources annotated with a dimensional emotion representation.
      Beyond simple positive/negative sentiment, there are two main emotion representation schemes
that have been used in automated emotion recognition research. The first posits the existence of
“basic” emotions or emotion categories to which all other emotions belong, for example the six
emotions categories identified by Ekman [8]: joy, fear, anger, disgust, sadness and surprise. The second
envisages each emotional state as a point in a dimensional space, each dimension corresponding
to a characteristic of the emotion, the most widely used model presenting three dimensions [9,10]:

Information 2018, 9, 117; doi:10.3390/info9050117                          www.mdpi.com/journal/information
Information 2018, 9, 117 2 of 13
Valence (also termed evaluation-pleasantness), Dominance (also termed potency-control) and Arousal
(also termed activation-arousal, a level of physical energy and action tendency). The acronym “VAD” is
often used for this representation scheme. The question of which dimensions most effectively capture
variation in emotional states was recently re-opened by Fontaine et al. [11], who identified those same
three dimensions (though with higher importance attributed to Dominance) with one extra: Surprise or
unpredictability—we use “VADS” as a shorthand for this scheme.
Existing text corpora with dimensional emotion annotations include Affective Norms for English
Texts [12], a collection of 120 generic texts with VAD annotations; a collection of 2895 Facebook
posts annotated by just two annotators with valence and arousal dimensions [13]. Yu et al. [14]
presented a collection of 2009 Chinese sentences from various online texts, again annotated with
valence and arousal only. Subsequent to our annotation efforts, several further annotated data
sets have been published: EMOBANK [6], a collection of ten thousand texts from diverse sources,
but not including tweets, and data for the upcoming “Affect in Tweets” task for SemEval 2018
(http://alt.qcri.org/semeval2018), which presents tweets annotated for valence, arousal and
dominance in English, Spanish and Arabic. In addition, two recent data sets annotated with emotion
intensity in four Ekman emotion categories have also been released: data for the EmoInt emotion
intensity detection shared task [3], with 1500 to 2000 English tweets for each of the four Ekman
emotions joy, anger, sadness and fear as well as data for SemEval 2018 Task 1 [4] 26,000 English,
17,000 Spanish, 12,000 Arabic tweets with the same emotion scheme.
Several approaches to annotating emotion expressed in text on a continuous scale have been used.
Probably the most common utilises an ordinal scale, such as SAM (self assessment manikins) [15].
It has been argued that human estimations of relative values are more consistent than when assigning
an absolute value [16–18]. To address this, Martinez et al. [19] suggest that ranked annotations
not be treated as absolute values, and instead treated as ordinal, and used, for example, to train
ranking estimators. Another approach is to perform relative annotations directly, such as best/worst
scaling, where the highest and lowest ranked tweets are chosen from a set of four [20]. Pairwise tweet
comparisons are another option; however, we are not aware of this approach being used previously
in the emotion annotation literature as it requires a large number of annotations to acquire a
reasonable ranking.
In order to compare annotator agreement between disparate annotation schemes, novel annotation
metrics were developed built on common principals of annotation discrepancy (see Section 2.1).
The pilot study and reanalysis of categorical annotation data from previous work [21] indicated
improved annotator agreement with a relative annotation scheme (tweet comparisons) on a
dimensional emotion representation system compared to categorical annotations of Ekman’s six
basic emotions. Annotator agreement for final round pairwise comparisons was similar to that for
the 5-point rating scale, and when considered as ordinal annotations and converted into pairwise
comparisons, agreement was noticeably better. These results challenge the notion that relative human
judgements are more reliable than absolute judgements.
As a further comparison of annotation schemes, our annotated data alongside two recently
published data sets [3,20] were analysed for the cognitive complexity of the annotation tasks using
the time taken by reliable crowd-sourced annotators as a proxy. We found that best/worst scaling
(choosing the highest and lowest from a set of four examples) required between 3 and 3.5 times the
effort per annotation item to both relative and absolute annotation schemes, which exhibited similar
effort per item (with relative marginally higher—see Section 3).
To support the comparisons of annotation methodologies and as a contribution in itself, we present
a collection of 2019 tweets annotated following the four dimensional emotion representation scheme
of Fontaine et al. [11]. We further assess the relative merits of annotations on a ranking scale vs.
comparisons, providing annotations using both a 5-point ranking scale and pairwise comparisons
(http://140.203.155.26/mixedemotions/datasets/4dEmotionInTweets.tar.gz). An initial pilot study
with in-house volunteers was performed to compare pairwise tweet comparisons to best/worstInformation 2018, 9, 117 3 of 13
scaling. We found that best/worst scaling required significantly more effort and indeed our annotators
preferred the pairwise comparison option, so for the final annotation round, best/worst scaling
was dropped.
The remainder of this paper is organised as follows: Section 2 presents novel annotation distance
metrics that allow comparison of annotator agreement between the annotation schemes and the
agreement scores obtained. Section 3 presents an analysis of the cognitive complexity of annotation
tasks. Section 4 describes the collected data and data cleaning strategies. Section 5 concludes with an
overview of the principle results.
2. Annotator Agreement Comparisons
We wished to assess the relative merits of different annotation schemes and target emotion
representation schemes. In order to assess annotation with categorical emotion schemes, we drew
upon data from previous annotation projects (see Section 2.2) for comparison.
To obtain comparisons of annotator agreement between categorical annotations and dimensional
annotations, we utilised Krippendorffs’ Alpha, a measure of agreement for which computed reliabilities
are comparable across any numbers of coders, values, different metrics, and unequal sample sizes.
To apply Krippendorffs’ Alpha to the various annotation scenarios, we developed conceptually
similar metrics of annotator disagreement for the respective annotation schemes. We attempt to link
these metrics through arguments around the nature of annotator judgements and through ensuring the
metrics operate on a similar scale (i.e., values for conceptually similar annotation differences should be
the same). In this work, we do not attempt to empirically evaluate these disagreement metrics beyond
comparison of agreement values on the presented data sets.
2.1. Annotation Difference Metrics
2.1.1. Categorical Annotations (Multiple Categories Allowed)
There are several metrics that have been applied to categorical annotations with multiple
categories allowed. The Jacccard set similarity metric [22] is the ratio between the sizes of the
intersection and union of the sets. Passonneau [23] observed that, if one annotator is inclined to
provide, in general, more labels than another annotator, you should consider any extra labels from the
prolific annotator as less indicative of disagreement, proposing a simple difference metric that attempts
to capture this idea (see below). Passonneau later proposed a combination of the two metrics [24],
capturing the granularity of the Jaccard metric and the motivating principle of his previous proposal.
He named this metric MASI (Measuring Agreement on Set-valued Items). In the formulae below, A and
B refer to two annotations of a data element (tweet in our case), with each a set of annotated categories:
| A ∩ B|
Jacc( A, B) = 1 − ,
| A ∪ B|
0, A = B,
A ⊂ B or B ⊂ A,
0.3,
Pass( A, B) =
0.6, A ∩ B 6= ∅,
1, A ∩ B = ∅,
Masi( A, B) = 1 − Jacc( A, B) × Pass( A, B).
Another scenario, where the above metrics could be seen as overly pessimistic, is as follows:
in cases where an annotator feels strongly about one or two labels, but adds some others with less
conviction, the annotation scheme is unable to represent the situation. If we assume that agreed
labels are most likely the labels that the annotators felt strongly about, we would consider any other
annotated labels to indicate only mild disagreement, even if both annotators indicated an emotionInformation 2018, 9, 117 4 of 13
distinct from the other annotator (hence Passonneau would give a high dissimilarity of 0.6). Motivated
by this observation, we developed a new difference metric: the average proportion of unmatched
annotations between the two annotated sets. Again, A and B refer to sets of chosen categories by each
of two annotators for a given tweet or other data element. A\ B, the complement of B with respect to
A, represents the set of elements of A that are not in B:
| A \ B| | B \ A|
1
Wood( A, B) = + .
2 | A| | B|
2.1.2. Relative Dimensional Annotations
For relative emotion annotations, we can use a naive difference metric (simply if the annotations differ).
(
0, x = y,
Naive( x, y) =
1, x 6= y.
Following a similar intuition to the above metrics, we also develop a second difference metric for
relative annotations. The situation here is somewhat simplified—there are three annotation options:
the first tweet, about the same and the second tweet. Following the intuition that, when the tweet
authors are actually close on the annotated emotion scale, one annotator may be more inclined to
choose “About the same” where another may prefer to choose one tweet or the other. In such cases,
the annotations can be taken to differ little, and we score such situations with a difference of 0.2:
distance(first, second) = 1,
distance( x, x ) = 0,
distance(same, x ) = 0.2.
2.1.3. Rating Scale Annotations
In this case, a naive distance metric simply considers annotations that differ to have distance 1
(in the Naive row in Table 1). A more natural difference metric would be the difference between
annotations taken as numerical values, scaled to lie between 0 and 1 to match the distance metrics
defined above (in the Novel row in Table 1). It has been suggested that ranking scale annotations
are better treated as ordinal [19], where annotations from each annotator are treated as a ranking of
annotated items. When seen in this way, we can consider each pair of tweets annotated by a given
annotator as a pairwise comparison. If they are ranked at the same level, we treat them as “About
the Same”.
2.2. Annotator Agreement
To compare categorical annotation to dimensional relative annotations, we obtained annotation
data from [21], where 360 tweets containing at least one of a set of 62 commonly used emoji were
annotated for Ekmans six emotion categories. Though the number of tweets is low, there were
17 annotators who annotated between 60 and 360 tweets each. Table 2 summarises Krippendorffs’ alpha
values using the above distance metrics for this data. Table 1 presents Krippendorffs’ alpha values using
metrics for dimensional annotations on data from the primary study. Table 3 presents a breakdown of
Krippendorffs’ alpha values for individual emotion dimensions (using the “novel” metrics).
Notice that the rating scale and comparison annotation agreement scores (with novel metric) are
higher than for the categorical annotations even given the optimistic nature of the new annotation
metrics. This confirms the supposition that the annotating on a single emotion scale is a simpler task
than choosing multiple emotions’ categories.
It has been observed that humans agree more when describing emotions in relative terms [16,18],
where relative judgements of valence and arousal were found to be more reliable. Our results challengeInformation 2018, 9, 117 5 of 13
that notion, at least for valence and arousal (Table 3), where agreement for rating scale annotations
was higher than direct comparisons. We can only hypothesise as to why this should be the case;
for example, the increased complexity of judging two texts, leaving a deeper analysis to further study.
Surprisingly, we do find a drop in agreement with a rating scale for dominance and in particular
surprise, supporting the general notion that human relative judgement is more reliable. When rating
scale annotations are converted to comparisons, we can see that this drop is substantially reduced.
Of particular interest is the improved agreement when rating scale annotations are considered
as ordinal (as per [17]) and converted to pairwise comparisons, and also the higher agreement when
treated this way than direct comparisons, despite the substantially larger number of pairs that result
n ( n −1)
(an annotator providing n rating scale annotations results in 2 comparisons). Agreement for
arousal and in particular valence is notably higher than the other dimensions as has been seen in other
studies; however, it is interesting to note that the discrepancy is less for comparisons and when rating
scale annotations are considered ordinal and converted to comparisons.
Table 1. Overall Krippendorffs’ Alpha for primary study (continuous emotion scale) with different
metrics of annotation distance.
Rating Scale
Metric Comparisons Rating Scale
(As Comparisons)
Naive 0.39 0.41 0.39
Novel 0.45 0.47 0.51
Table 2. Krippendorffs’ Alpha for categorical emotion annotations on emoji tweets with different
metrics of annotation distance.
Metric Categorical
Wood 0.33
Masi 0.30
Jaccard 0.31
Passonneau 0.32
Table 3. Krippendorffs’ Alpha for primary study: comparison of emotion dimensions with the novel
distance metric.
Rating Scale
Emotion Dimension Comparisons Rating Scale
(As Comparisons)
Valence 0.52 0.63 0.70
Arousal 0.45 0.49 0.60
Dominance 0.43 0.37 0.40
Surprise 0.40 0.23 0.38
3. Cognitive Complexity of Annotation Tasks
It is clear that different emotion annotation tasks will require different amounts of mental energy.
More complex tasks such as best/worst scaling [25,26] will require more time and effort than simpler
tasks such as a 5-point rating scale. In order to quantify these differences, we used the time taken by
crowd-sourced annotators as a proxy for required cognitive effort.
The data used for the analysis is summarised in Table 4 and consists of: the MixedEmotions
tweet data set (see Section 4) with annotations on each of valence, arousal, dominance and
surprise/unpredictability (VADS) and in each of two annotations schemes: a 5-point scale for single
tweets and pairwise comparisons; words and short phrases annotated for sentiment in two annotationInformation 2018, 9, 117 6 of 13
schemes: a 9-point scale and best-worst annotations [20]; the EmoInt 2017 tweet dataset [3] annotated
for intensity in four Ekman emotions (joy, fear, anger and sadness) with a best-worst scheme.
Table 4. Data sets and number of annotations used for cognitive complexity analysis. All emotion
representations on a continuous or ordinal scale. VADS refers to valence, arousal, dominance, surprise.
Emotion Binary Best-Worst
Data Set Rating Scale
Representation Comparisons Scaling
MixedEmotions [27] VADS 43,899 47,576 —
MixedEmotions Pilot Study [27] VADS 745 — 258
Sentiment Best/Worst [20] Sentiment — 66,577 59,900
WASSA 2017 [3] 4xEkman — — 51,861
These data sets were all annotated using the CrowdFlower platform (www.crowdflower.com),
which provides time stamps for the initial view of a set of annotation tasks by an annotator and when
the set of tasks has been completed. Timing for individual tasks is not provided. The maximum
number of tasks in each set is specified by the designer of the annotation project, but the actual number
of tasks may on occasion be less. It is possible, however, to determine the number of tasks in a set,
and thus assign the average time taken per item to each item of the set as an unbiased estimate of the
actual time taken.
An important question to consider is how representative the time taken for a task is of the true
cognitive complexity of a task. There are two ways the timing data may be corrupted: annotations
done in less time than is required by the task complexity (i.e., annotators cheating) and annotations
that took more time than that required (i.e., annotators distracted by external events during task
annotation). CrowdFlower provides several measures to ensure bona-fide annotations. Primarily,
test tasks with known correct answers are interspersed in the annotation process—annotators that fail
to answer a sufficient proportion of these tasks correctly are removed from the data and prevented from
further annotations. CrowdFlower also monitors the time taken for task completion, and, for example,
removes annotators that complete tasks too quickly as well as other heuristics to detect cheating.
Given that CrowdFlower’s measures to ensure bona-fide annotations are effective, as can be largely
verified by examination of the annotations, a task can not be completed in less time than that required
by its complexity.
On the other hand, annotators who become distracted by external events during annotation of a
set of tasks, leading to the elapsed time being greater than what is required by the complexity of the
tasks, cannot be ruled out without extensive and expensive controlled experiments. Indeed, the small
proportion of long duration annotation times suggests that such an effect may indeed be present in the
data. To counter this effect, we propose to consider the mode and median annotation times, as these
are relatively robust to such outliers.
The distribution of timings for the various data sets is presented in Figure 1. The time stamps
for best-worst sentiment annotations provided only to the minute accuracy, raising the question of
bias due to rounding; however, since the elapsed time is a difference between two such rounded time
stamps, that bias is removed. Due to the resulting granularity of resulting time differences, we plot
kernel density estimates in Figure 1.Information 2018, 9, 117 7 of 13
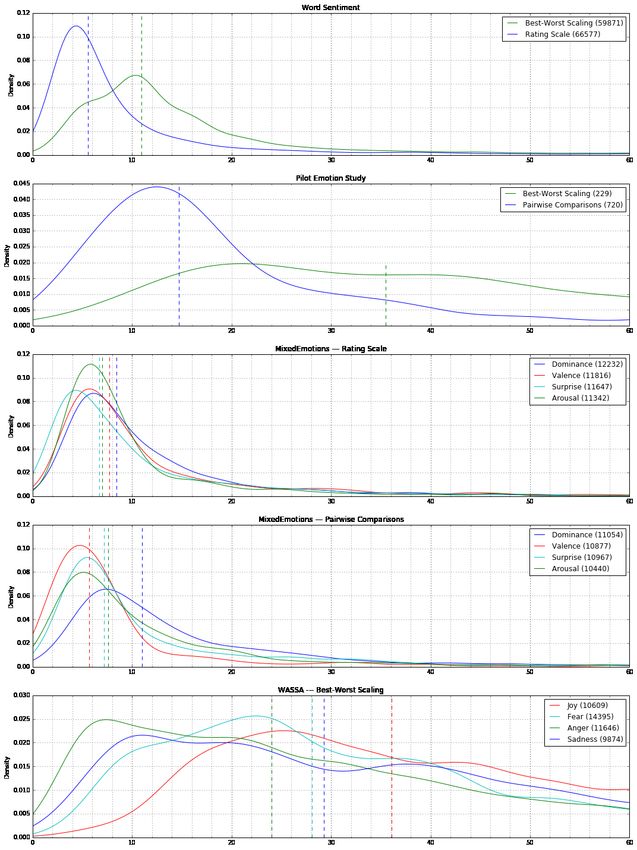
Figure 1. Kernel density estimates of distributions of annotation times. Dotted lines indicate median
time per task, number of annotations in parentheses.
For both the word sentiment and pilot emotion study annotations, best-worst scaling required
approximately twice the time to annotate than rating scale and pariwise comparison annotations
respectively. Though the number of data points is low, in the pilot study, the ratio appears somewhat
larger, as may be expected given the simpler 5-point (vs. 9-point) rating scale, and the overall time
taken is also larger as may be expected by the more complex task of evaluating tweets vs. words andInformation 2018, 9, 117 8 of 13
short phrases. Though the emotion representation differed, the relatively consistent time required
across emotion dimensions suggests that best/worst scaling for emotion annotation of tweets requires
three to three and a half times the effort than annotation on a 5-point scale. Pairwise comparisons
required a similar effort to 5-point scale annotations.
It is interesting to note the difference between emotion categories/dimensions. For 5-point
estimation in the VADS scheme, all dimensions required a similar effort, with dominance/confidence
slightly higher. For relative annotations, however, the difference was more pronounced and
happy/valence was notably easier. In the intensity annotations of four Ekman emotions with
best-worst scaling, there was a large range of annotation times suggesting a broad range of task
difficulties, an observation supported by reports from pilot annotators for the MixedEmotions data.
Here, the median times also varied notably between emotions, with joy perhaps surprisingly requiring
more effort and anger less.
4. Data Collection and Annotation
For the pilot study, 30 distinct tweet pairs and 18 sets of four distinct tweets were chosen randomly
from a collection of tweets drawn from the Twitter Sample API between 14 November 2015 and
22 February 2016. For the primary study, a further two thousand tweets were sampled randomly
from Twitter streaming API output over two periods: 19 days from 2 February 2016 and 14 days
from 15 July 2016. Nineteen tweet pairs from the pilot study that passed our heuristics (Table 5) were
retained for the primary study. These extended periods of collection were intended to reduce the bias
from trending topics with high tweet rates over short periods [28]. Even so, there were many tweets
contained hashtags of the form “#Vote. . . ”, related to the upcoming US election—these tweets were
removed. Though this type of bias can never be entirely removed, manual analysis of the final selected
tweets (after the application of heuristics described below) did not indicate the dominance of particular
events, and any potential bias that was not detected was considered acceptable for the purposes of
comparisons between annotation methodologies. For future work, a stratified sample correcting for
short term variations in overall tweet frequency could be considered to further address such biases.
Through identification of particular tweets with low annotator agreement in the pilot study
and common sense, we attempted to remove tweets that were were difficult to comprehend or were
difficult to annotate for some other reason, such as spam or bots. We developed a set of heuristics to
automatically remove many such tweets (see Table 5), and performed a further manual assessment of
selected tweets to remove the small number of obvious problematic tweets that remained.
Table 5. Heuristics used to remove tweets.
Heuristics
High proportion of very short words
High proportion #tags/@mentions
Multiple new-line characters
Large number of stop words
Apparent quotations
Weather channel tweets
Presence of obscure acronyms
Presence of “#Vote”
Presence of non English characters
Presence of “follow” or “followme” . . .
Automatically generated tweets, those from so-called “bots”, have become a significant
contributor to contemporary social media content, and a number of approaches with varying
sophistication and efficacy have been proposed to detect them and counter their effect [29]. Our rather
simple approach to counter this effect, namely the removal of tweets containing URLs (spam botsInformation 2018, 9, 117 9 of 13
typically attempt to lead you to a website to sell something), our heuristics and final manual analysis
of retained tweets, was however considered sufficient for the purposes of this study, as it likely has
little impact on annotator agreement. Furthermore, though emotional bot tweets that mimic human
communication may impact assessments of public sentiment, the strength of any bias they may cause
when present in training and evaluation data for emotion detection systems may not be substantial.
Such potential biases are, however, clearly worthy of further investigation.
4.1. Annotation
Annotations were obtained via the CrowdFlower platform. For the pilot study, volunteer
annotators from our organisation were recruited, and for the scaled-up annotation, professional
CrowdFlower annotators from English speaking countries were used. Each emotion dimension
was treated as a separate task, such that an annotator would annotate their quota of tweets on one
dimension, then their quota on another and so forth.
Annotation guidelines used more accessible terms than the traditional names for the first three
emotion dimensions (Happy/Sad, Excited/Bored, Confident/Unsure respectively; the terms Surprise
and Intensity were used as is) as well as everyday language to describe them, and stressed that it was
the feeling experienced by the tweet author that was sought. Instructions included an explanation
of the meaning of the relevant dimension including other emotion words associated with it as well
as eight annotated examples with explanations. In all annotation schemes, a “can’t tell” option was
provided, and these annotations were not included in further analysis.
4.1.1. Pilot Study
We investigated two annotation schemes for comparing tweets along each of four emotion
dimensions: Valence, Arousal, Potency/Dominance, Surprise and Intensity. This corresponds to the
four dimensions identified by Fontaine et al. [11] with the addition of emotion intensity. We found that
intensity correlated strongly with activation and did not pursue it further in the primary study.
The first annotation scheme presented annotators with two tweets and asked them to identify
which author’s emotion was stronger in the respective emotion dimension. Options for “About the
same” and “Can’t tell” were also provided. It was stressed that “Can’t tell” was to be used only when
one or other of the tweets was unintelligible, in a language other than English, or it was impossible to
form a clear picture of their authors emotional states. For this scheme, there were 150 comparison tasks
(30 tweet pairs in five emotion dimensions), and ten annotators took part in the study, each annotating
between 30 and 150 tweet pairs.
The second annotation scheme used the Best-Worst approach [25,26], where annotators are
presented with four texts and asked to choose the two texts where the authors were feeling the most and
least positive/dominant/etc.. . . Best-Worst annotations provide five out of the six possible comparisons
between pairs of the presented texts, and thus are efficient at gathering information. Initial annotations
with the Best-Worst approach indicated that the annotation tasks were cognitively very challenging
and the time needed to annotate each tweet set was many times more than annotating a tweet pair,
effectively counteracting the increased number of tweet comparisons per task. Our in-house annotators
exhibited a clear preference for annotating pairwise comparisons, and anecdotal evidence suggested
that annotators on crowd sourcing platforms such as CrowdFlower prefer simpler tasks that can be
performed very quickly, thus the Best-Worst approach was not used further in this study in preference
to simple tweet comparisons. Subsequent analysis of other annotation efforts using the Best-Worst
approach [3,20] indicated that Best-Worst annotations are none the less somewhat more efficient, giving
5 comparisons in approximately 3 to 3.5 times the time required for each annotation (see Section 3);
however, annotator agreement when taken as pairwise comparisons was very poor (agreement when
considering only best/worst choices as single comparisons was very high however).Information 2018, 9, 117 10 of 13
4.1.2. Primary Study
The 2019 tweets for the primary study were annotated with both the relative annotation scheme
from the pilot study and an absolute annotation scheme on a 5-point scale. For the binary scheme,
2019 tweet pairs were chosen such that each tweet was in at least one pair. For annotation on a
5-point scale, the Self-Assessment Manikin (SAM) [15] with an an additional “Can’t Tell” option for
unintelligible or non-English tweets was used for Valence, Dominance and Arousal. There are no SAM
manikins for Surprise, so it was annotated without visual aids.
Each individual tweet received five annotations for each emotion dimension. Forty-four tweets
and 44 tweet pairs for each dimension were annotated by the authors to serve as test questions.
We interspersed these in every 10 annotation tasks and excluded annotators who labelled more than
30% of these tests incorrectly from further experiments, discarding their annotations. As a side effect
of this process, the test tweets received many more annotations than other tweets. To avoid bias due to
the selection of tasks with low ambiguity for these test questions, they were removed when calculating
the annotation agreement metrics in Section 4.1 Annotator quality was high, with 80% of significant
annotators passing > 90% of the test questions and the remaining accepted annotators passing more
than 77%.
4.2. Data Availability and Privacy Protection
This data was collected with the purpose of providing a comparison between annotation
methodologies and as a gold standard annotated resource for the construction and evaluation of
emotion recognition models for social media text.
To protect individuals whose tweets are contained in the data, only tweet texts are provided,
without tweet ids, twitter author ids and all other tweet metadata. Data from the pilot and
primary studies containing individual tweet annotations is available online (http://140.203.155.26/
mixedemotions/datasets/4dEmotionInTweets.tar.gz). This information is provided in an effort to
aid compliance with recent laws on the use of data pertaining to natural persons such as the GDPR
(General Data Protection Regulation) from the European Union (https://gdpr-info.eu/), should the
data be used for commercial purposes.
4.3. Predictive Model
As further verification of the utility of the data, we built two sets of supervised models, one each
from the 5-point rating scale and pairwise comparison annotations. Separate models were built for
each emotion dimension. Results are presented in Table 6.
For the rating scale data, separate regression models for each emotion dimension were built
following the approach in [30]. This model consists of an ensemble of two supervised models: an SVR
(Support Vector Machine Regression) and a BiLSTM (Bidirectional Long-Short Term Memory) based
neural network model, both with 100-dimensional Glove word embeddings trained on tweets [31]
as features. The neural network model consisted of a BiLSTM layer followed by a dropout layer and
three dense layers with 50, 25 and four nodes.
For the comparison data, an SVM (Support Vector Machine) was built using the same Glove word
embeddings as features and radial basis function kernel. The cross validation results indicate that
supervised modelling can be effective for predicting emotions using this data.Information 2018, 9, 117 11 of 13
Table 6. Five fold cross validation results for rating scale regression models and comparison
classification models.
Spearman Correlation F1
Dimension
(Regression Models) (Comparison Models)
Valence 0.72 0.72
Arousal 0.64 0.69
Dominance 0.53 0.71
Surprise 0.42 0.63
Average 0.58 0.69
5. Conclusions
We compared annotator agreement across different annotation and emotion representation
schemes, finding improved agreement on the simpler task of annotating one emotion dimension
vs. annotating one of six emotion categories. Contrary to expectations, we found evidence that
annotations on a 5-point scale produced greater annotation agreement than comparisons (with a
dimensional emotion model), especially when considered as ordinal annotations and converted to
comparisons (taking, for each annotator, the set of all pairs of tweets from those they annotated).
In combination with Siamese networks as a modelling approach [32], where comparisons are
used directly in model training, this provides a promising avenue for future work in emotion
detection models.
An analysis of the cognitive complexity of annotation tasks was performed, taking time taken
to annotate as a proxy for complexity. It was found that best-worst scaling annotations [20] required
approximately twice the effort as rating scale annotations of sentiment in words and short phrases,
and evidence suggesting that this ratio is three to three and a half for the more complex task of more
nuanced emotion annotation of tweets. Effort required for pairwise comparisons was found to be
similar to that for single text annotations on a 5-point scale. The question then arises: which is the
most effective approach to annotate and subsequently model emotion in text in terms of effort spent
in annotation versus eventual model quality? Given the widespread use of sentiment modelling and
increasing use of nuanced emotion modelling, in both private and public sectors, further work to
answer this question would be well warranted.
To facilitate these analyses, a new data set of English tweets was created with annotations using
a dimensional emotion model using four emotion dimensions following the emotion representation
model identified by Fontaine et al. [11]. To the best of our knowledge, this is the first such data set to
be made publicly available, providing new opportunities to model emotion expressed in social media
text as well as prompting further work on evaluating the potential impact of such models on decision
processes driven by public sentiment.
Finally, though for the purposes of this work, the data sampling and filtering strategy was deemed
sufficient, further investigation of biases resulting from trending topics with high tweet rates over short
periods and the presence of automatically generated tweets (“bots”) would be worthwhile. A stratified
sampling approach over time segments combined with a long sampling period may be an effective
approach to mitigate trending topic bias while application of state-of-the-art bot detection tools could
be used to investigate and eventually mitigate bias from bot tweets.
Author Contributions: I.D.W. performed the bulk of the work presented here; J.P.M. contributed substantially to
the design of experiments; V.A. built and evaluated the predictive models presented in Section 4.3; P.B. motivated
conducting the study and provided overall guidance.
Acknowledgments: We would like to thank volunteers from the Insight Centre for Data Analytics for their efforts
in pilot study annotations. This work was supported in part by the Science Foundation Ireland under Grant
Number 16/IFB/4336 and Grant Number SFI/12/RC/2289 (Insight). The research leading to these results has
received funding from the European Union’s Horizon 2020 research and innovation programme under Grant
agreements No. 644632 (MixedEmotions).Information 2018, 9, 117 12 of 13
Conflicts of Interest: The authors declare no conflict of interest.
References
1. Pang, B.; Lee, L. Opinion Mining and Sentiment Analysis. Found. Trends Inf. Retr. 2008, 2, 1–135. [CrossRef]
2. Mohammad, S.M. Sentiment Analysis: Detecting Valence, Emotions, and Other Affectual States from Text.
In Emotion Measurement; Meiselman, H.L., Ed.; Woodhead Publishing: Sawston, UK; Cambridge, UK, 2016;
pp. 201–237.
3. Mohammad, S.; Bravo-Marquez, F. WASSA-2017 Shared Task on Emotion Intensity. In Proceedings of the 8th
Workshop on Computational Approaches to Subjectivity, Sentiment and Social Media Analysis, Copenhagen,
Denmark, 8 September 2017; Association for Computational Linguistics: Copenhagen, Denmark, 2017;
pp. 34–49.
4. Mohammad, S.M.; Bravo-Marquez, F.; Salameh, M.; Kiritchenko, S. SemEval-2018 Task 1: Affect in Tweets.
In Proceedings of the International Workshop on Semantic Evaluation (SemEval-2018), New Orleans, LA,
USA, 5–6 June 2018.
5. Felbo, B.; Mislove, A.; Søgaard, A.; Rahwan, I.; Lehmann, S. Using millions of emoji occurrences to
learn any-domain representations for detecting sentiment, emotion and sarcasm. In Proceedings of
the 2017 Conference on Empirical Methods in Natural Language Processing, Copenhagen, Denmark,
7–11 September 2017; Association for Computational Linguistics: Copenhagen, Denmark, 2017; pp. 1616–1626.
6. Buechel, S.; Hahn, U. EMOBANK: Studying the Impact of Annotation Perspective and Representation
Format on Dimensional Emotion Analysis. EACL 2017, 2017, 578.
7. Abdul-Mageed, M.; Ungar, L. EmoNet: Fine-Grained Emotion Detection with Gated Recurrent Neural
Networks. In Proceedings of the 55th Annual Meeting of the Association for Computational Linguistics
(Volume 1: Long Papers), Vancouver, BC, Canada, 30 July–4 August 2017; pp. 718–728.
8. Ekman, P.; Friesen, W.V.; O’Sullivan, M.; Chan, A.; Diacoyanni-Tarlatzis, I.; Heider, K.; Krause, R.;
LeCompte, W.A.; Pitcairn, T.; Ricci-Bitti, P.E.; et al. Universals and cultural differences in the judgments of
facial expressions of emotion. J. Pers. Soc. Psychol. 1987, 53, 712–717. [CrossRef] [PubMed]
9. Osgood, C.E.; May, W.H.; Miron, M.S. Cross-Cultural Universals of Affective Meaning; University of Illinois
Press: Champaign, IL, USA, 1975.
10. Russell, J.A.; Mehrabian, A. Evidence for a three-factor theory of emotions. J. Res. Pers. 1977, 11, 273–294.
[CrossRef]
11. Fontaine, J.R.J.; Scherer, K.R.; Roesch, E.B.; Ellsworth, P.C. The World of Emotions is not Two-Dimensional.
Psychol. Sci. 2007, 18, 1050–1057. [CrossRef] [PubMed]
12. Bradley, M.M.; Lang, P.J. Affective Norms for English Text (ANET): Affective Ratings of Texts and Instruction
Manual; Technical Report; University of Florida: Gainesville, FL, USA, 2007.
13. Preotiuc-Pietro, D.; Schwartz, H.A.; Park, G.; Eichstaedt, J.C.; Kern, M.; Ungar, L.; Shulman, E.P. Modelling
Valence and Arousal in Facebook posts. In Proceedings of the NAACL-HLT, San Diego, CA, USA,
12–17 June 2016; pp. 9–15.
14. Yu, L.C.; Lee, L.H.; Hao, S.; Wang, J.; He, Y.; Hu, J.; Lai, K.R.; Zhang, X. Building Chinese Affective Resources
in Valence-Arousal Dimensions. In Proceedings of the NAACL-HLT, San Diego, CA, USA, 12–17 June 2016;
pp. 540–545.
15. Bradley, M.M.; Lang, P.J. Measuring Emotion: The self-assessment manikin and the semantic differential.
J. Behav. Theory Exp. Psychiatry 1994, 25, 49–59. [CrossRef]
16. Metallinou, A.; Narayanan, S. Annotation and processing of continuous emotional attributes: Challenges
and opportunities. In Proceedings of the 2013 10th IEEE International Conference and Workshops on
Automatic Face and Gesture Recognition (FG), Shanghai, China, 22–26 April 2013; pp. 1–8.
17. Yannakakis, G.N.; Cowie, R.; Busso, C. The Ordinal Nature of Emotions. In Proceedings of the International
Conference on Affective Computing and Intelligent Interaction, San Antonio, TX, USA, 23–26 October 2017.
18. Yang, Y.H.; Chen, H.H. Ranking-Based Emotion Recognition for Music Organization and Retrieval.
IEEE Trans. Audio Speech Lang. Process. 2011, 19, 762–774. [CrossRef]
19. Martinez, H.P.; Yannakakis, G.N.; Hallam, J. Don’t classify ratings of affect; rank them! IEEE Trans.
Affect. Comput. 2014, 5, 314–326. [CrossRef]Information 2018, 9, 117 13 of 13
20. Kiritchenko, S.; Mohammad, S.M. Best-Worst Scaling More Reliable than Rating Scales: A Case Study on
Sentiment Intensity Annotation. In Proceedings of the 32nd International Conference on Computational
Linguistics and the 55th Annual Meeting of the Association for Computational Linguistics, Vancouver, BC,
Canada, 30 July–4 August 2017.
21. Wood, I.; Ruder, S. Emoji as Emotion Tags for Tweets. In Proceedings of the Emotion and Sentiment Analysis
Workshop LREC2016, Portorož, Slovenia, 23 May 2016; pp. 76–79.
22. Jaccard, P. The distribution of the flora in the alpine zone. New Phytol. 1912, 11, 37–50. [CrossRef]
23. Passonneau, R.J. Computing Reliability for Coreference Annotation. In Proceedings of the LREC, Reykjavik,
Iceland, 26–31 May 2004.
24. Passonneau, R. Measuring Agreement on Set-Valued Items (MASI) for Semantic and Pragmatic Annotation;
Columbia University: New York, NY, USA, 2006.
25. Louviere, J.J.; Woodworth, G. Best-Worst Scaling: A Model for the Largest Difference Judgments; Working Paper;
University of Alberta: Edmonton, AB, Canada, 1991.
26. Louviere, J.J.; Flynn, T.N.; Marley, A.A. Best-Worst Scaling: Theory, Methods and Applications; Cambridge
University Press: Cambridge, UK, 2015.
27. Wood, I.D.; McCrae, J.P.; Buitelaar, P. A Comparison Of Emotion Annotation Schemes And A New Annotated
Data Set. In Proceedings of the Eleventh International Conference on Language Resources and Evaluation
(LREC 2018), Miyazaki, Japan, 7–12 May 2018; European Language Resources Association (ELRA): Miyazaki,
Japan, 2018.
28. Bollen, J.; Mao, H.; Pepe, A. Modeling Public Mood and Emotion: Twitter Sentiment and Socio-Economic
Phenomena; Icwsm; AAAI Press: Barcelona, Spain, 2011; Volume 11, pp. 450–453.
29. Ferrara, E.; Varol, O.; Davis, C.; Menczer, F.; Flammini, A. The Rise of Social Bots. Commun. ACM 2016,
59, 96–104. [CrossRef]
30. Andryushechkin, V.; Wood, I.; O’Neill, J. NUIG at EmoInt-2017: BiLSTM and SVR ensemble to detect
emotion intensity. In Proceedings of the 8th Workshop on Computational Approaches to Subjectivity,
Sentiment and Social Media Analysis, Copenhagen, Denmark, 18 June 2017; Association for Computational
Linguistics: Copenhagen, Denmark, 2017; pp. 175–179.
31. Pennington, J.; Socher, R.; Manning, C.D. GloVe: Global Vectors for Word Representation. In Proceedings
of the Empirical Methods in Natural Language Processing (EMNLP), Doha, Qatar, 25–29 October 2014;
pp. 1532–1543.
32. Chopra, S.; Hadsell, R.; LeCun, Y. Learning a similarity metric discriminatively, with application to face
verification. In Proceedings of the 2005 IEEE Computer Society Conference on Computer Vision and Pattern
Recognition (CVPR’05), San Diego, CA, USA, 20–25 June 2005; Volume 1, pp. 539–546.
c 2018 by the authors. Licensee MDPI, Basel, Switzerland. This article is an open access
article distributed under the terms and conditions of the Creative Commons Attribution
(CC BY) license (http://creativecommons.org/licenses/by/4.0/).You can also read