A Spatio-temporal Stochastic Model for an Emerging Plant Disease Spread in a Heterogeneous Landscape
←
→
Page content transcription
If your browser does not render page correctly, please read the page content below
International Journal of Computer Applications (0975 - 8887)
                                                                                                      Volume 174 - No.16, January 2021

     A Spatio-temporal Stochastic Model for an Emerging
     Plant Disease Spread in a Heterogeneous Landscape

                                Clara Landry                                              Catherine Abadie
           CIRAD, UMR BGPI, F-97130 Capesterre-Belle-Eau,                  CIRAD, UMR BGPI, F-97130 Capesterre-Belle-Eau,
                       Guadeloupe, France                                 BGPI, Univ Montpellier, CIRAD, INRAE, Institut Agro,
                                                                                         Montpellier, France

                                  François Bonnot                                              Jean Vaillant
                BGPI, Univ Montpellier, CIRAD, INRAE, Institut Agro,                  Université des Antilles, LAMIA,
                               Montpellier, France                                F-97159 Campus de Fouillole, Guadeloupe

ABSTRACT                                                                  Interacting factors can be incorporated into the transmission model
                                                                          [3, 40, 41].
Black Leaf Streak Disease (BLSD) is the most severe foliar disease        An epidemiological model for transmission in heterogeneous land-
of banana and plantain. BLSD is caused by Pseudocercospora fi-            scapes and Bayesian Markov chain Monte Carlo (MCMC) infer-
jiensis , an ascomycete fungus which produces wind-borne spores           ence were used by [14] to estimate dispersal and life-cycle parame-
responsible for its spatial dispersal. In order to evaluate the BLSD      ters. [26] presented a Bayesian Markov model for investigating en-
long-distance dispersal and to better understand the effect of en-        vironmental spread processes. Several authors used models based
vironmental factors on its invasive spatial spread, a spatiotemporal      on spatial or spatio-temporal stochastic processes : for seed dis-
study was set up during the recent BLSD invasion in the Martinique        persal [25], spatio-temporal invasion of alien species [9], disease
island (FWI). Disease detection was carried out from September            spread [8, 42]. One can refer to [11]for the theory of point pro-
2010 to May 2012 and sampling squares were defined from a reg-            cesses and [10] for statistical analysis of spatio-temporal data. [22]
ular spatial grid built over the island. In this paper, we consider       showed the potential for integrating stochastic simulations into a
a stochastic model of spatio-temporal propagation of BLSD in an           framework for statistical modelling. [17, 18, 19, 9] discussed about
heterogeneous landscape and we present mathematical and com-              bayesian methods for fitting model without missing or censored
putational results for this continuous-time model. Statistical infer-     data and [32, 13] discussed the case with missing or censored data.
ence of parameters is carried out from presence-absence data using        However such missing data can be included as extra parameters
a Bayesian framework based on a data augmentation method with             in a Bayesian framework. [29] discussed about the use of data-
respect to square first colonization times. Parameter posterior distri-   augmented MCMC and presented a simulation-based Bayesian in-
bution calculations made possible the evaluation of the BLSD long-        ference for epidemic models illustrated with data from an outbreak
distance dispersal and land-cover influence on the disease propaga-       of smallpox. [30] addressed some shortcomings of partially ob-
tion. Our results enabled the reenactment of the invasion.                served diseases by means of a reconstruction framework. [31] de-
                                                                          veloped a scheme for robust inference about transmission chains
General Terms                                                             in the context of the Foot-and-Mouth Disease Virus. The frame-
                                                                          work presented leads to a Bayesian inference scheme able to re-
Sampling, biological invasion
                                                                          construct most likely transmission patterns and infection dates. [23]
                                                                          presented an auto logistic model with covariates for spatially cor-
                                                                          related binary observations on a lattice but the time aspect was
Keywords                                                                  not taken into account. They adopted a Bayesian set-up with in-
                                                                          complete observations from sampled responses taken over the area
Stochastic process, Likelihood, MCMC, Bayesian inference, Data            of interest. Their aim was to improve predictions of probability of
augmentation, BLSD                                                        presence for such lattice binary data. [43] demonstrated how meth-
                                                                          ods of MCMC based on a hybrid sampler combining Gibbs sam-
1.   INTRODUCTION
                                                                          pling within Metropolis-Hastings frameworks can be used to derive
Understanding biological pathogen invasion is a major contempo-           estimates of parameters and missing data for ecological process
rary issue: the occurrence of new diseases causes serious disrup-         models. [7] used a continuous time discrete state space Markov
tion of existing ecosystems, biodiversity and local economy [15, 2].      process with spatially varying covariates to model colonization-
The evaluation of the spatiotemporal spread of a disease is neces-        dispersal of Heracleum mantegazzianum, an invasive alien weed.
sary for effective and successful control strategies and requires a       They developed a Bayesian approach to parameter inference taking
good knowledge on the long distance spread of the pathogen and            into account uncertainty in colonization times.
on the effects of environmental factors on this dispersion [4, 12].

                                                                                                                                              1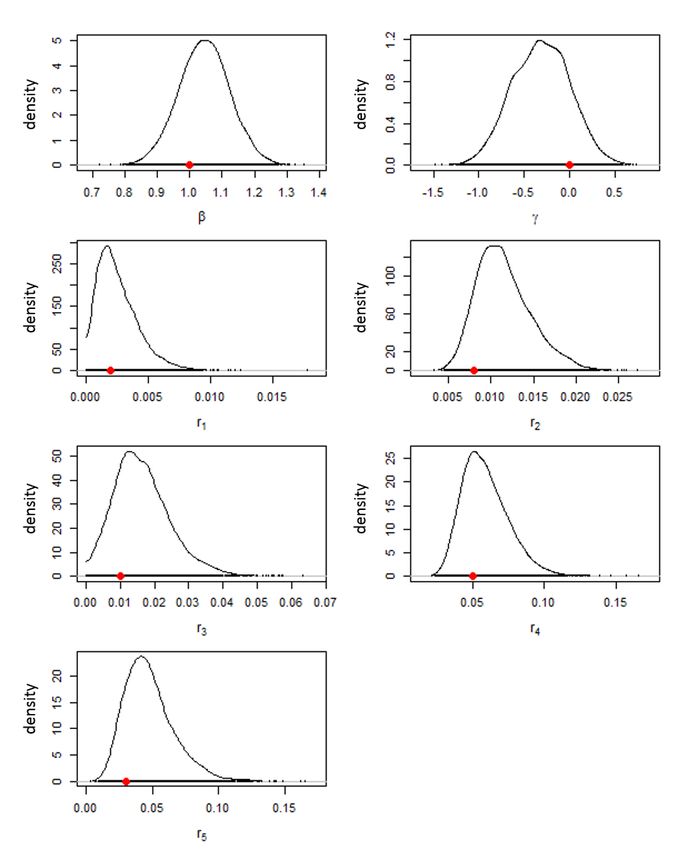
International Journal of Computer Applications (0975 - 8887)
Volume 174 - No.16, January 2021
Understanding invasive species dynamics is a real challenge [6]. Therefore, the stochastic intensity for a susceptible square i at time
To the best of our knowledge, there are few studies reporting the t conditionally to the history of the process prior to time t is :
evaluation of the long distance dispersal of invasive species and the 5
effects of environmental factors on invasion dynamics. Thus, our X X
λi (t) = exp(γ Pi ) (rk Hi,k ) fβ (di,j ) (2)
objective is twofold. We first focus on modeling the invasion pro-
cess of Black Leaf Streak Disease (BLSD), a major foliar disease k=0 j∈Ct−
of bananas, in an heterogeneous landscape island scale. Then, we where Ct− is the set of colonized squares before time t.
tackle the problem of performing statistical inference on this model It is worth noticing that if square i is colonized at time t, then
with incomplete data in order to better understand the spatiotempo-
ral spread of BLSD: evaluating the long distance dispersal and the λi (t) = 0.
effect of environmental factors on the dispersion during the inva-
sive phase. 2.2 Likelihood
In this paper, we first introduce a spatiotemporal model based on a Denoting by θ the parameter vector, we have θ =
stochastic intensity taking into account past neighboring infections (β, γ, r1 , · · · , r5 ). We face the problem of inferring θ from
and environmental variables in section 2. Then, we present the data incomplete data consisting of intervals in which first dates of
augmentation technique we developed within a Bayesian frame- colonization are detected or not for squares included in the survey
work. In section 3, we present the presence-absence data available over the time interval [0, T ]. If we denote by τi the unobserved
at the Martinique island scale over 83 survey weeks and we apply colonization date for square i, then the complete data set is
the method developed to the BLSD survey data to assess the long
distance dispersal and the impact of land-cover type on the spatio- τ = {min(τi , T ), i ∈ X}
temporal dynamic and to propose a reenactment of the BLSD inva- and the likelihood function of the complete data set is (see for ex-
sion. ample [10], p 349)
Y XZ T
2. MODEL AND INFERENCE L(θ; τ ) = λi (τi ) × exp − λi (t)dt (3)
i∈X i∈X 0
2.1 Model τi ≤T
We consider a spatiotemporal stochastic process of colonization From (2) and (3), we can write L(θ; τ ) =
which is assumed to be governed by its conditional intensity pro-
cess. We denote by X the whole set of squares defined from a
regular spatial grid built over the island, and by Ft− the coloniza- Y X X
tion history prior to time t so that the conditional intensity at any
Si fβ (di,j ) × exp −Si fβ (di,j )(τi − τj )
square i of X and at time t in R+ conditional on Ft− is defined as i∈CT j∈Cτi − j∈Cτi −
follows (e.g., [11]) :
Y X
P r(square i is colonized in [t, t + h] | Ft− ) × exp −Si fβ (di,j )(T − τj ) (4)
λi (t) = lim (1) ∈CT
i/
j∈CT −
h7−→0 + h
5
At time t, a susceptible square i receives spores transmitted from
X
where Si = exp(γ Pi ) (rk Hi,k ) is the suitability for coloniza-
squares that are already infected before t. We assume that this
k=0
square i has a suitability Si associated with the rainfall level and tion in square i.
the habitat receptivity to the infection ([20]). The effect of rainfall The first product on the right-hand side of (4) is the contribu-
level is modeled by an exponential term exp(γPi ) where Pi is the tion from the squares colonized before the last observation date T
mean rainfall level in square i, and γ ∈ (−∞, ∞) is a parameter whereas the second one corresponds to the probability for the re-
to be estimated : positive (negative) values of this parameter im- maining squares not being colonized at this date.
plies that locations with high rainfall levels are (not) preferred by We have to tackle the problem of inferring θ from incomplete data
the pathogen. The effect of habitat receptivity is modeled by a term consisting of intervals in which dates of colonization occur. The
5
P
rk .Hi,k where Hi,k is the proportion of square i belonging to complete data set τ is not available and the incomplete data likeli-
k=0 hood involves integrals which are analytically and numerically in-
landscape category k, k ∈ {0, ..., 5} and rk ∈ [0, ∞) is a pa- tractable (6). If we denote by D the observed incomplete set of data,
rameter representing the receptivity for colonization of landscape then the joint posterior distribution for θ and τ is
category k. We set r0 = 0 to reflect that the volcano/sea (habitat
0) is uncolonizable due to the absence of host, and r1 , ..., r5 repre- P (D, τ |θ)π(θ)
senting respectively five different landscape compositions. P (θ, τ |D) = (5)
P (D)
Let di,j be the distance between squares i and j. If j is infected
before t and i susceptible at time t, the rate of transmission from where π(.) is the prior distribution for θ and P (D) considered as a
square j to square i is assumed to be equal to Si fβ (di,j ) where normalizing constant. π(.) reflects the knowledge about the model
5 parameters prior to the observations. Therefore, the posterior dis-
tribution for θ is obtained by marginalizing over τ :
X
Si = exp(γ Pi ) rk Hi,k and fβ (di,j ) = β 2 d−2β
i,j stands for
k=0 Z
the isotropic power-law dispersal kernel with decay parameter β,
P (θ|D) = P (θ, τ |D)dτ (6)
[7]. H
2
International Journal of Computer Applications (0975 - 8887)
                                                                                                           Volume 174 - No.16, January 2021

      Table 1. Notations used in the likelihood and the MCMC                θ(m+1) = (β (m+1) , γ (m+1) , r1
                                                                                                                 (m+1)
                                                                                                                , r2
                                                                                                                          (m+1)
                                                                                                                         , r3   , r4
                                                                                                                                      (m+1)
                                                                                                                                         , r5
                                                                                                                                                (m+1)   (m+1)
                                                                                                                                                                )
                             algorithm.                                     and the kth element θk
                                                                                                  (m+1)
                                                                                                          of θ(m+1) is drawn according to the
   Notation    Definition                                                   acceptance probability:
   τi          time of colonization of the ith square
   Ct          set of squares colonized up to time t                            P (θ(m+1) , · · · , θ(m+1) , θ? , θ(m) , · · · θ(m) ); τ (m+1) qk (θ? , θ(m))
                                                                                     1                k−1      k    k+1          7                    k    k
   Ct−         set of squares colonized prior to time t                     min 1,  (m+1)            (m+1)    (m)    (m)           (m)
                                                                                                                                                        (m) ?
   N           number of squares in Martinique                                       P (θ1      , · · · , θk−1   , θk    , θk+1 , · · · θ7   ); τ (m+1) qk (θk , θk )
   λi (t)      rate of colonization of a square i in time t conditionally                                                                               (7)
               to the history of the process prior to time t                where qk is the proposal for θk .
   θ           (β, γ, r1 , ..., r5 ), the parameter vector
   θ∗          infered parameter vector                                     2.4     Method evaluation using artificial data
   H           the space of unobserved colonization times
                                                                            The stochastic model presented in section 2.1 is easily simulated
   π(.)        prior distribution of parameter
                                                                            as a time continuous Markov process when the covariates vary
   qk (., .)   proposal distribution for the kth element of θ
                                                                            spatially only. We use the fact that the waiting time between two
   E(a)        exponential distribution with parameter a
                                                                            consecutive events follows, conditionally to the past history, an
                                                                            exponential distribution with parameter depending on the set of
                                                                            squares colonized prior to the last event. Using a spatio-temporal
where H is the space of unobserved colonization times.                      point process with conditional intensity λx (t) for square x in X at
In next section, we focus on MCMC techniques [37] for sampling              time t given by equation 2, the waiting time of the next infection
from the posterior P (θ, τ |D) and then from P (θ|D). For any single        is distributed
                                                                                  X         according to the exponential distribution E(a) with
parameter, the marginal posterior is then estimated by the sampled          a=         λx (t). It is worth noticing that λx (t) = 0 if x is already
values of this parameter only. The notations used are summarized                   x∈X
in Table 1.                                                                 infected at time t.
                                                                            The simulation states in two steps, the first step consists in the cal-
2.3    Bayesian inference on parameters                                     culus of the waiting time of the next infection  :
By using MCMC techniques and considering the unknown colo-                                                               X
                                                                                                 = inf(τx ) ∼ E(              λx (t))                  (8)
nization times as augmented variables in the MCMC algorithm, we
                                                                                                                         x∈X
can sample from the posterior distribution of θ. We generalize the
sampling method proposed by [7, 5] by updating the whole set of             The second step is to establish the square position concerned by
first colonization times at each iteration by means of a reversible-        the future infection in time (t + ). The square j is retained with
jump hybrid sampler. This updating method reconstructs realiza-             probability pj such that :
tions of the colonization times consistent with the data and the
model. Each iteration of this algorithm includes also updating of                                             λj (t)
all model parameters. We assume that the prior distributions for                                        pj = X         .                                (9)
                                                                                                                λj (t)
the parameters are independent and uniform over a fixed interval.
                                                                                                                 j∈X
To sample from the posterior distribution P (θ, τ |D), the algorithm
starts with an initial vector τ (0) of colonization times consistent        The evaluation of the MCMC algorithm was carried out using inde-
with the observation D. Then, at the mth step, the vector τ (m+1)           pendent artificial data sets on 500 squares. The posterior densities
of colonization times consistent with D is obtained from a sam-             of the 7 parameters are presented in Fig 1.
pler conditional on τ (m) and θ(m) the parameter vector sampled at          The Gelman-Rubin criterion [16] was used to confirm the chain
step m. At step m, our proposal samples a vector τ (m+1) accord-            convergence and set at the value 1.
ing to a truncated multivariate Gaussian law centered on τ (m) with
an adaptive variance matrix. The algorithm is as follows:
                                                                            3.     APPLICATION: REGIONAL SCALE DYNAMICS
(1) Start with τ (0) consistent with the data and iterate the follow-              OF BLSD
    ing procedure:
                                                                            The Black Leaf Streak Disease (BLSD) or Black Sigatoka of
(2) Assign values to θ(0) ;                                                 bananas, is caused by the devastating ascomycete fungal plant
(3) Set m = 0;                                                              pathogen Pseudocercospora fijiensis . It is one of the most impor-
(4) Repeat                                                                  tant food security threat at global scale [34] because of its massive
                                                                            damage to banana crops and its rapid worldwide expansion [38].
    —Draw τ (m+1) consistent with D using the data augmentation             In the Caribbean Islands, the first detection was in Cuba in 1990
      sampler with τ (m) and θ(m) ;                                         and one of the most recent introduction was in Martinique (French
    —Sample θ(m+1) using Metropolis-Hastings with τ (m+1) and               West Indies). The first report of BLSD on Martinique island in
      θ(m) ;                                                                September 2010 indicates that the disease was introduced passively
    —Set m = m + 1;                                                         by spores, from nearby islands where BLSD was yet present, dur-
    —Store every τ (m) and θ(m) ; after an initial burn-in period;          ing August 2010 [24]. Now some genetic studies suggest that the
(5) End repeat.                                                             disease was introduced through two successive and independent
                                                                            modes (natural and anthropogenic) ([20]). Indeed, a surveillance
For τ (0) , each unknown colonization time is drawn according to            network was set up since 2009 and allowed to check monthly the
the uniform distribution on a interval consistent with D.                   banana production with respect to BLSD.

                                                                                                                                                         3
International Journal of Computer Applications (0975 - 8887)
Volume 174 - No.16, January 2021
3.1 Data
Presence-absence data for Pseudocercospora fijiensis were col-
lected in Martinique island within the framework of a disease
surveillance network on banana over the whole island coordinated
by the DAAF (Direction de l’Alimentation, de l’Agriculture et de
la Forêt) and the FREDON Martinique (Fédération REgionale de
Défense contre les Organismes Nuisibles de la Martinique). Mar-
tinique island surface area is about 1228 km2 . A regular grid with
cell size of 1 km x 1 km was placed over Martinique providing
1236 observation units. As mentioned in paragraph 2.1, we refer
to such an observation unit as a square. Presence-absence observa-
tions were carried out (Fig. 2) within different time windows (time
between two consecutive observations of the same square) and sur-
rounding environmental variables were measured. After the detec-
tion of BLSD on banana tree in a square, no more observations were
carried out on it since once a square is colonized by the pathogen it
remains infected.
Detection rates were spatially and temporally heterogeneous : the
time window length was comprised between 1 and 82 weeks with
an average of 21 weeks, in some squares only the date of the first
detection was available, and in other squares only the last date
of non-detection was available. The whole observation period was
over 83 weeks (from September 2010 to May 2012). Fig. 3 shows
the spatial locations of the fungus at three different dates: begin-
ning of the study with 37 squares contaminated, middle (week 36)
and end (week 83) of the study.
Five land-cover categories were defined : isolated banana from par-
tially resistant varieties, private garden with few plants of partially
resistant varieties, creole garden (small-scale farming with banana
and other productions such as vegetables, fruits), Cavendish plots
specialized in production for export on a larger scale and plantain
plots possibly extending over several hectares. Banana cultivated
Fig. 1. Bayesian posterior densities for each of the seven model parame- in plots are very susceptible to BLSD and disease controls are used
ters (β, γ, r1 , r2 , r3 , r4 , r5 ) obtained from 10000 runs of the algorithm to maintain good production. On Cavendish plots fungicide chem-
using artificial data. The red dot indicates the real parameter value used in ical treatments are preferably used whereas on plantain plots man-
the data simulation. We used a burn-in period of 1000 iterations. ual control, such as defoliating necrotic leaves, are privileged [35].
The disease evaluation of each visual positive detection on a banana
tree was confirmed with laboratory diagnostic. As lesions were an-
alyzed on infected leaf samples using molecular markers of high
sensitivity levels, there are no false-positive results.
BLSD is specific to Musa hosts (bananas and plantain). Banana Rainfall data were collected by Météo France on 19 weather sta-
susceptibility to BLSD and plantation density are also important tions located from north to south of the island. The average weekly
in the invasion process [20, 21]. The disease causes many lesions rainfall was calculated over the 83 weeks and used as a covariate.
on leaves which become large necrotic surface reducing the photo- As environmental variables such as land-cover and humidity in-
synthetic surface of the plant. On susceptible cultivars, BLSD may duced by rainfall are assumed to affect the spreading process, each
destroy (by necrosis) 40% to 100% of total leaf surface [27] which of the 1236 squares covering Martinique was associated with a vec-
causes important yield losses, from 20 to 80% in the absence of tor of covariates : the proportions of each landscape type and the
fungicide treatments [20]. rainfall level. The proportions of each landscape type were calcu-
Pseudocercospora fijiensis displays both an asexual and sexual lated from geo-referenced administrative surveys on Cavendish and
reproduction emitting respectively and successively two types of plantain plots made from years 2010 to 2012 and expert opinions
spores (conidia and ascospores). Both spores play an important part regarding the distribution of urban and rural zones of the island.
in the fungus dispersal, but only ascospores are considered as re-
sponsible for the long-distance dispersal [20]. The long dispersal 3.2 Bayesian analysis of the real data
distance of Pseudocercospora fijiensis spores was studied at differ-
ent spatial scales. [36] proposed the estimation of an anisotropic The prior distributions chosen for the model parameters reflect the
dispersal function using a 2 km square experiment zone and ob- lack of information about these parameters : β ∼ U [0, 10], γ ∼
served the disease symptoms across the experiment (1 km from the U [−10, 10] and rk ∼ U [0, 10] for each k in {1, · · · , 7}.
infection source). At a larger spatial scale, [1] detected the pres- We used Normal distributions centered on the current param-
ence of the pathogen 6 km away from the infectious source. The eter for each proposal distribution. After tuning, the standard
velocity of an epidemic invasion depends on climatic conditions deviation used for β, γ, r1 , r2 , r3 , r4 and r5 are respectively
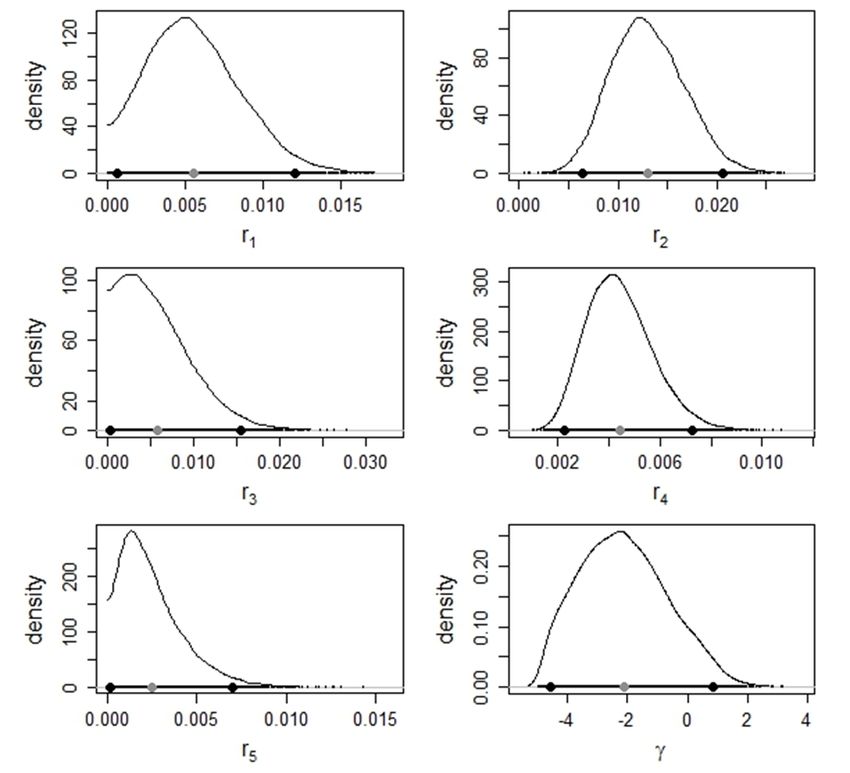
and landscape composition [33]. Indeed, rainfall and wind are the 0.01, 0.5, 0.001, 0.001, 0.01, 0.01 and 0.01. Fig. 4 gives the pos-
two natural dispersal modes of BLSD. terior distributions of the land-cover parameters and γ, whereas the
4International Journal of Computer Applications (0975 - 8887)
Volume 174 - No.16, January 2021
Fig. 2. Set of squares considered over the 83 weeks of survey. Black
squares correspond to squares with observations, grey squares are non-
observed squares and white squares are uncolonizable (high mountain and
volcano).
Fig. 4. Bayesian posterior density of the rainfall parameter γ, along with
the ones for the land-cover parameters ri representing the receptivity for
colonization of landscape category i ranging from 1 to 5: isolated banana,
private garden, creole garden, Cavendish plots and plantain plots. Grey
points correspond to the posterior mean value, black points correspond (left
to right) to the 2.5% and 97.5% quantiles.
Fig. 3. Presence-absence maps for Pseudocercospora fijiensis (left to
right), at the beginning of the survey (week 1), at the middle of the sur-
vey (week 36), and at the end of the survey (week 83). Black cells are
squares with disease detection, grey squares are non informed or non in-
fected squares and white squares are uncolonizable (high mountain and vol-
cano).
Fig. 5. Bayesian posterior density of β, the decay parameter of the
posterior distribution of β is shown in Fig. 5. The posterior means isotropic power-law dispersal kernel. Grey points correspond to the pos-
and standard errors are given in table 2. From these parameter esti- terior mean value, black points correspond (left to right) to the 2.5% and
mates, several numerical experiments were carried out. 97.5% quantiles.
Table 2. Bayesian estimates of the parameter vector
θ = (β, γ, r1 , r2 , r3 , r4 , r5 ). 3.3 Spatiotemporal prediction
Parameter Posterior Posterior Quantile Quantile New infected squares appear to be clustered around previous ones
Mean standard error 2.5% 97.5% due to the pathogen spread characteristics as shown in Fig 3. The
β 1.991 0.655 1.069 1.325 invasion process seems to be related to the landscape structure : the
γ -2.124 1.454 -4.574 0.861 southern part of the island is less infected by the disease, probably
r1 5.58e-03 2.98e-03 6.07e-04 0.012 because of the dry vegetation of this region whereas the northern
r2 1.303e-02 3.684e-03 6.383e-03 0.021 part is mostly covered by the tropical rain-forest. Based on the pro-
r3 5.746e-03 4.132e-03 2.815e-04 0.015 posed model, the simulated predictions of spatio-temporal spread
r4 4.418e-03 1.292e-03 2.25e-03 0.0072 of infections provide very similar results to that observed, as in
r5 2.473e-03 1.793e-03 1.77e-04 0.0069 Fig. 6 which shows artificial data generated from the parameter
Bayesian estimates.
5International Journal of Computer Applications (0975 - 8887)
Volume 174 - No.16, January 2021
Jean Iotti for valuable comments on island landscape description.
We are particularly grateful to Raphael Pasquier of University of
Antilles (C3I) for his assistance in computing and numerical ex-
periments. Clara Landry PhD studies were supported by a doc-
toral fellowship from CIRAD, and financially supported by FEDER
Guadeloupe through a research project (convention 1/1.4-30305
project/Gestion des risques en santé animale et végétale) and a co-
operation project through the Interreg IV Caraibes fundings (con-
vention num. 31409/CABARé). This research project is part of the
MALIN program funded by the European Union and the Guade-
loupe Regional Council under the European Research and Develop-
Fig. 6. Probability of colonization map (left to right), at the beginning of ment Funds (ERDF) 2014-2020 program (Grant 2018-FED-1084).
the survey (week 10), at the middle of the survey (week 36) and at the end
of the survey (week 83), obtained from 10000 model simulations using the 5. REFERENCES
estimated posterior density of the parameter vector. The darker the square,
the higher the probability
[1] A.F. Amil, S.P. Heaney, C. Stanger, and M. W. Shaw. Dy-
namics of QoI sensitivity in Mycosphaerella fijiensis in Costa
Rica during 2000 to 2003. Phytopathology, 2007.
4. DISCUSSION
[2] Pamela K. Anderson, Andrew A. Cunningham, Nikkita G. Pa-
In this study, we set out to model the invasion process of an emerg- tel, Francisco J. Morales, Paul R. Epstein, and Peter Daszak.
ing plant disease in a heterogeneous landscape. To achieve this Emerging infectious diseases of plants: pathogen pollution,
goal, we had to address the problem of performing statistical in- climate change and agrotechnology drivers. Trends in Ecol-
ference on the model with incomplete data. This approach was ap- ogy & Evolution, 19(10):535 – 544, 2004.
plied to the incidence data obtained during the invasion of Black [3] D.E. Aylor. Spread of plant disease on a continental scale: role
Leaf Streak Disease of bananas in Martinique. of aerial dispersal of pathogens. Ecology, 84(8):1989–1997,
We modeled successfully the BLSD invasion through a spatiotem- 2003.
proal stochastic process. The island landscape was divided in
squares of 1 km x 1 km, which were characterized by two envi- [4] J.K.J Brown and M.S. Hovmoller. Aerial dispersal of
ronmental factors (rainfall level and land-cover type). pathogens on the global and continental scales and its impact
A first sensitivity analysis was realized using variance-based on plant disease. Science, 297:537–541, 2002.
method, the extended Fourier Amplitude Sensitivity Test (eFAST) [5] Patrick E. Brown, Florencia Chimard, Alexander Remorov,
[39]. It shows that the land-cover is less influential than the rain- Jeffrey S. Rosenthal, and Xin Wang. Statistical inference and
fall level and dispersal parameters. The sensitivity analysis had to computational efficiency for spatial infectious disease models
be performed on averaged outputs because of the stochasticity of with plantation data. Journal of the Royal Statistical Society:
the model. [28] proposed the use of meta-models in this context to Series C (Applied Statistics), 2013.
obtain valuable indexes. [6] M. L. Cain, G.M. Brook, and E. S. Allan. Long-distance seed
We used the Bayesian paradigm for fitting a spatio-temporal dispersal in plant populations. American Journal of Botany,
stochastic process to square data with unobserved first coloniza- 87(9):1217–1227, 2000.
tion times and subject to censoring. Bayesian statistical inference [7] Stephen Catterall, Alex R. Cook, Glenn Marion, Adam But-
could be performed using a data augmentation method which re- ler, and Philip E. Hulme. Accounting for uncertainty in
constructs the first colonization time for each square at each it- colonisation times: a novel approach to modelling the spatio-
eration of MCMC algorithm. This data reconstruction method is temporal dynamics of alien invasions using distribution data.
powerful and original in the epidemiology science. Whereas some Ecography, 35(10):901–911, 2012.
short-distance function were available for BLSD [36], the inference
of the dispersal parameter allowed to get for the first time a long- [8] A. Cook, G. Marion, A. Butler, and G.J. Gibson. Bayesian in-
distance function for this disease. This function would be useful to ference for the spatio-temporal invasion of alien species. Bul-
develop spatial epidemiological model to evaluate control methods letin of Mathematical Biology, 69:2005–2025, 2007.
at landscape scale (such as varieties mixtures). [9] A. Cook, W. Otten, G. Marion, G.J. Gibson, and C.A. Gilli-
Numerical simulations can be performed to evaluate where future gan. Estimation of multiple transmission rates for epidemics
colonization events are likely to occur using the Bayesian parame- in heterogeneous population. PNAS, 104(51):20392–20397,
ter estimates obtained from our inferential routine. We could simu- 2007.
late square colonization beyond the end of our survey data and for [10] Noel Cressie and Christopher K. Wikle. Statistics for Spatio-
unobserved squares. These predictive data generation can be useful Temporal Data. Wiley, 2011.
in a control strategy framework. Numerical simulations can be also
[11] D.J. Daley and D. Vere-Jones. An Introduction to the Theory
carried out in case where the covariates are time dependent but this
of Point Processes. Springer, 2nd Ed., New York, 2003.
is more computer-time consuming.
Acknowledgements [12] M.L. Desprez-Loustau, C. Robin, M. Buee, R. Courtecuisse,
We would like to thank Elea Ksiazek, Sophie Veran, David Pley- J. Garbaye, F. Suffert, I. Sache, and Rizzo D.M. The fungal
dell and Virginie Ravigné for scientific discussions about the study. dimension of biological invasions. Trends in Ecology & Evo-
We thank also DAAF and FREDON Martinique for conducting lution, 22(9):472–80, 2007.
the experiments over all the island on 83 weeks, Météo France [13] J.A.N. Filipe, W. Otten, G.J. Gibson, and C.A. Gilligan. Infer-
for valuable rainfall data, IGN (Institut National de l’information ring the dynamics of a spatial epidemic from time-series data.
Géographique et forestière) for providing georeferenced maps and Bulletin of Mathematical Biologyy, 66:373–391, 2004.
6International Journal of Computer Applications (0975 - 8887)
Volume 174 - No.16, January 2021
[14] Joao A. N. Filipe, Richard C. Cobb, Ross K. Meentemeyer, demic models. Computational Statistics and Data Analysis,
Christopher A. Lee, Yana S. Valachovic, Alex R. Cook, 71:434 – 447, 2014.
David M. Rizzo, and Christopher A. Gilligan. Landscape epi- [30] N. Mollentze, L.H. Nel, Sunny Townsend, Kevin le Roux,
demiology and control of pathogens with cryptic and long- Katie Hampson, DT Haydon, and Samuel Soubeyrand. A
distance dispersal: Sudden oak death in northern californian bayesian approach for inferring the dynamics of partially ob-
forests. PLoS Comput Biol, 8(1):e1002328, January 2012. served endemic infectious diseases from space-time-genetic
[15] Matthew C. Fisher, Daniel. A. Henk, Cheryl J. Briggs, John S. data. Proceedings of the Royal Society of London. Series B:
Brownstein, Lawrence C. Madoff, Sarah L. McCraw, and Biological Sciences., 281(1782), 2014.
Sarah J. Gurr. Emerging fungal threats to animal, plant and [31] Marco J. Morelli, Gaell Thébaud, Joel Chadoeuf, Donald P.
ecosystem health. Nature, 484(7393):186–194, April 2012. King, Daniel T. Haydon, and Samuel Soubeyrand. A bayesian
[16] Andrew Gelman, Donald B Rubin, et al. Inference from iter- inference framework to reconstruct transmission trees using
ative simulation using multiple sequences. Statistical science, epidemiological and genetic data. PLoS Comput Biol, 8(11),
7(4):457–472, 1992. 11 2012.
[17] G.J. Gibson, A. Kleczkowski, and C.A. Gilligan. Bayesian [32] P.D. O’Neill. A tutorial introduction to bayesian inference for
analysis of biotanical epidemics using stochastic compart- stochastic epidemics models using Markov chain mote carlo
mental models. PNAS, 101(33):12120–12124, 2004. methods. Mathematical Biosciences, 180:103–114, 2002.
[18] G.J. Gibson, W. Otten, J.A.N. Filipe, A. Cook, G. Marion, and [33] S. Parnell, T. R. Gottwald, C. A. Gilligan, N. J. Cunniffe, and
C.A. Gilligan. Bayesian estimation for percolation models of F. van den Bosch. The effect of landscape pattern on the op-
disease spread in plant population. Stat Comput, 16(51):391– timal eradication zone of an invading epidemic. Phytopathol-
402, 2006. ogy, 100(7):638–644, 2010.
[19] G.J. Gibson, G. Streftaris, and S. Zachary. Generalised data [34] Elizabeth Pennisi. Armed and dangerous. Science,
augmentation and posterior inferences. Journal of statistical 327(5967):804–5, 2010.
planning and inference, 141:156–171, 2010. [35] Randy C. Ploetz, Gert H.J. Kema, and Li-Jun Ma. Impact of
[20] M. Guzmán, L. Pérez-Vicente, J. Carlier, C. Abadie, diseases on export and smallholder production of banana. An-
L. de Lapeyre de Bellaire, F. Carreel, D.H. Marin, R.A. nual Review of Phytopathology, 53(1):269–288, 2015.
Romero, F. Gauhl, C. Pasberg-Gauhl, and D.R.. Jones. Hand- [36] A. Rieux, S Soubeyrand, F. Bonnot, E. K. Klein, J. E. Ngando,
book of diseases of banana, abaca and enset, chapter Black A. Mehl, V Ravigné, Carl, and L. de Lapeyre de Bellaire.
leaf streak. CABI Publishing [New York], 2018. Long-distance wind-dispersal of spores in a fungal plant
pathogen: estimation of anisotropic dispersal kernels from an
[21] F. M. Hamelin, F. Castella, V. Doli, Marçais B., V. Ravigné,
extensive field experiment. Plos One, 2014.
and M.A. Lewis. Mate finding, sexual spore production, and
the spread of fungal plant parasites. Bulletin of Mathematical [37] C.P. Robert and G Casella. Monte Carlo Statistical Methods.
Biology, 78(4):695–712, 2016. second ed. Springer, 2010.
[22] F. Hartig, J.M. Calabrese, B. Reineking, T. Wiegand, and [38] S. Robert, V. Ravigné, M-F. Zapater, C. Abadie, and J. Car-
A. Huth. Statistical inference for stochastic simulation models lier. Contrasting introduction scenarios among continents in
- theory and application. Ecology Letters, 14:816–827, 2011. the worldwide invasion of the banana fungal pathogen my-
cosphaerella fijiensis. Molecular Ecology, pages 11–12, 2012.
[23] Jennifer A. Hoeting, Molly Leecaster, and David Bow-
den. An improved model for spatially correlated binary re- [39] A. Saltelli, S. Tarantola, and K.P.S. Chan. A quantitative
sponses. Journal of Agricultural, Biological, and Environ- model independent method for global sensitivity analysis of
mental Statistics, 5(1):102–114, 2000. model output. Technometrics, 41:39–56, 1999.
[40] Z. Shi-Mai and Y. Luo. Long-distance spread and interre-
[24] R Ioos, J. Hubert, C. Abadie, D. Duféal, G. Opdebeeck, and
gional epidemics of wheat stripe rust in China. The Amer-
J. Iotti. First report of black sigatoka disease in banana caused
ican Phytopathological Society, Plant Disease, 90(8):980–
by mycosphaerella fijiensis on Martinique island. Plant Dis-
988, 2008.
ease, 95(3):359–359, 2011.
[41] S. Soubeyrand, A.L. Laine, I. Hanski, and A. Penttinen.
[25] D. J. Levey, J. J. Tewksbury, and B. M. Bolker. Modelling Spatiotemporal structure of host-pathogen interactions in a
long-distance seed dispersal in heterogeneous landscapes. metapopulation. The American Naturalist, 174(3), 2009.
Journal of Ecology, 96:599–608, 2008.
[42] J Vaillant, G Puggioni, L.A. Waller, and J Daugrois. A spatio-
[26] Jed A. Long, Colin Robertson, Farouk S. Nathoo, and temporal analysis of the spread of suger cane yellow leaf
Trisalyn A. Nelson. A bayesian space time model for discrete virus. Journal of time series analysis, 2010.
spread processes on a lattice. Spatial and Spatio-temporal
[43] David M. Walker, F. Javier Perez-Barberia, and Glenn Mar-
Epidemiology, 3(2):151–162, 2012.
ion. Stochastic modelling of ecological processesusing hybrid
[27] Douglas H. Marin, Ronald A. Romero, Mauricio Guzman, gibbs samplers. Ecological Modelling, 198:40 – 52, 2006.
and Turner B. Sutton. Black sigatoka: An increasing threat
to banana cultivation. Plant Disease, 87(3):208–222, March
2003.
[28] A. Marrel, B. Ioos, S. Da Veiga, and M. Ribatet. Global sensi-
tivity analysis of stochastic computer models with joint meta-
models. Stat Comput, 22:833–847, 2012.
[29] Trevelyan J. McKinley, Joshua V. Ross, Rob Deardon, and
Alex R. Cook. Simulation-based bayesian inference for epi-
7You can also read