GROUND DEFORMATION IN THE CILOTO LANDSLIDES AREA REVEALED BY MULTI-TEMPORAL INSAR - MDPI
←
→
Page content transcription
If your browser does not render page correctly, please read the page content below
geosciences
Article
Ground Deformation in The Ciloto Landslides Area
Revealed by Multi-Temporal InSAR
Noorlaila Hayati 1,2,∗ , Wolfgang Niemeier 1 and Vera Sadarviana 3
 1   Institute of Geodesy and Photogrammetry, Technische Universität Braunschweig, Bienroder Weg 81,
     38106 Braunschweig, Germany; w.niemeier@tu-bs.de
 2   Department of Geomatics Engineering, Institut Teknologi Sepuluh Nopember, 60111 Surabaya, Indonesia
 3   Department of Geodesy and Geomatics Engineering, Institut Teknologi Bandung, 40132 Bandung, Indonesia;
     vsadarviana@gmail.com
 *   Correspondence: noorlaila@geodesy.its.ac.id or n.isya@tu-bs.de

 Received: 2 April 2020; Accepted: 23 April 2020; Published: 27 April 2020

 Abstract: Landslides are one of the natural hazards that occur annually in Indonesia. A continuous
 geodetic observation in the landslide prone area is essential to support the precautionary measures.
 Because of its hilly topography, torrential rainfall and landslide history, the Ciloto district in
 Indonesia has been affected by ground deformation for an extended period of time. The purpose
 of our study is to detect significant movement and quantify the kinematics of its motion using the
 Interferometric synthetic aperture radar (InSAR) time series analysis and multi-band SAR images.
 We utilized the small baseline SDFP technique for processing multi-temporal SAR data, comprising
 ERS1/2 (1998–1999), ALOS PALSAR (2007–2009), and Sentinel-1 (2014–2018). Based on the detected
 deformation signal in the Ciloto area, the displacement rates are categorized as very slow movements.
 Two active main landslide zones; the Puncak Pass and the Puncak Highway area, which show the
 trend of slow movement progressively increasing or descreasing, were detected. The integration
 of the velocity rate between InSAR results and ground observations (e.g., terrestrial and GPS) was
 conducted at the Puncak Highway area from the temporal perspective. Using the polynomial model,
 we estimated that the area had cumulatively displaced up to −42 cm for 25 years and the type of
 movements varied from single compound to multiple rotational and compound.

 Keywords: active landslide; slow deformation; multi-temporal InSAR; small-baselines

1. Introduction
     Indonesia is frequently hit by landslides which not only damage the environment and its
properties but also cause loss of lives. Overall, 1.3% of the population is affected by landslides
and 1.1% of deaths are due to this geological hazard [1]. Although the percentage of landslides is
relatively lower than that of other natural hazards (e.g., earthquakes, tsunamis, volcanic eruptions,
mud volcanoes), to a considerable extent, landslides still significantly affect society in the mountainous
areas of Indonesia. As mentioned in [2], landslides caused 2079 deaths during the period 1977–1997
and resulted in the destruction of agricultural fields, buildings, and roads. Moreover, in recent years,
The Indonesian National Disaster Management Authority (BNPB) reported that 74 landslides occurred
between January and November 2018 which caused a loss of 949 homes and 18 deaths.
     The discovery of the phase change contribution to measuring surface deformation from the
European Remote Sensing Synthetic Aperture Radar (ERS SAR) mission in 1993 [3] has opened
an extensive opportunity to understand the Earth’s surface change phenomena such as tectonics,
the landers earthquake, volcanism, subsidence, and landslides using the spaceborne technology.
Two of the most popular techniques in space geodetic observations for measuring surface deformation

Geosciences 2020, 10, 156; doi:10.3390/geosciences10050156                   www.mdpi.com/journal/geosciences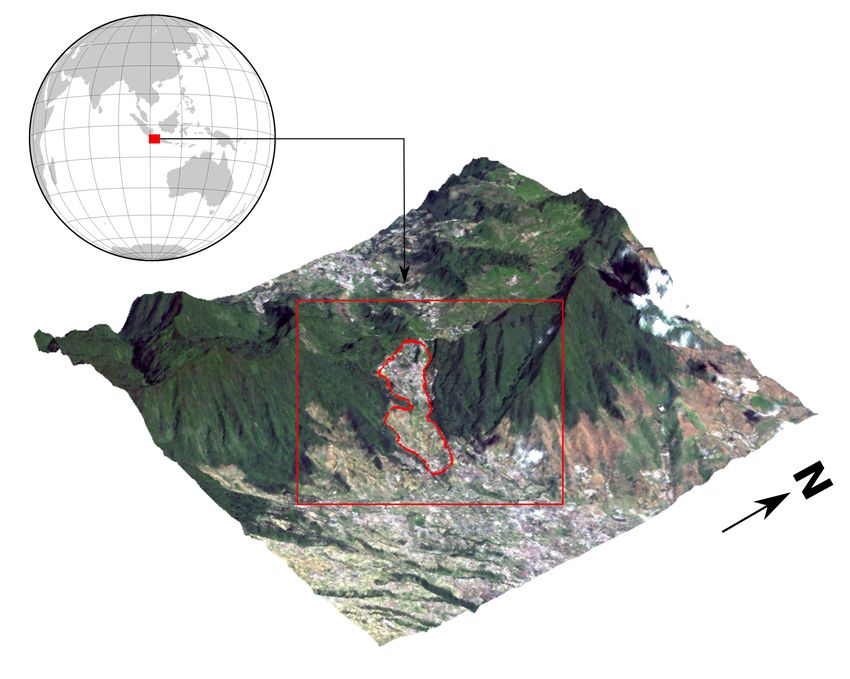
Geosciences 2020, 10, 156 2 of 16
are the Global Navigation Satellite System (GNSS) and the Interferometric Synthetic Aperture Radar
(InSAR). InSAR has the ability to monitor seismic activities, volcanic processes, subsidence induced
either by natural or anthropogenic causes and to quantify the kinematics of active landslides. InSAR is
divided into the ground- and satellite-based measurements which has a high accuracy for differential
phase measurement in the mm-range. Satellite-based InSAR has been used to construct landslide
inventories using ERS [4] and TSX [5] data. In addition, long term landslide monitoring using ERS,
Envisat, and Sentinel-1 data was performed by [6–8] including analysis and modeling using large SAR
dataset archives [9–11]. In recent years, there are different sensors available with better spatial and
temporal resolutions, such as Sentinel-1, compared to the early ERS mission. These massive data sets
have the potential to measure large areas for the study of landslide case studies, which are located in
densely vegetated or rural areas.
The article describes the application of an advanced InSAR method on active landslide areas located
on the Puncak Pass and the Puncak Highway area in Ciloto, Indonesia as shown in Figure 1. According
to the map of potential ground movement areas in Indonesia published by [12], the province of West Java,
with 544 landslides occurring in 2018, is classified as the highest risk level of ground movement. Some of
these landslides are located in the Ciloto district. The Ciloto landslides have been active since 1984 [13,14].
Since then, they have affected the economic and social factors due to the existence of the crucial highway
connecting Jakarta and Bandung, two of Indonesia’s major cities [15]. One example occurred in 1995 at
the KM 18+690 (from Jakarta) or KM 78+690 (from Bandung) where the road had completely collapsed
and created a very long traffic jam both from Jakarta and from Bandung. Furthermore, in the surrounding
area, The Indonesian Regional Disaster Management Authority for the Cianjur regency (BPBD Cianjur)
has recorded several landslides since 1995. Hence, to better understand the landslide damage potential
we investigated the Ciloto landslide area using remote sensing methods, where we applied the SB−SDFP
InSAR algorithm developed by [16] on a time series of InSAR data derived from ERS1/2, ALOS PALSAR,
and Sentinel-1 multi-band SAR data.
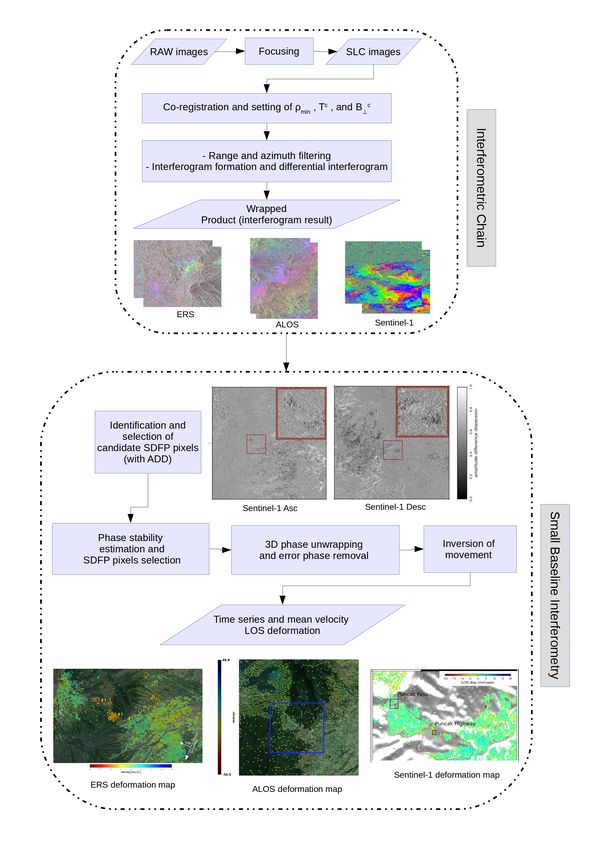
Figure 1. The location of the case study area in the Ciloto district, West Java, Indonesia. The Indonesian
Volcanology and Geological Hazard Mitigation (PVMBG) classified this area as a high-risk level of
potential ground movement [12].
Geosciences 2020, 10, 156                                                                               3 of 16

2. Materials and Methods
      We processed a large archive of multi-band SAR data consisting of: 11 images of descending
ERS1/2 from July 1998 to 1999 with VV polarization and descending orbit, 13 images of ascending
ALOS PALSAR data sets both in Fine Beam Single (FBS) and Fine Beam Double (FBD) polarization
collected between January 2007 and February 2009, and Sentinel-1 A/B both the ascending track
(72 SAR images with the relative orbit number = 98) and the descending track (68 SAR images with the
relative orbit number = 47) starting from October 2014 to June 2018. The ERS and Sentinel-1 satellites
are C-band sensor with a wavelength of 5.6 cm. The orbit information at every acquisition date uses
precise orbit ephemeris (POE) provided by ESA and TU Delft [17] with a gravity model from DGM-E04.
The ALOS PALSAR L-Band operates at a wavelength of 23.6 cm. This sensor has high capability to
detect persistent objects because long wavelength can penetrate the vegetation canopy. The Digital
Elevation Model (DEM) from SRTM 1 arc-second was used in purpose to reduce the topography effect
on SAR processing.

      Figure 2. The processing and outputs of the InSAR time series analysis. The procedure is a modified
      version from [18,19].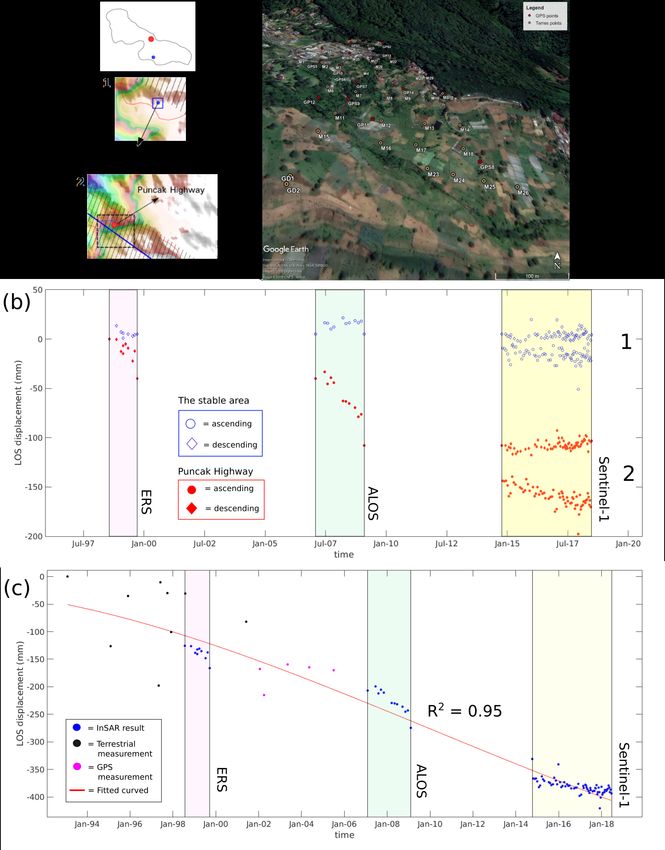
Geosciences 2020, 10, 156                                                                           4 of 16

     The flow chart of the InSAR time series analysis is shown in Figure 2. For the interferometric
processing chain, we used both DORIS software [20] for ERS and ALOS-1 dataset, and GMTSAR
software [21] for the Sentinel-1 dataset. Small baseline interferometry was performed using StaMPS
software [22]. Regarding the integration of GMTSAR to StaMPS, it was originally developed by [23]
to generate interferograms from GMTSAR and then analyze phase characteristics with the Persistent
Scatters algorithm [24] in StaMPS but not for small baseline processing. To make it able to process
the SB-SDFP algorithm, this open-source integration was improved by us for the small baseline
approach [16] and applied to our case study (please see Appendix A).
     The processing procedure of the InSAR time series started a step of interferogram generation [3,25].
ALOS PALSAR data are provided as raw level 1.0 data which have to be focused first while ERS1/2 and
Sentinel-1 are already in focused format, as Single Look Complex (SLC) products. The interferometric
processing chain is divided into the following stages:

•     Focusing:
      The process involves the coherent summation of range-aligned echoes over the length of the
      synthetic aperture. Since the range (R) varies with slow time (s) as measured by the precise orbit,
      it needs to calculate the range as a function of slow time. Each image will be focused to create the
      SLC format.
•     Co-registration:
      The precise orbital information is used to align the reference (master) and repeat (slave) image
      to sub-pixel accuracy in order to properly create the interferogram. It is accomplished by first
      using the orbital information to estimate the shift in range and azimuth coordinates. Furthermore,
      each image is divided into small patches to determine parameters of transformation using a
      cross-correlation algorithm needed to match the slave image into the reference one.
•     Range and Azimuth Filtering:
      The step processes the range spectral shift and the azimuth common bandwidth filtering in
      purpose to keep the correlated phase between two images and remove the noise term or the
      uncorrelated phase. The process is also called as “phase co-registration” [26].
•     Interferogram Generation:
      The stage computes the phase difference between the two images. The interferometric phase
      is generated by the utilization of cross multiplication from the complex product between the
      single values of the pixels. Furthermore, if it is necessary to reduce noise in the interferogram,
      the filtering step might be processed by low-pass arcs such as Gaussian filter wavelength [27],
      Goldstein filter [28], and the boxcar [29]. It decimates the real and imaginary components of the
      interferogram in both azimuth and range and computes final standard products of amplitude,
      phase, and coherence. Then, the Differential InSAR step will be processed to remove fringes due
      to a topography effect using an external DEM.

     Furthermore, the wrapped interferogram products were processed with the Slowly-Decorrelating
Filtered Phase (SDFP) [16] and the phase characteristic of each interferogram were identified with
the Persistent Scatter (PS) algorithm [30]. The main purpose of SDFP is to detect point scatterers
similar to the principle of PS in regions where are dominant with natural objects such as rural and
agriculture areas. It operates the multi-master set of interferograms with spectral filtering. To augment
the correlation of interferogram pairs, the Small Baseline approach [31] is taken into account for both
small perpendicular and short temporal baselines.
     The phase unwrapping step is a correction of the phase values of final SDFP pixels into an
appropriate number of 2π cycles because the selected pixels are still wrapped to modulo 2π. We applied
the three-dimensional phase unwrapping developed by [32] which executed the initial phase difference
of SDFP pixels. This 3D unwrapping method performs the residues in space-space (two spatial) and
space-time (one temporal). Namely, 3D unwrapping is a series of conventional 2D unwrapping
method with a purpose to sufficiently map slow deformation in the function of time. We generated the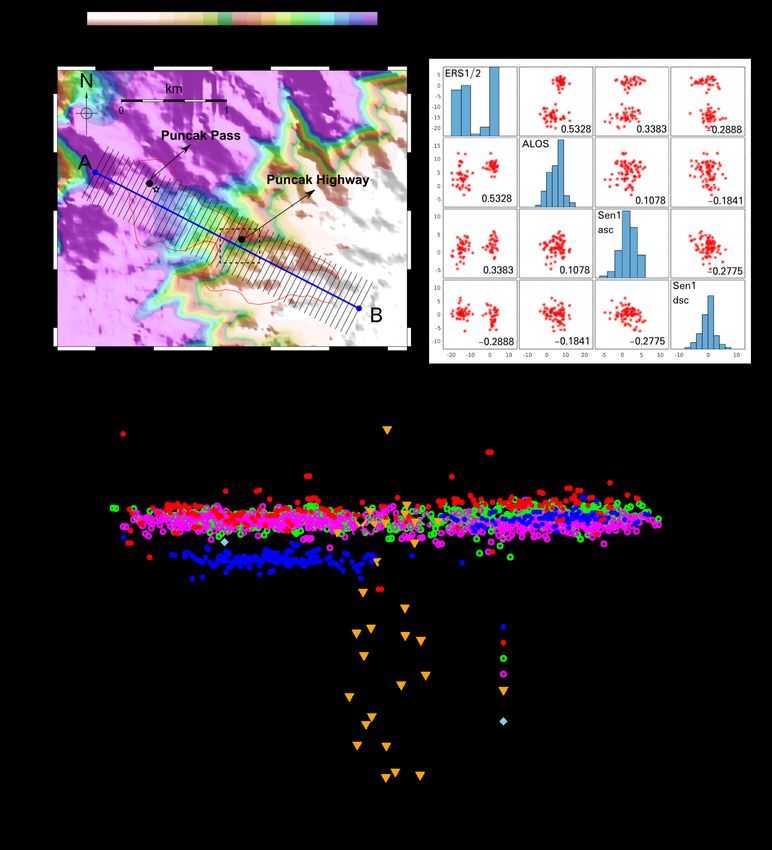
Geosciences 2020, 10, 156                                                                          5 of 16

unwrapped phase time series for each PS with the location of the reference PS [24], taken from a stable
area near to Ciloto. The temporal phase differences for each PS were firstly computed, and then an
iterative least square method was taken into account for unwrapping spatially based on the reference
PS [33]. The unwrapped result was further corrected by a subtraction of the spatially correlated term
errors which were already estimated on PS/SB-SDFP assessment.
      The unwrapped phase result based on SB-SDFP interferograms was inverted for deriving the
time series displacement values of the range changes between SAR scene acquisitions. Commonly,
the conventional SBAS approach [34] uses singular value decomposition (SVD) [31] with a requirement
of a priori knowledge about the temporal behavior of the deformation. However for our case study,
without any prior deformation knowledge, such as field derived monitoring data of the Ciloto
landslides, we applied the least square technique from [16,35] to generate approximate time series
displacement values, relative to a master image and reference pixel. This retrievement requires no extra
constraint deformation; however, the cluster of multi-master interferograms is limited to only one.
      For Sentinel-1 data, the post-processing method carried out by [36] was applied to improve the
time series analysis in the landslide case study. We took into account three corrections, which were:
(1) removing noise and regional trends, (2) detect and correct possible phase unwrapping errors, and
(3) averaging time series. The possibility of phase unwrapping error due to more than a quarter of the
radar wavelength motion could highly occur between two successive acquisitions [37] especially for
a landslide study case which a rapid or sudden movement can occur several weeks, days, or hours
before the collapse of slope. We applied the empirical method suggested by [36] at the Puncak Pass
landslide area. We added a deviation value ±5 mm for the detection of phase ambiguity since the
observed region was relatively covered by dense vegetation making it more difficult to find whether
it was the real signal or local noise. This correction could be applied only for one unwrapping error
and had been validated with the rainfall intensity recorded by the regional meteorology institute.
Therefore, if the computation found a high absolute difference of displacement more or less than
14 mm ± 5 mm between two consecutive acquisitions, it could be an indication of the break time
because of the slope failure.

3. Results and Discussions
     We evaluated the characteristic of ground motion for the period 1998 to 2018 using the time
series InSAR results of multi-temporal ERS1/2, ALOS PALSAR, and Sentinel-1 product. The number
available images from ERS1/2 and ALOS data is more limited than Sentinel-1 data. It restricts the
number of inteferograms that can be generated based on short temporal and perpendicular baselines.
We generated 25 inteferograms from ERS1/2 maximum for 365 days of temporal and 430 m of
perpendicular baseline; 36 interferograms from ALOS with a maximum of 365 days and 1300 m
baseline and; 341 and 349 interferograms from Sentinel-1 Ascending and descending data with a
maximum of 100 days and 100 m baseline. In particular, the data quality is not equivalent to compare
wisely since ERS1/2 and ALOS PALSAR results have a limited number of interferograms. With short
temporal gaps and sufficient acquisitions, the precisions of the Sentinel-1 sensor is higher than that of
ERS1/2 and ALOS. Furthermore, the coverage of ground points decreases due to not able finding phase
stability. The PS numbers for ERS1/2 descending, ALOS PALSAR ascending, Sentinel-1 ascending,
and Sentinel-1 descending are 461, 426, 14037, and 12918, respectively. The number of PS points
generated by ERS and ALOS data are significantly less than Sentinel-1 in the region of interest.
     Deformation results derived from geodetic measurements are described in the following section.
To interpret them easily, we drew a profile line extended ∼30 m shown in Figure 3a(left), where the
profile from point A (106.99◦ ; −6.71◦ ) to B (107.01◦ ; −6.72◦ ), extends from an elevation of 1400 m to
1200 m, covering the Puncak Pass and the Puncak Highway area. We emphasized the dashed line box
as the location for GPS and terrestrial measurement in Puncak Highway. The SAR data were resampled
using the nearest-neighbor function with the radius of 30 m to register PS points in the regular grid.
Thus, the tracking points based on the A-B profile are arranged in the same spatial resolution.
Geosciences 2020, 10, 156 6 of 16
Figure 3. (a) The left figure shows the Ciloto area along with the A-B profile which its sections are
covering the deformation result. The dash line box is the location for the previous GPS and terrestrial
measurements reported by [38] while the black star is the location of extensometer. The right figure
shows the correlation coefficient (R) matrix between SAR data for 77 samples matching grid. (b) The
distribution scatters of mean velocities from all geodetic observations in Ciloto area.
Pearson’s linear correlation coefficients between each point, were computed and compared with
77 matching PS points in all regular grid as seen to the right of Figure 3a, representing the relationship
of the different multi-band and temporal InSAR results. The results show that ERS1/2 and ALOS
points have the highest correlation coefficient of 0.5328 compared to other correlated data. It means
that both of those data are spatially distributed with similar rates of movement, whilst the relationship
between Sentinel-1 to ERS1/2 and ALOS results has low correlation coefficients under 0.34. For theGeosciences 2020, 10, 156 7 of 16
sample matching locations, we considered that their accelerations have become slower since 2007
because the rate of displacement decreases from −20 mm/year to −10 mm/year.
Figure 3b shows the mean velocity distribution in the Ciloto district produced by InSAR and
ground measurements. The profile length is ca. 2.8 km. We divided the section into 51 parts with
a width of 275 m from the ridge. The displacement rate of each observation has a different velocity.
The reason are: (a) their differences in temporal and spatial resolution, (b) the non-identical objects
of observation, (c) the different wavelength sensor and data quantity of SAR dataset, (d) different
geometry view and (e) unlike source of error.
The range of displacement rate is −20 to 20 mm/year for all of the detected PS points along with
the A-B profile. ERS1/2 shows the highest displacement rate until −20 mm/year located at the top
Ciloto area whereas the bottom part is relatively stable, 1–4 mm/year. The different displacement
values between the top and bottom areas might be caused by the natural geological process which has
faster soil motion during this period (from 1998 to 1999) on the top of Ciloto compared to the bottom.
Considering the limited number of interferograms and the long temporal baseline in 1999, another
reason is a superimposed effect of other unwanted signals such as the atmospheric phase screen and
noise due to error processing especially in co-registration and phase unwrapping.
According to ground measurement points in the Puncak Highway area, we projected GPS and
terrestrial vectors displacement (dU , d E , d N ) into LOS direction using the average incidence and
azimuth angle from Sentinel-1 ascending sensor. The LOS displacement values are viewed from
the ground perspective. It means towards the sensor is a positive value while away from the sensor
is a negative value. We applied the computation into ascending SAR data because the R-Index
calculation [39] revealed a better performance in the ascending orbit considering the characteristic of
Ciloto slope. R-Index represents the ratio between the slant range and ground range. Although a few
terrestrial benchmarks are in the range of ±10 mm/year, the rest have different high rates maximum
to −95 mm/year. An important note, the terrestrial points show high rates of movement since they
were located on more susceptible landslide prone areas along the Cijember river. PVMBG indicated
that erosion and ground movements occur more frequently in those areas. Moreover, the technical
surveying report explained that there was an accidental event and this factor was beyond the control
of the surveyor. Furthermore, the displacement rate from GPS analysis is similar to InSAR results
especially for ALOS and Sentinel-1 sensors. GPS2, GPS9, GP11 and GP14 moved 11.1, 20.9, −15.4 and
−27.9 mm/year, respectively. Other GPS points have the mean velocity ±10 mm/year. They are mostly located in the
Puncak Pass and Puncak Highway area.Geosciences 2020, 10, 156 8 of 16
3.1. The Puncak Pass Area
Two Puncak Pass landslides occurred on Sunday, 4 February and Wednesday, 28 March 2018 after
heavy rainfall events. They were located at 6◦ 420 2700 S and 106◦ 590 3800 E, 1450–1500 m above MSL near
to the Puncak Pass resort hotel. The second landslide had a 60◦ gradient slope with the toe’s section
about 10◦ . PVMBG categorizes this second event as a type of debris slide. Several factors causing these
landslides are; a very steep slope (≥45◦ ), strongly porous weathered soil, the weak shear strain due
to weathering and water infiltration, a bad drainage system, and high rainfall intensity as the main
trigger of slope failure events.
In Puncak Pass, we found PS points only from Sentinel-1 dataset from 2014 to 2018. Two samples
of selected PS points in this area were examined to understand the slow movement. The zone (1)
and (2) as shown in Figure 4 are located at the top of the landslide area, near to the main road and
the bottom close to Puncak Pass resort and hotel, respectively. Figure 4b presents the mean LOS
time series InSAR result from ascending and descending data. Zone 1, located in the north-west of
Puncak Pass reveals the subsidence up to −45 mm which we considered as the initial zone of depletion.
On the other hand, the zone 2 shows the up-lift movement up to 55 mm indicating creep had been
accumulated in the south-east of Puncak Pass. The two zones had moved significantly since November
2017 until the two landslide events occurred.
The characteristics of the displacement trend in Puncak Pass is also affected by noise considering
short repeated data (12 days) and sudden (rapid) movement of natural objects around the observed
area. In addition, the source of noise could also come from the turbulent atmosphere and seasonal
biases [40]. We detected the phase jumps only in the ascending data because the region is facing
south-east with the slope aspect of 90◦ –180◦ . The ascending Sentinel-1 is adequate to preserve good
amplitude and phase stability [41]. It agrees to R-Index which shows the ascending having greater
value (0.82) than the descending data (0.71). This index describes the possibility of topography effect
in the Ciloto area looked at by the ascending and descending tracks. The higher the value of R-Index,
the better the orientation of the sensor for detecting phase differences. Hence, the ascending result can
detect phase jump during the slope failurers but not for the descending result due to the sensitivity of
slope geometry.
The phase unwrapping error coincided with the landslide events in February and March 2018
due to phase decorrelation in space and time. We applied the correction of one phase unwrapping
error introduced by [36]. Since the differential displacement between two consecutive acquisitions
(residue) from ascending data at this time exceeded | λ/4| × 2 mm, we could not correct the error easily.
Hence, we assumed this time range as a breakpoint because of largely displaced materials. In order
to highlight the great motion that occurred in this period, the displacement values of this timeline
are modified to be residue ± λ. Considering SAR geometry facing the slope direction, the trend of
displacement generated by the ascending data identifies more significant deformation signals than
that of descending data because the area has the slope facing in a southeast direction (the slope aspect
of 130◦ –160◦ ).Geosciences 2020, 10, 156 9 of 16
Figure 4. (a) The evidence of the landslide event occurred on 28 March 2018 documented by BPBD
Cianjur. Number 1 shows the depleted zone while number 2 shows the accumulated zone. (b) The
mean LOS InSAR result from Sentinel-1 ascending and descending SAR data in the Puncak Pass area.
The phase jump (the red triangles) occurred during February–March 2018 due to the two consecutive
slope failures.Geosciences 2020, 10, 156 10 of 16
3.2. The Puncak Highway Area
The ground points from different geodetic sources are located in the northern part of Puncak
Highway (Figure 5a). Since their spatial and temporal distributions are different, we took the points
near to the location and calculated the average values of the selected points from each observation.
The size area was approx. 10,000 m2 located on 107.0015◦ ; −6.7123◦ . For the expectation of land
changes from 1998 to 2018, the persistent scatterers are dependent on both natural and man-made
objects which exist during that period (e.g., trunks, rocks, and buildings). There are some buildings
that are known exist in this area since 2002 and supposed to serve as potential PS points for ALOS and
Sentinel-1 sensors. For ERS period, there could be a discrepancy of displacement value if PS points are
taken from natural objects which tend to change significantly between 1998 and 2018.
Figure 5a shows the distribution of terrestrial and GPS measurement points in the Puncak
Highway area and the stable area located in the southern part of the Ciloto district. Firstly, we identified
only PS points from ERS, ALOS, and Sentinel-1 data and compared the cumulative deformation to
a stable area presented in Figure 5b. Generally, the stable area has cumulative displacement up to
±51 mm while Puncak Highway up to −198 mm. Both positive and negative values are detected
for the trend movement in the stable area. It is influenced by the disprepancy of noise signal caused
by local turbulance and errors in data processing. For the Sentinel-1 result, the ascending data has
greater accelaration than the descending data viewed in LOS direction. The reason is that the sensor
direction influences the sensitivity of InSAR for displacement detection. The slope geometry in Puncak
Highway is also facing the south-east. It makes a sensor with the ascending orbit more capable to
discover the slope movement than with the descending orbit, as we described in Section 3.1.
Secondly, we assessed time series displacements provided by all geodetic measurements as shown
in Figure 5c. Three points from the terrestrial survey were identified, M7, M8, and M9 while there
are two points observed by GPS measurement, GPS7, and GP14. We used 1, 1, 16 PS points for
ERS1/2, ALOS PALSAR, and Sentinel-1 ascending data, respectively. We did not use GP14 in the
assessment because there were no GPS recordings during the survey period. The range of years
without available information neither from ground nor space-borne observation is interpolated based
on the linear regression approach with the coefficient determination of 0.83. After the relative time
series displacement from several sources wass established, a robust cubic polynomial with normalized
center and scale was determined by the following model:
t−µ
disp = 4.011 x3 + 2.995 x2 − 120.3 x − 307.5 , with x = (1)
σ
where x is a normalized value with mean µ and standard deviation σ in the function of time t.
It presents the eventual displacements from all available geodetic measurements. Based on the
assessment using the best-fit model with the coefficient of determination (R2 ) = 0.95, we estimated that
the region has a cumulatively displacement of up to −420 mm over 25 years.Geosciences 2020, 10, 156 11 of 16
Figure 5. (a) The location of time series displacement both in a stable area (No. 1) and an unstable area,
(Puncak Highway) (No. 2). The right picture shows the distribution of ground points from terrestrial
and GPS measurements in Puncak Highway. (b) The time series displacement from 1998 to 2018 (not
considered unobserved dates) in the upper part of Puncak Highway. The selected area is located at
107.0015◦ ; −6.7123◦ . (c) The time series displacement from February 1993 to June 2018 with the cubic
polynomial fit model. The fit deformation model in Puncak Highway considers two different sources
of deformation, which are ground measurement (terrestrial and GPS) and space-borne measurement
(InSAR results from ERS, ALOS, and Sentinel-1 ascending data).Geosciences 2020, 10, 156 12 of 16
Furthermore, the available information of the type of Ciloto landslides is associated to the
time series InSAR generated by three SAR sensors. We interpreted the updated type of Ciloto’s
movement in Puncak Highway based on several assumptions described by [42]. Although the number
of PS points were not found on all of the SAR datasets, interpretation was based on the following
analysis: geological features as described in detail by [43], morpho-structures [13], previous kinematic
motion [14,44], and the trend displacement from the InSAR result. The reader is referred to those
references for additional physical characteristics concerning the Ciloto landslide. Figure 6 shows the
evolution of Ciloto’s motion induced by active landslides. Firstly, a single compound debris slide is
slightly detected by ERS1/2 from 1998 to 1999 located in the middle of study area with a mean velocity
of −13.7 mm/year. Eight years later, it developed into a multiple compound debris slide based on
the ALOS-PALSAR observation from 2007 to 2009. We found an acceleration of 12 mm/year between
the ERS and ALOS result. Hence, it had cummulatively increased to −25.6 mm/year. These observed
points are located in the western Puncak Highway area. On the contrary, the mean velocity generated
by Sentinel-1 ascending shows −11.4 mm/year from 2014 to 2018. It means that the landslide’s
motion accelerated slowly to −11 mm/year in recent years. Considering its displacement pattern,
it is categorized as a multiple compound debris surface sliding. We considered the western Puncak
Highway area as a multiple compound slide because a new identification of a multiple rotational slide
is found in the eastern part of Puncak Highway with the surface’s motion from the southwest to the
southeast, toward the residential and agricultural area, respectively.
Figure 6. The evolution of type of Ciloto’s movement interpreted by the time series InSAR from 1998
to 2018, its geological features, and morpho-structures.
4. Conclusions
C-Band and L-Band SAR data are used to monitor the slow-moving landslide in Ciloto, Indonesia.
Despite some limitations, the sensors provided useful data to obtain continuous and area-based
information for ongoing activities of a landslide effected area. The continuous surface’s motion
in Ciloto landslides area is described as the non-uniform displacement. The following are several
reasons to consider the movement as a non-uniform trend; (a) the performance of InSAR and ground
measurements depends on many factors such as the quantitative of spatial and temporal resolution,
the dense vegetation cover of some areas, and geometric distortion in the mountainous environment,
(b) the influence of periodical physical environment, such as creep behavior, ground and surface water,
and local precipitation, and (c) human intervention, such as the change of land use.
Our work investigated in detail active landslide areas in Puncak Pass and Puncak Highway.
The description of landslide inventory, especially for the classification of the states of landslide’s
activities which are active; suspended; reactivated; inactive; dormant; abandoned; stabilized; and relict,
are not reflected in this article. This will be considered in the next research phase, and will include
an automatic classification of the states of landslide’s activities based on multi-temporal InSAR at
the regional scale. Its classification has to meet a conditional sequence of a statistical test. Regarding
this development, a prior study by [45] has been conducted in which the time series PS-InSAR data
are classified into distinctive predefined target trends of ground deformation such as uncorrelated,
linear, quadratic, bilinear, and discontinuous. Even though the classification of landslide activity wasGeosciences 2020, 10, 156 13 of 16
performed by [46] for a mean velocity of deformation at a regional scale, the automatic classification of
the states of landslide activities is not yet well-established for the time series InSAR dataset.
The quantification of Ciloto’s ground motion for an extended period can be used further for a
parameter of environmental carrying capacity at a regional scale. A high risk of ground movement
will reduce its sustainability since the capability of resources in the Ciloto’s environment is obstructed
by the hazard. It is an important role to assess disaster mitigation with the consideration that a low
environmental carrying capacity induced by natural hazards (e.g., significant ground movement occurs
in certain areas) could be classified into the high-risk level of disaster. Therefore, the local government
can consider this issue as a strategy for development planning.
Author Contributions: N.H. contributes to conceptualization, methodology, data processing, investigation,
analysis, and writing–original draft preparation and editing. W.N. contributes to supervision, project
administration, conceptualization, and writing–review. V.S. contributes to conceptualization for the types of Ciloto
landslides and analysis of terrestrial and GPS observations. All authors have read and agreed to the published
version of the manuscript.
Funding: This research was funded by Deutscher Akademischer Austauschdienst (DAAD). We acknowledge
support by the German Research Foundation and the Open Access Publication Funds of the Technische Universität
Braunschweig.
Acknowledgments: The ERS1/2 and Sentinel-1 SAR data are provided by Open Access Copernicus, European
Space Agency (ESA) and ALOS PALSAR data from Japan Aerospace Exploration Agency (JAXA) through Alaska
Satellite Facility (ASF) archives. We would like to thank BPBD Cianjur and PVMBG to give guide and detail
explanations about the environment of Ciloto landslides.
Conflicts of Interest: The authors declare no conflict of interest.
Abbreviations
The following abbreviations are used in this manuscript:
ADD Amplitude Difference Dispersion
ALOS Advanced Land Observing Satellite
DEM Digital Elevation Model
DORIS Delft Object-oriented Radar Interferometric Software
ERS European Remote Sensing
GMTSAR Generic Mapping Tools Synthetic Aperture Radar
GPS Global Positioning System
GNSS Global Navigation Satellite System
InSAR Interferometric Synthetic Aperture Radar
LOS Line of Sight
PALSAR Phased Array L-Band Synthetic Aperture Radar
PS Persistent Scatters
SBAS Small Baselines Subsets
SDFP Slowly Decorrelating Filtered Phase
SLC Single Look Complex
SRTM Shuttle Radar Topography Mission
StaMPS Stanford Method for Persistent Scatters
SVD Singular Value Decomposition
TSX TerraSAR-X
Appendix A
Sentinel-1 dataset was processed by the integration of GMTSAR to generate inteferograms and
StaMPS to analyze the phase characterictics of interferograms. The source codes can be accessed on
https://github.com/dedetmix/gmt5sar2stamps_sbas (doi: 10.5281/zenodo.3387231).Geosciences 2020, 10, 156 14 of 16
References
1. Cummins, P.R. Geohazards in Indonesia: Earth science for disaster risk reduction –introduction. Geol. Soc.
Lond. Spec. Publ. 2017, 441, 1–7. [CrossRef]
2. Abidin, H.; Andreas, H.; Gamal, M.; Sadarviana, V.; Darmawan, D.; Surono; Hendrasto, M.; Suganda, O.K.
Studying landslide displacements in the Ciloto area (Indonesia) using GPS surveys. J. Spat. Sci. 2007,
52, 55–63. [CrossRef]
3. Massonnet, D.; Rossi, M.; Carmona, C.; Adragna, F.; Peltzer, G.; Fiegl, K.; Rabaute, T. The Displacement
Field of the Landers Earthquake mapped by Radar Interferometry. Nature 1993, 364, 138–142. [CrossRef]
4. Cascini, L.; Fornaro, G.; Peduto, D. Advanced low- and full-resolution DInSAR map generation for
slow-moving landslide analysis at different scales. Eng. Geol. 2010, 112, 29–42. [CrossRef]
5. Notti, D.; Davalillo, J.C.; Herrera, G.; Mora, O. Assessment of the performance of X-band satellite radar data
for landslide mapping and monitoring: Upper Tena Valley case study. Nat. Hazards Earth Syst. Sci. 2010,
10, 1865–1875. [CrossRef]
6. Herrera, G.; Davalillo, J.C.; Mulas, J.; Cooksley, G.; Monserrat, O.; Pancioli, V. Mapping and monitoring
geomorphological processes in mountainous areas using PSI data: Central Pyrenees case study. Nat. Hazards
Earth Syst. Sci. 2009, 9, 1587–1598. [CrossRef]
7. Rosi, A.; Vannocci, P.; Tofania, V.; Gigli, G.; Casagli, N. Landslide Characterization Using Satellite
Interferometry (PSI), Geotechnical Investigations and Numerical Modelling: The Case Study of Ricasoli
Village (Italy). Int. J. Geosci. 2013, 4. [CrossRef]
8. Crosetto, M.; Monserrat, O.; Devanthéry, N.; Cuevas-González, M.; Barra, A.; Crippa, B. Persistent Scatterer
Interferometry Using Sentinel-1 Data. ISPRS Int. Arch. Photogramm. Remote Sens. Spat. Inf. Sci. 2016,
XLI-B7, 835–839. [CrossRef]
9. Herrera, G.; Notti, D.; García-Davalillo, J.C.; Mora, O.; Cooksley, G.; Sánchez, M.; Arnaud, A.; Crosetto, M.
Analysis with C- and X-band satellite SAR data of the Portalet landslide area. Landslides 2011, 8, 195–206.
[CrossRef]
10. Bovenga, F.; Wasowski, J.; Nitti, D.; Nutricato, R.; Chiaradia, M. Using COSMO/SkyMed X-band and
ENVISAT C-band SAR interferometry for landslides analysis. Remote Sens. Environ. 2012, 119, 272–285.
[CrossRef]
11. Cigna, F.; Bianchini, S.; Casagli, N. How to assess landslide activity and intensity with Persistent Scatterer
Interferometry (PSI): The PSI-based matrix approach. Landslides 2013, 10, 267–283. [CrossRef]
12. PVMBG. Susceptibility to Landslide Zone Map of Cianjur Regeny, West Java Province; Technical Report; Centre
of Volcanology and Geological Hazard Mitigation (PVMBG), Geological Agency, Ministry of Energy and
Mineral Resources: Bandung, Indonesia, 2016.
13. Sugalang, S. Landslide in Ciloto Area, West Java, Indonesia. In Bulletin of the Directorate of Environment
Geology; Number 7; Sudjana, I.B., Adjat Sudrajat, P.S., Eds.; Directorate of Environmental Geology, Directorate
General of Geology and Mineral Resources, Ministry of Mines and Energy: Bandung, Indonesia, 1993; pp.
1–9.
14. Abidin, H.; Sadarviana, V.; Irwan, G.; Dudy, D.W.; Achmad, R.T. Landslide Monitoring and Slip Surface
Estimation by Geometric Approach Case Study: Ciloto-Puncak, West Java. In Proceedings of the International
Conference on Landslides and Slope Stability (Slope 2015), Bali, Indonesia, 27–30 september 2015.
15. Munarto, E.S.; Vaza, H.; Febrijanto, R. Landslide Evidence Problem Solving on National Road Bandung -
Jakarta at KM 18+000 in Ciloto – Puncak Pass Regions. In Proceedings of the Slope 2015; Rahardjo, P.P., Tohari,
A., Eds.; Parahyangan Catholic University: Bandung, Indonesia, 2015.
16. Hooper, A. A multi-temporal InSAR method incorporating both persistent scatterer and small baseline
approaches. Geophys. Res. Lett. 2008, 35, L16302. [CrossRef]
17. Scharroo, R.; Visser, P. Precise orbit determination and gravity field improvement for the ERS satellites.
J. Geophys. Res. Ocean. 1998, 103, 8113–8127. [CrossRef]
18. Gong, W.; Thiele, A.; Hinz, S.; Meyer, F.J.; Hooper, A.; Agram, P.S. Comparison of Small Baseline
Interferometric SAR Processors for Estimating Ground Deformation. Remote Sens. 2016, 8, 330. [CrossRef]
19. Tao, Q.; Gao, T.; Hu, L.; Wang, Z. Optimal selection and application analysis of multi-temporal differential
interferogram series in StaMPS-based SBAS InSAR. Eur. J. Remote Sens. 2018, 51. [CrossRef]Geosciences 2020, 10, 156 15 of 16
20. Hanssen, R.; Bamler, R. Evaluation of Interpolation Kernels for SAR interferometry. IEEE Trans. Geosci.
Remote Sens. 1999, 37, 318–321. [CrossRef]
21. Sandwell, D.; Rob.; Xiaopeng.; Xu, X.; Wei, M.; Wessel, P. GMTSAR: An InSAR Processing System Based on
Generic Mapping Tools, 2nd ed.; Scripps Institution of Oceanography, University of California: San Diego, CA,
USA, 2016.
22. Hooper, A.; Bekaert, D.; Spaans, K. StaMPS/MTI Manual; Delft Institute of Earth Observation and Space
Systems, Delft University of Technology: Delft, The Netherlands, 2010.
23. Tong, X.; Sandwell, D.T.; Schmidt, D.A. Surface Creep Rate and Moment Accumulation Rate Along the Aceh
Segment of the Sumatran Fault From L-band ALOS-1/PALSAR-1 Observations. Geophys. Res. Lett. 2018,
45, 3404–3412. [CrossRef]
24. Hooper, A.; Zebker, H.; Segall, P.; Kampes, B. A new method for measuring deformation on volcanoes and
other natural terrains using InSAR persistent scatterers. Geophys. Res. Lett. 2004, 31. [CrossRef]
25. Massonnet, D.; Briole, P.; Arnaud, A. Deflation of Mount Etna monitored by spaceborne radar interferometry.
Nature 1995, 375, 567–570. [CrossRef]
26. Ferretti, A.; Monti-Guarnieri, A.; Prati, C.; Rocca, F.; Massonnet, D. InSAR Principles: Guidelines for SAR
Interferometry Processing and Interpretation; ESA Publications: ESTEC, The Netherlands, 2007.
27. Wei, M.; Sandwell, D.; Smith-Konter, B. Optimal combination of InSAR and GPS for measuring interseismic
crustal deformation. Adv. Space Res. 2010, 46, 236–249.
28. Goldstein, R.M.; Werner, C.L. Radar interferogram filtering for geophysical applications. Geophys. Res. Lett.
1998, 25, 4035–4038. [CrossRef]
29. Lee, J.S.; Cloude, S.R.; Papathanassiou, K.P.; Grunes, M.R.; Woodhouse, I.H. Speckle filtering and coherence
estimation of polarimetric SAR interferometry data for forest applications. IEEE Trans. Geosci. Remote Sens.
2003, 41, 2254–2263. [CrossRef]
30. Hooper, A.; Segall, P.; Zebker, H. Persistent scatterer interferometric synthetic aperture radar for crustal
deformation analysis, with application to Volcán Alcedo, Galápagos. J. Geophys. Res. Solid Earth 2007, 112,
B07407. [CrossRef]
31. Berardino, P.; Fornaro, G.; Lanari, R.; Sansosti, E. A new algorithm for surface deformation monitoring based
on small baseline differential SAR interferograms. IEEE Trans. Geosci. Remote Sens. 2002, 40, 2375–2383.
[CrossRef]
32. Hooper, A.; Zebker, H.A. Phase unwrapping in three dimensions with application to InSAR time series.
J. Opt. Soc. Am. A 2007, 24, 2737–2747. [CrossRef]
33. Hooper, A.J. Persistent Scatterer Radar Interferometry for Crustal Deformation Studies and Modeling of
Volcanic Deformation. Ph.D. Thesis, Stanford University, Stanford, CA, USA, 2006.
34. Usai, S. A New Approach for Long Term Monitoring of Deformations by Differential SAR Interferometry.
Ph.D. Thesis, Delft University of Technology, Delft, The Netherlands, 2001.
35. Schmidt, D.A.; Buergmann, R. Time-dependent land uplift and subsidence in the Santa Clara valley,
California, from a large interferometric synthetic aperture radar data set. J. Geophys. Res. Solid Earth 2003,
108, 2416. [CrossRef]
36. Notti, D.; Calò, F.; Cigna, F.; Manunta, M.; Herrera, G.; Berti, M.; Meisina, C.; Tapete, D.; Zucca, F.
A User-Oriented Methodology for DInSAR Time Series Analysis and Interpretation: Landslides and
Subsidence Case Studies. Pure Appl. Geophys. 2015, 172, 3081–3105. [CrossRef]
37. Crosetto, M.; Monserrat, O.; Iglesias, R.; Crippa, B. Persistent Scatterer Interferometry. Photogramm. Eng.
Remote Sens. 2010, 76, 1061–1069.:10.14358/PERS.76.9.1061. [CrossRef]
38. Sadarviana, V. Pemanfaatan Metode Geodetik untuk Mengestimasi Karakteristik Tipe dan Bidang Gelincir
pada Zona Longsor, Wilayah Studi: Zona Longsor Ciloto-Puncak, Jawa Barat. Ph.D. Thesis, Institut
Teknologi Bandung, Bandung, Indonesia, 2006.
39. Notti, D.; Herrera, G.; Bianchini, S.; Meisina, C.; García-Davalillo, J.C.; Zucca, F. A methodology for
improving landslide PSI data analysis. Int. J. Remote Sens. 2014, 35, 2186–2214. [CrossRef]
40. Barnhart, W.; Lohman, R. Characterizing and estimating noise in InSAR and InSAR time series with MODIS.
Geochem. Geophys. Geosyst. 2013, 14. [CrossRef]
41. Colesanti, C.; Wasowski, J. Investigating landslides with space-borne Synthetic Aperture Radar (SAR)
interferometry. Eng. Geol. 2006, 88, 173–199. [CrossRef]Geosciences 2020, 10, 156 16 of 16
42. Schlögel, R.; Doubre, C.; Malet, J.P.; Masson, F. Landslide deformation monitoring with ALOS/PALSAR
imagery: A D-InSAR geomorphological interpretation method. Geomorphology 2015, 231, 314–330. [CrossRef]
43. Sugalang. Landslide in Ciloto Area, West Java, Indonesia. Master’s Thesis, Lulea University of Technology,
Lulea, Sweden, 1989.
44. Sadarviana, V.; Abidin, H.Z.; Santoso, D.; Kahar, J.; Tisnasendjaja, A.R. The GPS Data Campaign for the Slip
Surface Estimation Ciloto Landslide Zone Case Study, West Java, Indonesia. In Proceedings of the XXV
FIG International Congress 2014, Kuala Lumpur, Malaysia, 16–21 June 2014; International Federation of
Surveyors: Copenhagen, Denmark, 2014.
45. Berti, M.; Corsini, A.; Franceschini, S.; Iannacone, J.P. Automated classification of Persistent Scatterers
Interferometry time series. Nat. Hazards Earth Syst. Sci. 2013, 13, 1945–1958. [CrossRef]
46. Kalia, A. Classification of Landslide Activity on a Regional Scale Using Persistent Scatterer Interferometry at
the Moselle Valley (Germany). Remote Sens. 2018, 10, 1880. [CrossRef]
c 2020 by the authors. Licensee MDPI, Basel, Switzerland. This article is an open access
article distributed under the terms and conditions of the Creative Commons Attribution
(CC BY) license (http://creativecommons.org/licenses/by/4.0/).You can also read