A Data-Driven Approach for Accurate Rainfall Prediction - arXiv
←
→
Page content transcription
If your browser does not render page correctly, please read the page content below

1

                                                                                    A Data-Driven Approach
                                                                                for Accurate Rainfall Prediction
                                                                Shilpa Manandhar, Student Member, IEEE, Soumyabrata Dev, Member, IEEE, Yee Hui Lee,
                                                                Senior Member, IEEE, Yu Song Meng, Member, IEEE, and Stefan Winkler, Fellow, IEEE

                                                    Abstract—In recent years, there has been growing interest in                  readings only under no-rain conditions [4]. Similarly, satellite-
arXiv:1907.04816v1 [physics.ao-ph] 10 Jul 2019

                                                 using Precipitable Water Vapor (PWV) derived from Global                         based PWV retrieval has poor temporal resolution. Compared
                                                 Positioning System (GPS) signal delays to predict rainfall.                      to these technologies, GPS provides good spatio-temporal
                                                 However, the occurrence of rainfall is dependent on a myriad
                                                 of atmospheric parameters. This paper proposes a systematic                      resolution and is suitable for all weather conditions.
                                                 approach to analyze various parameters that affect precipitation                    With the rapid deployment of GPS monitoring stations at
                                                 in the atmosphere. Different ground-based weather features like                  local, regional, and global scales, there has been a renewed
                                                 Temperature, Relative Humidity, Dew Point, Solar Radiation, PWV                  interest in using GPS-derived PWV for the prediction of
                                                 along with Seasonal and Diurnal variables are identified, and a                  rainfall. Seco et al. [5], Manandhar et al. [6] and Shi et al. [7]
                                                 detailed feature correlation study is presented. While all features
                                                 play a significant role in rainfall classification, only a few of them,          have presented some cases of severe- and moderate- rainfall
                                                 such as PWV, Solar Radiation, Seasonal and Diurnal features,                     events to indicate the feasibility of GPS-derived PWV for
                                                 stand out for rainfall prediction. Based on these findings, an                   rainfall monitoring and forecasting. GPS-derived PWV was
                                                 optimum set of features are used in a data-driven machine                        also used for studying a heavy rainfall event in Japan [8]
                                                 learning algorithm for rainfall prediction. The experimental                     and flash flood events in France [9]. However, Shi et al. [7]
                                                 evaluation using a four-year (2012-2015) database shows a true
                                                 detection rate of 80.4%, a false alarm rate of 20.3%, and an                     concluded that high PWV does not necessarily indicate the
                                                 overall accuracy of 79.6%. Compared to the existing literature,                  occurrence of rainfall; external dynamic factors also play a
                                                 our method significantly reduces the false alarm rates.                          role in triggering a rain event. In [10]–[12], PWV and its
                                                    Index Terms—precipitation, PWV, remote sensing, machine                       derivatives of 6-hour duration are used in forecasting a rain
                                                 learning.                                                                        event within the next 6 hours. Results have shown a detection
                                                                                                                                  rate of above 80%, but the false alarm rates are also high at
                                                                           I. I NTRODUCTION                                       60-70%. Therefore, it can be concluded that PWV values are a
                                                                                                                                  good indicator of rain, but other factors need to be considered
                                                       AINFALL initiation is a dynamic process and is in-
                                                 R     fluenced by a myriad of atmospheric parameters. The
                                                 water vapor content of the atmosphere is one such important
                                                                                                                                  to improve the accuracy of prediction of rainfall events.
                                                                                                                                     Li et al. [13] suggested that meteorological parameters like
                                                                                                                                  temperature along with PWV could be useful for prediction
                                                 parameter. It is generally explained in terms of Precipitable                    of rainfall. Similarly, Sharifi et al. [14] proposed to use the
                                                 Water Vapor (PWV) – a measure of the total water vapor                           relative humidity anomaly along with the PWV anomaly
                                                 stored in a column of the atmosphere. It is an important                         values to improve the prediction accuracy of rainfall events.
                                                 indicator of water vapor climatology in the lower troposphere                    In the literature, there are only a few papers that combine
                                                 [1], [2]. Nowadays, Global Positioning System (GPS) signal                       different weather features and use a machine-learning based
                                                 delay is extensively being used to estimate PWV, because GPS                     methodology for rainfall prediction [15]–[17]. Most of these
                                                 meteorology offers improved spatial and temporal resolutions                     focus on implementation and inter-comparison of different
                                                 for water vapor variations compared to other existing tech-                      machine learning algorithms. However, for the meteorology
                                                 niques like radiosondes, microwave radiometers and satellite-                    community, it is more interesting to identify the important
                                                 based instruments. Radiosondes are generally launched only                       parameters for rainfall prediction, their inter-dependency and
                                                 twice a day and are not released during severe weather events                    their level of contribution in the prediction.
                                                 [3]. Microwave radiometers have sparse station distribution                         In this paper, a detailed study of different weather parame-
                                                 as the instrument cost is high. They are of limited value in                     ters is presented. Along with the different weather parameters,
                                                 climate studies, particularly in predicting and tracking heavy                   the seasonal and diurnal variables are also considered, which
                                                 rainfall cases, because radiometers can provide reliable PWV                     are generally neglected in most related studies. These weather
                                                    Manuscript received 16th Aug, 2018, revised 10th Dec, 2018, accepted          parameters and seasonal factors are individually assessed for
                                                 18th June, 2019. This work was supported in part by the Defence Science          rainfall prediction. Those parameters that are important for
                                                 and Technology Agency, Singapore.                                                rainfall prediction are identified, and a machine learning algo-
                                                    S. Manandhar and Y. H. Lee are with the School of Electrical and Electronic
                                                 Engineering, Nanyang Technological University, Singapore.                        rithm is implemented, which shows significant improvements
                                                    S. Dev is with ADAPT SFI Research Centre, Trinity College Dublin,             in rainfall prediction accuracy as compared to the existing
                                                 Ireland.                                                                         literature.
                                                    Y. S. Meng is with National Metrology Centre, Agency for Science,
                                                 Technology and Research (A∗ STAR), Singapore.                                       The rest of this paper is organized as follows. Section II
                                                    S. Winkler is with School of Computing, National University of Singapore.     gives a brief overview of the weather station data and GPS
2

data that are used in this paper. Section III identifies different    was derived using radiosonde data from 174 stations in our
weather parameters that can be useful for rainfall prediction.        previous paper [25]:
Section IV gives a detailed analysis of the interdependency of
                                                                      P I = [−sgn(La ) · 1.7 · 10−5 |La |hf ac − 0.0001]
different weather parameters. Section V describes the mathe-
                                                                                   2π(DoY − 28)
matical tools and methods that are used. Section VI discusses                · cos                + 0.165 − 1.7 · 10−5 |La |1.65 + f,
the rainfall prediction results.. Finally, conclusions and future                     365.25
work are presented in Section VII.                                                                                                (2)
                                                                      where La is the latitude, DoY is day-of-year, hf ac = 1.48
  II. M ETEOROLOGICAL S ENSOR DATABASE AND DATA                       for stations from northern hemisphere and 1.25 for stations
                   P ROCESSING                                        from southern hemisphere. f = −2.38 · 10−6 H, where H is
   In this section, we briefly describe the different parameters      the station height, which can be ignored for stations below
that are used in this paper, which include surface weather            1000m.
parameters and total column water vapor content.                         Here, the PWV values are calculated for tropical GPS
                                                                      stations; station ID: NTUS at (1.30◦ N, 103.68◦ E) with sta-
                                                                      tion height above sea level ≈ 79m, and SNUS at (1.29◦ N,
A. GPS-Derived Water Vapor Content                                    103.77◦ E) with station height above sea level ≈ 63m, both
   PWV values (in mm) are derived from GPS signal delays.             located in Singapore. NTUS is under IGS network, and
GPS signal delays, generally referred to as the zenith total          SNUS is part of the Singapore Satellite Positioning Reference
delay (ZTD), can be broadly classified into zenith wet delay          Network (SiReNT) under Singapore Land Authority (SLA)
(ZWD) and zenith dry delay (or hydrostatic delay) (ZHD). Out          [26]. PWV can then be calculated for NTUS and SNUS using
of these delays, ZHD contributes about 90% of the total zenith        Eq. (1)-(2) with respective values for La , hf ac , H and DoY .
delay and is dependent on the surface pressure, temperature           The resulting PWV values have a temporal resolution of 5
and refractive index of the troposphere [18]. In contrast, ZWD        minutes. In this paper, 4 years (2012-2015) of PWV data from
contributes very little to the total zenith delay and is a function   NTUS and 1 year (2016) of PWV data from SNUS are used.
of atmospheric water vapor profile and humidity. ZWD is used
for the calculation of PWV as ZWD is related to the moisture
                                                                      B. Weather Station Data
profile of the atmosphere.
   There are different empirical models that can be used to de-          In addition to the PWV values, we use different surface
rive ZHD, such as the Saastamonien equation, VMF1 model or            weather parameters like temperature (T , ◦ C), relative humidity
Static model. The Saastamonien equation uses pressure values          (RH,%), dew point temperature (DP T , ◦ C) and solar ra-
to calculate the hydrostatic delays [19]. The actual pressure         diation (SR, W/m2 ). The surface weather parameters along
and temperature values are not readily available for all the GPS      with the rainfall rates (mm/hr) are recorded by the weather
stations. In such cases, pressure values derived from empirical       stations co-located with the GPS stations. The weather station
models like GPT (Global Pressure Temperature) or GPT2                 at NTUS records weather data at an interval of 1 minute and is
can be used [20]. Alternatively, Vienna Mapping Function I            maintained by our group. The weather station at SNUS records
(VMFI) model can be used, which provides ZHD values for               data at an interval of 5 minutes and is available online [27].
different stations [21]. The VMF1 model derived hydrostatic           4 years (2012-2015) of weather variables from NTUS and 1
delays are provided in the Global Geodetic Observing System           year (2016) of weather variables from SNUS are used. The
(GGOS) website [22] and are based on meteorological data              GPS and weather station data from NTUS station are used in
from Numerical Weather Models (NWMs). ZHD can also be                 the proposal of the algorithm and data from SNUS station are
derived using a static model that is based on the station height      used in benchmarking and validation.
only [23]. Static models are more appropriate for tropical               In addition to the data from the weather station, we also use
stations, where temperature variations are minimal.                   images from the ground-based sky cameras called Wide Angle
   It is relatively difficult to calculate ZWD as there are           High Resolution Sky Imaging System (WAHRSIS) co-located
no empirical models. For this paper, the ZWD values are               with NTUS station. This allows for a visual validation of the
processed using GIPSY-OASIS software (GPS Inferred Posi-              atmospheric conditions. In the following sections, the weather
tioning System Orbit Analysis Simulation Software package)            station parameters are sampled every 5 minutes to match the
and its recommended scripts [24]. The GIPSY processing was            GPS-PWV timings for the NTUS station.
carried out using the default ZHD model of the software (static
ZHD model) with an elevation cutoff angle of 10◦ and the                                III. A PPROACH & T OOLS
Niell mapping function.                                                  In this section, we describe the different tools and tech-
   Once the ZWD (δLow ) values are estimated using the soft-          niques that have been implemented to use the various weather
ware, PWV is calculated using 1, as follows:                          features for prediction of rain events.
                                P I · δLow
                      PWV =                ,                   (1)
                                    ρl                                A. Supervised Machine Learning Technique
                                                           3
where ρl is the density of liquid water (1000 kg/m ). P I               For the purpose of rainfall prediction, the samples are la-
is a dimensionless factor determined by using Eq. (2), which          beled as either rain or no-rain. Therefore, supervised machine
3

learning techniques can be implemented for rainfall prediction.                  year 2015 for NTUS station there are 525, 120 valid data
Artificial Neural Network (ANN) and Support Vector Machine                       points. Out of these, there are only 5, 017 data points with rain,
(SVM) are the most commonly used supervised machine                              referred to as minority cases, whereas there are 520, 103 data
learning techniques for dealing with such geoscience-based                       points without rain (majority cases). The minority to majority
problems [28]. We use SVM as it is effective and computa-                        ratio here is nearly 1 : 104, which poses the problem of a
tionally efficient.                                                              highly imbalanced dataset. Training a model with such skewed
   SVM is a parametric method that generates a hyperplane                        data (skewed towards non-rain data points) would result in
or a set of hyperplanes in the vector space by maximizing                        a biased model, which is dominated by the characteristics
the margin between classifiers to the nearest neighbor data                      of the majority database [30], [31], and compromises the
[29]. In this paper, we use SVM to classify rain and no-rain                     generalization ability of the algorithm [32].
cases using different weather parameters as features. Consider                      Therefore, we employ a downsampling technique that bal-
a feature matrix X of dimension m × n, where n is the                            ances the number of positive and negative labels. We consider
number of features (weather variables like T , DP T , RH,                        all the cases from the minority scenario and the cases from
etc.) and m is the number of samples. Consider an output                         majority scenario are randomly chosen such that the minority
matrix Y , a column matrix of dimension m × 1, where values                      to majority ratio is balanced. There is a general practice to
can be either 1 or −1, indicating rain or no-rain, respectively.                 make the ratio 1 : 1, but other ratios can also be considered
SVM is trained with a data set of i points represented by                        [33]. All the prediction results presented in this paper are after
(x~1 , y1 ), (x~2 , y2 ), . . . , (x~k , yk ), where x~i is the ith row of the   implementing the downsampling technique. In tests without
feature matrix X and yi is the ith coefficient of the output                     downsampling, the accuracy of the algorithm dropped and the
matrix Y . k depends on the training set size.                                   confidence interval range increased significantly.
   Based on the training samples, SVM generates a maximum-
margin hyperplane that separates the group of points x~i for                           IV. F EATURE I DENTIFICATION & C ORRELATION
which yi = 1 (i.e. rain) from the group of points for which
yi = −1 (i.e. no-rain). This is done such that the distance                      A. Features
between the hyperplane and the nearest point x~i from either                        We identify five important weather features: T , RH, SR,
group is maximized. After the SVM is trained, the remaining                      DP T and P W V . These weather features have inherent diur-
samples (m − i) are used in testing the model. The predicted                     nal and seasonal properties, which can be helpful in rainfall
output is then compared to the real observation data and                         prediction.
evaluation metrics are calculated.                                                  In addition, identify the seasonal and diurnal features for
                                                                                 our proposed task. In the tropical climate of Singapore, four
                                                                                 main seasons are experienced – North-East (NE) Monsoon
B. Evaluation Metrics
                                                                                 from November to March, First-Inter (FI) Monsoon from April
   The performance of rainfall prediction methods are gen-                       to May, South-West (SW) Monsoon from June to October,
erally expressed in terms of true detection and false alarm                      and Second-Inter (SI) Monsoon from October to November.
rates [10], [11]. Table I shows the confusion matrix, indicating                 The occurrence of different seasons changes slightly from
all possible cases when the predicted output is compared to the                  year to year as reported in the yearly weather report [34].
real observation data. In the evaluation, the true positive (T P ),              The rainfall pattern shows some correlation with the seasons.
true negative (T N ), false positive (F P ) and false negative                   We often experience late afternoon showers during the NE
(F N ) samples are calculated. The true detection rate is defined                Monsoon. Sumatra squalls are experienced during pre-dawn to
as T D = T P/(T P + F N ), the false alarm rate is defined as                    midday, and short-lived rainfall often takes place in the after-
F A = F P/(T N + F P ). We also report accuracy, which is                        noon during the SW Monsoon. During inter-monsoon seasons,
defined as A = (T P + T N )/(T P + F N + T N + F P ), and                        afternoon to early evening rain events are common [34], [35].
the missed detection rate of the algorithm, M D = 1 − T D.                       Therefore, we consider day-of-year (DoY ) as a feature that
                                                                                 takes the seasonal effect into consideration.
                    TABLE I: Confusion Matrix                                       The diurnal characteristics of all the features can be clearly
                            Predicted (No)        Predicted (Yes)                observed in the time series observation from Fig. 3, which
        Actual (No)      True Negative (TN)      False Positive (FP)             will be discussed in detail in Section IV-C. We consider hour-
        Actual (Yes)     False Negative (FN)     True Positive (TP)
                                                                                 of-day (HoD) as a feature that takes the diurnal effect into
                                                                                 consideration.
                                                                                    For HoD feature, the hour values reset after every 24 hours,
                                                                                 and for the DoY feature the number of days resets after
C. Downsampling Technique                                                        every 365 days (366 for leap years). Thus, the DoY and the
   In the following, SVM is trained and tested using our                         HoD features are both cyclic in nature, as the same values
weather database. The weather data have a temporal resolution                    repeat after a specific period of time. Therefore, each of these
of 1 minute, therefore one year database generally includes a                    features DoY and HoD are expressed into its sine and the
total of 365 ∗ 1440 data points. Out of these 525, 600 data                      cosine components so that their cyclic properties are properly
points, there are far fewer data points with rain than without,                  captured. Eq. (3) and (4) are used for expressing the feature
because rain is a relatively rare event. For example in the                      HoD into its sine and cosine components; HoDx and HoDy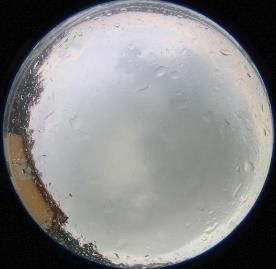
4
Correlation of Different Features (NTUS; 2012-2015)
respectively and are plotted as shown in Fig. 1(a). The DoY 1
feature can be similarly expressed into its sine and cosine DoYx
0.8
forms; DoYx and DoYy using Eq. (5) and (6) respectively. DoYy
0.6
Fig. 1(b) shows the DoYx and DoYy values.
HoDx 0.4
2π · HoD
HoDx = cos (3) HoDy 0.2
24
Features
T 0
2π · HoD
HoDy = sin (4) -0.2
24 SR
2π · DoY -0.4
RH
DoYx = cos (5)
365 DPT
-0.6
2π · DoY -0.8
DoYy = sin (6) PWV
365 -1
DoYx DoYy HoDx HoDy T SR RH DPT PWV
In the rest of the paper, if any method includes the HoD or
Features
DoY features, their sine and cosine components are used.
Fig. 2: Degree of correlation between various features (best
viewed in color).
1 1
00 345
DoY (Y−Component)
50
HoD (Y−Component)
0.5 0.5
RH. For temperate regions, a higher degree of correlation is
0 18 06 0
observed between RH and P W V [37] as temperate regions
256 have a much wider temperature range over different seasons
−0.5 −0.5
156 and locations. This has a direct impact on the behavior and
12 −1 correlation of these variables.
−1
−1 −0.5 0 0.5 1 −1 −0.5 0 0.5 1
HoD (X−Component) DoY (X−Component) Here the sine and cosine components of the DoY and the
(a) (b) HoD features clearly show correlation with features like T ,
RH, DP T and SR. The use of the cyclic properties of HoD
Fig. 1: (a) X and Y components of HoD; (b) X and Y and DoY help to clearly show the existing correlation between
components of DoY . The numbers indicate the hour-of-day the weather variables as well as the seasonal and diurnal
and day-of-year in plots (a) and (b) respectively. factors; this property was underestimated previously when the
HoD and the DoY values were directly used instead of their
sine & cosine components [36].
In summary, different weather features along with seasonal
B. Feature Correlation
and diurnal features were identified. The correlations between
It is important to analyze the correlation between different these features were studied and explained. However, only RH
features, because if two features are perfectly correlated, the and T features have a very high correlation coefficient. This
second feature will not provide any additional information, as indicates that these weather variables can individually con-
it is already determined by the first [36]. tribute towards a particular weather phenomenon. Therefore,
The degree of correlation amongst all the features is shown in next section all these weather variables are studied with
in Fig. 2. Data from year 2012-2015 of NTUS station are respect to rain events.
used in plotting the figure. Various observations can be made
from the off-diagonal elements. T has a good correlation with
features RH, SR, and DP T . A high negative correlation C. Time Series Observation
coefficient of around −0.9 is observed between T and RH, In this section, we study a time series plot of different
which is expected because when the air is warm, it can hold weather features for the GPS station NTUS, shown in Fig. 3.
more water vapor, thus the saturation point increases and the In window W1, rain events can be observed at 14:00 hours
relative humidity becomes lower. T and SR, and T and DP T and at 18:00 hours. With respect to these rain events, different
have positive correlation coefficients of 0.6 and 0.5. During properties of the weather parameters can be analyzed. For both
the day time, as the sun rises, SR and T values both increase, rain events, PWV significantly increases within 3 hours before
while RH decreases. The features RH and SR are negatively the rainfall starts. For the rain event at 14:00, the PWV values
correlated with a correlation coefficient of around −0.6. This start to increase at around 11:00. For the rain event at 18:00,
can be explained as SR values are lowest in the night, whereas PWV starts to increase at around 15:00. Such an observation
RH is generally very high at night on a tropical island like was also reported in [35], which statistically showed that PWV
Singapore. These observations are supported by the time series in the tropical region increases within 2 to 3 hours before
plot in Fig. 3. rainfall.
P W V does not show strong correlation with any of the Still in window W1, the temperature drops during the
other features, except for a small positive correlation with rain as the surface cools. It decreases and reaches values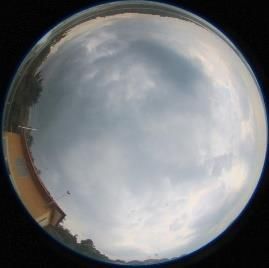
5

                                                                        W1                     Time Series of Different Weather Parameters                   W2                         W3
                           65                                                                                                                                                                        50

                                                                                                                                                                                                           Rainfall Rate(mm/hr)
                                      (a)
  PWV (mm)

                           62
                                                                                                                    PWV
                                                                                                                    Rainfall Rate
                           59

                           56                                                                                                                                                                        0
                             0               3       6         9       12       15        18      21       0       3       6            9         12         15      18        21       0    3   6
                                                          Nov 28, 2015                                    Time of Day (Hours)                             Nov 29, 2015
                           35                                                                                                                                                                        100

                                                                                                                                                                                                            Relative Humidity (%)
Temperature (Deg)

                                      (b)                                                                    Surface Temperature
                           30                                                                                Dewpoint Temperature                                                                    90
                                                                                                             RH

                           25                                                                                                                                                                        80

                           20                                                                                                                                                                     70
                                0            3        6        9       12       15        18      21       0       3       6            9         12        15       18        21       0    3   6
                                                          Nov 28, 2015                                    Time of Day (Hours)                             Nov 29, 2015
                         1500
Solar Radiation (W/m2)

                                       (c)
                                                                                                               Solar Radiation
                         1000

                          500

                            0
                                0            3        6        9      12        15        18      21       0       3       6            9         12         15      18        21       0    3   6
                                                                                                          Time of Day (Hours)

                                    14:05; Nov 28, 2015                 17:30; Nov 28, 2015                                         12:00; Nov 29, 2015           15:15; Nov 29, 2015

   Fig. 3: Time series of different weather parameters for NTUS. (a) PWV (blue dashed line) in mm and Rainfall Rate (green
   solid line) in mm/hr; (b) Surface Temperature in ◦ C (solid magenta line), Dew point in ◦ C (dashed cyan line) and Relative
   humidity in% (red dots); (c) Solar Radiation in W/m2 . The X-axis for all the subplots represents the time of day (local time,
   UTC+8). The sky images captured by WAHRSIS are also shown for specific times of the day. Windows W1, W2 highlight
   day time rain events, and W3 highlights a night time rain event (best viewed in color).

   which are very similar to the dew point. At the same time,                                                        show fluctuations in the day time which could be correlated to
   a sharp increase in RH can be noticed during the rain events,                                                     rainfall, but in the night time they generally exhibit very little
   reaching 90 − 100%. The solar radiation on the other hand                                                         variation. As can be seen from Fig. 3(b), relative humidity
   decreases before and during the rain due to the presence of the                                                   is always high (nearly 100%) during the night and the early
   rain clouds. The WAHRSIS images taken during and before                                                           morning hours. Similarly, the temperature and the dew point
   the rain events at 14:05 and at 17:30 respectively show the                                                       readings are almost the same during the night and the early
   presence of thick dark clouds, which block the sun and lead                                                       morning hours. Naturally, solar radiation is zero throughout
   to a significant decrease in solar radiation.                                                                     the night.
      Similar observations can be made from window W2, where                                                            PWV also has a distinct diurnal pattern [35], [39], but unlike
   a significant increase in PWV can be noticed before the start                                                     T , DP T , RH and SR values, PWV fluctuates during the night
   of the rain event. PWV starts to increase at around 12:00 for                                                     in response to rain events. Window W3 shows a midnight rain
   a rain event that occurs at 15:30. The temperature drops to the                                                   event. A distinct increment in PWV can be observed 3 hours
   dew point, and RH increases to 100% during the rain event.                                                        before the start of the rain event at 00:30. This observation
   Similarly, the solar radiation decreases before and during the                                                    is correlated with the observations made for the day time rain
   rain event. The WAHRSIS image taken at 15:15 shows the                                                            events from sections W1 and W2. As expected, T , RH, DP T
   presence of clouds. A clear sky image taken at 12:00 is also                                                      and the SR do not show any significant changes corresponding
   shown for reference (the black dot in the image marks the                                                         to this midnight rain event.
   position of the Sun). Solar radiation can reach up to 1000                                                           In summary, we observed the different weather parameters
   W/m2 in Singapore for a clear sky day [38], but values can                                                        which are important for rainfall prediction. T , RH and DP T
   fall very low before and during a rain event.                                                                     show sudden changes during the rain but not before. Both
      Weather parameters like T , RH, DP T and SR show a very                                                        PWV and SR show relatively distinct changes before a rain
   distinct behavior during the day and at night. These variables                                                    event in day time, but only PWV values show distinct changes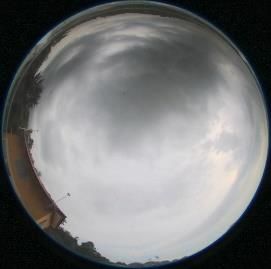
6

                                                                                                                     88                                                                 63
                              PWV                                                                                             PWV           T             RH              DPT      SR
                                           T               RH           DPT        SR
                     88                                                                  50

                                                                                                                                                                                             False Alarm Rate (%)
                                                                                              False Alarm Rate (%)
                                                                                               True Detection (%)
True Detection (%)

                                                                                                                     78                                                                 53

                     78                                                                  40
                                                                                                                     68                                                                 43

                     68                                                                  30
                                                                                                                     58                                                                 33

                     58                                                                  20
                          TDFA TDFA TD FA TDFA TDFA TDFA TD FA TD FA TD FA                                                TD FATDFA TDFATDFA TD FATD FA TD FA TDFA TD FA
                          (D)(D)(N)(N) (D)(D)(N)(N) (D)(D)(N)(N) (D) (D)(N)(N) (D) (D)                                    (D)(D)(N)(N) (D)(D)(N)(N) (D)(D)(N)(N) (D)(D)(N)(N) (D) (D)
                                               (a) Rainfall classification                                                                      (b) Rainfall prediction

 Fig. 4: Performance of individual features for Rainfall classification (a) and prediction (b). T D and F A rates are represented
 in black and blue, respectively. (D) and (N) indicate results for Day and Night. Error bars show 95% confidence intervals. T D
 ranges are shown on the left y axis, F A ranges on the right (best viewed in color).

 before a night-time rain event. Time series plots for few more                                               significant changes before the start of a rain event, which are
 days are uploaded as supplemental material.                                                                  useful for rainfall prediction. Thus, in this section, we analyze
                                                                                                              the performance of individual features for rainfall classification
                                       V. R AINFALL P REDICTION                                               and prediction. To show the effect of the time-of-day, the
                                                                                                              results are segregated into day and night time.
    In our previous work [35] we used P W V and its second
                                                                                                                 The results for this section are obtained by using four years
 derivative to develop a model for the tropical region to predict
                                                                                                              (2012-2015) of data from the NTUS station. Fig. 4(a) shows
 a rain event with a lead time of 5 minutes based on data
                                                                                                              the rainfall classification results in terms of true detection and
 from the 30 minutes prior. The model was sub-divided into 3
                                                                                                              false alarm rates for day and night. Similarly Fig. 4(b) shows
 sections based on the seasons (NE-, SW- and Inter-monsoons).
                                                                                                              the results for rainfall prediction. From Fig. 4(a), it can be
 For this paper, we use the same rain prediction scenario
                                                                                                              observed that all features can clearly differentiate rain and no-
 whereby, (1) we divide our feature database into segments
                                                                                                              rain conditions in the day time. Most of these features have
 consisting of 30 minutes of data, (2) for each 30 minute
                                                                                                              good performance for rainfall classification in night-time as
 segment, we check whether or not a rain event occurs after
                                                                                                              well except for solar radiation. Since there is no solar radiation
 a lead time of 5 minutes, and (3) all rainfall within a 30
                                                                                                              at night, it has no effect on the rain classification or prediction;
 minute window or less is considered as a single rain event [40].
                                                                                                              therefore, we report only day time results for SR.
 Different from [35], here we study the combined effect of                                                       From Fig. 4(b) it can be observed that unlike in the
 using different meteorological parameters along with P W V                                                   classification scenario, not all features have good true detection
 in rainfall prediction. Instead of separate seasonal models, we                                              and false alarm rates for rainfall prediction. Similar to the
 combined them into a single model using the seasonal and                                                     rainfall classification results, SR gives the highest T D during
 diurnal features.                                                                                            daytime, whilst it is not useful in the night. While features
    The methodologies described in Section III are implemented                                                like T , RH and DP T show a good capability in rainfall
 to develop this rainfall prediction model. The evaluation met-                                               classification, they are not very useful for rainfall prediction
 rics are reported after the model is trained and tested using                                                as these parameters change only during the rain but not before.
 data from years 2012-2015 for NTUS station and data from                                                     P W V is the only feature which shows a good separation
 year 2016 for SNUS station.                                                                                  between T D and F A for rainfall prediction in both day and
                                                                                                              night cases. These results are consistent with our time series
 A. Assessment of Individual Features                                                                         observation in Fig. 3.
    From the discussion of the time series observation (cf.                                                      Therefore, it is clear that not all features are useful for rain-
 Fig. 3), it was observed that a few weather parameters (T ,                                                  fall prediction, and the accuracy is expected to improve with
 RH and DP T ) show sudden changes during rain compared                                                       the inclusion of the diurnal and seasonal features combined
 to non-rain hours. Such a property is useful in classifying rain                                             with the weather features.
 and no-rain conditions. However, since these weather variables
 do not show any significant changes before the start of a rain                                               B. Selection of Optimal Features
 event, they might not be useful for rainfall prediction. On the                                                In [35], rainfall prediction is done based on PWV and
 other hand, weather variables like P W V and SR do show                                                      seasonal behavior only. In this section, we analyze how the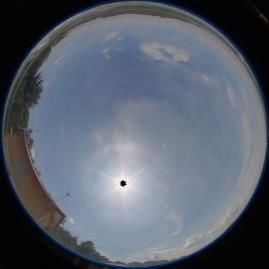
7
90 45 90 45
True Detection and Accuracy (%)
True Detection and Accuracy (%)
False Alarm Rate (%)
False Alarm Rate (%)
80 35 80 35
70 25 70 25
60 15 60 15
50 5 50 5
PWV, DoY + SR + RH + SR + T + RH + DPT + T All All - All - All - All - All - All -
& HoD + SR + RH + SR (All) DPT T RH PWV DoY & HoD SR
(a) Adding features (b) Removing features
Fig. 5: Rainfall prediction performance when different features are (a) added or (b) removed one at a time. T D and F A rates
are represented by solid black and blue lines, respectively, while A is represented by a dashed black line. Error bars show
95% confidence intervals. T D and A ranges are shown on the left y axis, F A ranges on the right (best viewed in color).
rainfall prediction performance improves or deteriorates by plot are removed from the pool of all the 7 features leaving
adding or removing specific features. The results discussed behind always 6 features. When only RH is removed from the
in the following are obtained by using the four years (2012- pool, it is labeled “All - RH”. For our analysis, the readings
2015) data from the NTUS station. corresponding to the elimination of an individual feature are
1) Adding Features: We start by taking the combination compared to the first reading when all the features are used.
of P W V , HoD and DoY features as suggested above. Then
As mentioned earlier, when all the features are used, a T D
the other features are added successively. The first reading
value of 83.0%, a F A value of 20.6% and an overall accuracy
in Fig. 5a is obtained by using the combination of P W V ,
of 79.4% are obtained. When one of the features DP T , T ,
seasonal (DoY ) and diurnal (HoD) features. The subsequent
or RH is removed from the pool of all features, T D values
readings are obtained when other features are added to the
decrease slightly and F A and A values remain same as that of
previous pool as shown by the labels. We run the experiment
the first reading. This indicates that the presence of either of
over 50 iterations, with 30% of the total data as the training set
these features do not contribute much for rainfall prediction.
and remainder as the test set. The reported evaluation metrics
However, when the P W V feature is eliminated, a significant
are an average over the 50 iterations. Therefore, along with the
drop in the T D values can be noticed as compared to the first
mean evaluation metrics, we also report their 95% confidence
reading. This indicates that the P W V values play an important
intervals.
role in maintaining a high detection rate and high accuracy.
The first reading of Fig. 5a shows a T D rate of 79.8%,
When the seasonal and the diurnal features (DoY and HoD)
F A rate of 31.9%, and an overall accuracy of 68.2% for
are removed from the pool of all the features, T D remains
rainfall prediction with a lead time of 5 minutes. When SR is
almost the same, whereas F A increases by almost 8.5% and
added in the second step, the F A rate decreases significantly to
the accuracy decreases compared to the first reading. Similarly,
20.3%, the T D rate improves and reaches 80.4%. Therefore,
when the SR feature is eliminated, the F A values increase
the overall accuracy increases to 79.6%.
from 20.6% to 29.4%. These results show that the features
From Fig. 4 it was observed that the features T , RH and
SR, DoY and HoD are important in helping to reduce the
DP T are not significant in rainfall prediction. Therefore, when
false alarm rate and increase the accuracy.
these features are subsequently added to the pool of features,
T D increases but so does F A. When all the features are Therefore, the features DP T , RH and T do not contribute
involved, the T D, F A and A values are 83.0%, 20.6% and to improving the T D rates, and removal of these features one
79.4% respectively. This experiment shows that the highest at a time actually improves the accuracy by slightly reducing
accuracy is achieved when the feature combination of P W V , false alarms. On the other hand, HoD, DoY and SR are
SR, DoY and HoD is used. important to control the false alarms, and P W V is important
2) Removing Features: To further elaborate on the above to maintain a high T D rate. This confirms our previous
findings, we now systematically eliminate features from the work [35], where P W V is shown to provide a good rainfall
pool one at a time and analyze prediction performance, as prediction ability. Similarly, different models were proposed
shown in Fig. 5b. The first reading is obtained by using all for different seasons for lowering the F A rates in [35], which
7 features for the rainfall prediction. The subsequent readings is in line with the newly introduced DoY and HoD features
are when the respective feature as shown by the x-axis of the and their importance for F A reduction.
8

   In summary, we conclude from these experiments that the           of false alarm rates. Compared to the literature, our approach
combination of the features P W V , SR, DoY and HoD gives            achieves a significant reduction of F A rates.
the best results. The T D rate for this combination is 80.4%,           As future work, we plan to study the impact of using
which corresponds to a missed detection rate of around 19.6%.        different weather features for different stations with a larger
The F A rate for this combination is 20.3%, and the overall          dataset. We will also consider the derivatives of features, as
accuracy is 79.6%.                                                   well as additional features like wind, cloud coverage, etc. for
                                                                     rainfall prediction with longer lead times.
C. Benchmarking
   In this section, the results obtained by using P W V , SR,                                      R EFERENCES
HoD and DoY features for rainfall prediction are compared to          [1] S. G. Jin, J. U. Park, J. H. Cho, and P. H. Park, “Seasonal variability
the literature. The true detection and false alarm rates achieved         of GPS-derived zenith tropospheric delay (1994-2006) and climate
by our proposed approach show a significant improvement –                 implications,” J. Geophys. Res., vol. 112, no. D9, June 2007, doi:
                                                                          10.1029/2006JD007772.
especially in terms of false alarm rates – over those reported        [2] S. G. Jin, Z. Li, and J. Cho, “Integrated water vapor field and multiscale
in [10], [11], [41], see Table II.                                        variations over China from GPS measurements,” J. Appl. Meteor. Clima-
                                                                          tol., vol. 47, pp. 3008–3015, Nov. 2008, doi: 10.1175/2008JAMC1920.1.
      TABLE II: Benchmarking with other approaches.                   [3] Z. Wang, X. Zhou, Y. Liu, D. Zhou, H. Zhang, and W. Sun, “Precipitable
                                                                          water vapor characterization in the coastal regions of China based on
                   Approach    TD (%)    FA (%)                           ground-based GPS,” Advances in Space Research, vol. 60, no. 11, pp.
                   Proposed     75-88     19-23                           2368–2378, Sep 2017.
                       [10]      75       60-70                       [4] T. Yeh, H. Shih, C. Wang, S. Choy, C. Chen, and J. Hong, “Determining
                       [11]      80        66                             the precipitable water vapor thresholds under different rainfall strengths
                       [41]      85        66                             in Taiwan,” Advances in Space Research, vol. 61, no. 3, pp. 941–950,
                                                                          2018.
                                                                      [5] A. Seco, F. Ramirez, E. Serna, E. Prieto, et al., “Rain pattern analysis
                                                                          and forecast model based on GPS estimated atmospheric water vapor
   Table III shows a detailed comparison between the proposed             content,” Atmospheric Environment, vol. 49, pp. 85–93, 2012.
method and the results reported in [35]. For all years (2012-         [6] S. Manandhar, Y. H. Lee, and S. Dev, “GPS derived PWV for rainfall
2015), by incorporating the effect of SR, HoD and DoY                     monitoring,” in Proc. International Geoscience and Remote Sensing
                                                                          Symposium (IGARSS), 2016.
with the P W V feature, the false alarm rate can be signifi-          [7] J. Shi, C. Xu, J. Guo, and Y. Gao, “Real-time GPS precise point
cantly lowered. On average, the F A rate is reduced by 16.2               positioning-based precipitable water vapor estimation for rainfall moni-
percentage points, with only a small reduction in T D. Similar            toring and forecasting,” IEEE Trans. Geosci. Remote Sens., vol. 53, no.
                                                                          6, pp. 3452–3459, June 2015.
results are observed for the PWV data from the SNUS GPS               [8] O. Shoji, M. Kunii, and K. Saito, “Assimilation of nationwide and global
station and the ground based data from the co-located weather             GPS PWV data for a heavy rain event on 28 July 2008 in Hokuriku and
station: When the features P W V , SR, DoY and HoD are                    Kinki, Japan,” Scientific Online Letters on the Atmosphere (SOLA), vol.
                                                                          5, pp. 45–48, 2009, doi:10.2151/sola.2009-012.
used for the rainfall prediction, the F A rates are reduced by        [9] H. Brenot, V. Ducrocq, A. Walpersdorf, C. Champollion, and O. Cau-
to less than half.                                                        mont, “GPS zenith delay sensitivity evaluated from high-resolution
                                                                          numerical weather prediction simulations of the 8-9 September 2002
              TABLE III: Comparison with [35].                            flash flood over southeastern France,” J. Geophy. Res., vol. 111, no.
                                                                          D15105, 2006, doi:10.1029/2004JD005726.
                                                Applied Algorithm    [10] P. Benevides, J. Catalao, and PMA. Miranda, “On the inclusion of GPS
                Years        Literature [35]      (P W V , SR,            precipitable water vapour in the nowcasting of rainfall,” Natural Hazards
  Station   (Rain Events)       (P W V )         DoY & HoD)               and Earth System Sciences, vol. 15, no. 12, pp. 2605–2616, Nov. 2015.
                            TD (%)     FA (%)   TD (%)     FA (%)    [11] Y. Yao, L. Shan, and Q. Zhao, “Establishing a method of short term
  NTUS       2012 (219)      88.5        36.4    75.0       19.1          rainfall forecasting based on GNSS-derived PWV and its application,”
             2013 (252)      84.9        43.7    78.8       23.1          Scientific Reports, vol. 7, Sept. 2017.
             2014 (231)      89.1        34.6    82.3       18.8     [12] Q. Zhao, Y. Yao, and W. Yao, “GPS-based PWV for precipitation
             2015 (222)      89.1        31.0    87.9       19.9          forecasting and its application to a typhoon event,” J. Atmospheric Sol.-
              Average        87.9        36.4    81.0       20.2          Terr. Phys., vol. 167, pp. 124–133, Jan. 2018.
  SNUS       2016 (195)      90.7        50.2    81.1       19.2     [13] P. W. Li., X. Y. Wang, Y. Q. Chen, and S. T. Lai, “Use of GPS signal
                                                                          delay for real-time atmospheric water vapour estimation and rainfall
                                                                          nowcast in Hongkong,” in Proc. 1st Int. Symp Cloud-prone & Rainy
                                                                          Area Rem. Sens., Oct. 2005, Hong Kong.
                                                                     [14] M. A. Sharifi, A. S. Khaniani, and M. Joghataei, “Comparison of GPS
            VI. C ONCLUSIONS & F UTURE W ORK                              precipitable water vapor and meteorological parameters during rainfall
                                                                          in Tehran,” Meteorol. Atmos. Phys., vol. 127, pp. 701–710, 2015.
   We have identified the different ground based weather             [15] K.C. Luk, J.E. Ball, and A. Sharma, “A study of optimal model lag
features which are important for the prediction of rain events.           and spatial inputs to artificial neural network for rainfall forecasting,”
                                                                          J. Hydrology, vol. 227, pp. 56–65, 2000.
A detailed analysis is done to study the interdependency of          [16] G. J. Sawale and S. R. Gupta, “Use of artificial neural network in data
these variables. We have incorporated seasonal and diurnal                mining for weather forecasting,” International J. Computer Sci. & Appl.,
factors into the model, along with weather variables. All the             vol. 6, no. 2, Apr. 2013.
                                                                     [17] E. Hernandez, V. Sanchez-Anguix, V. Julian, J. Palanca, and N. Duque,
features play a significant role in rainfall classification, while        “Rainfall prediction: A deep learning approach,” in Proc. Interna-
features like P W V , SR, DoY and HoD in particular show                  tional Conference on Hybrid Artificial Intelligence Systems, Apr. 2016,
potential for rainfall prediction as well. The P W V feature              DOI10.1007/978-3-319-32034-2_13.
                                                                     [18] T. A. Herring G. Elgered, J. L. Davis and I. I Shapiro, “Geodesy by
contributes the most to achieving a high detection rate, and              radio interferometry: Water vapor radiometry for estimation of the wet
the features SR, DoY and HoD contribute to a reduction                    delay,” J. Geophys. Res., vol. 96, no. B4, pp. 6541–6555, Apr 1991.
9
[19] P. Jiang, S. Ye, D. Chen, Y. Liu, and P. Xia, “Retrieving precipitable Shilpa Manandhar (S'14) received the B.Eng. de-
water vapor data using GPS zenith delays and global reanalysis data in gree (Hons.) in Electrical and Electronics engineer-
China,” Remote Sens., vol. 8, no. 5, pp. 2072–4292, 2016. ing from Kathmandu University, Dhulikhel, Nepal,
[20] J. Liu, X. Chen, J. Sun, and Q. Liu, “An analysis of in 2013, and the PhD degree from Nanayang Tech-
GPT2/GPT2w+Saastamoinen models for estimating zenith tropospheric nological University (NTU), Singapore, in 2019.
delay over Asian area,” Adv. Space Res., vol. 59, no. 3, pp. 824–832, She is currently working as a Research Fellow in
2017. NTU. Her research interests include remote sensing,
[21] A. Leontiev and Y. Reuveni, “Combining Meteosat-10 satellite image study of global positioning system signals to predict
data with GPS tropospheric path delays to estimate regional integrated meteorological phenomenon such as rain and clouds,
water vapor (IWV) distribution,” Atmos. Meas. Tech., vol. 10, no. 2, pp. and improvement of GPS localization.
537–548, 2017.
[22] Global Geodetic Observing System (GGOS), “Hydrostatic Delay,” http:
//vmf.geo.tuwien.ac.at/, [Last accessed: 26-June-2019].
[23] J. M. Astudillo, L. Lau, and T. Moore, “Analysing the zenith tro-
pospheric delay estimates in on-line precise point positioning (PPP)
services and PPP software packages,” Sensors, vol. 18, no. 2, Feb 2018.
Soumyabrata Dev (S'09-M'17) graduated summa
[24] NASA Earth Science Data Systems, “Crustal dynamics data information
cum laude from National Institute of Technology
system,” ftp://cddis.gsfc.nasa.gov/pub/gps/data/, [Last accessed: 26-
Silchar, India with a B.Tech. in 2010. Subsequently,
June-2019].
he worked in Ericsson as a network engineer from
[25] S. Manandhar, Y. H. Lee, Y. S. Meng, and J. T. Ong, “A simplified
2010 to 2012. Post that, he obtained his Ph.D. from
model for the retrieval of precipitable water vapor from GPS signal,”
Nanyang Technological University (NTU) Singa-
IEEE Trans. Geosci. Remote Sens., vol. 55, no. 11, pp. 6245–6253, Nov.
pore, in 2017. From Aug-Dec 2015, he was a visiting
2017.
student at Audiovisual Communication Laboratory
[26] Singapore Land Authority, “Singapore satellite positioning reference
(LCAV), École Polytechnique Fédérale de Lausanne
network,” https://www.sla.gov.sg/sirent/, [Last accessed: 26-June-2019].
(EPFL), Switzerland. Currently, he is a Postdoctoral
[27] Geography Weather Station, “National university of singapore, singa-
Researcher at ADAPT Centre, Dublin, Ireland. His
pore.,” https://inetapps.nus.edu.sg/fas/geog/, [Last accessed: 26-June-
research interests include remote sensing, statistical image processing, ma-
2019].
chine learning, and deep learning.
[28] D. J. Lary, A. H. Alavi, A. H. Gandomi, and A. L. Walker, “Machine
learning in geosciences and remote sensing,” Geoscience Frontiers, vol.
7, 2016.
[29] S. Dev, B. Wen, Y. H. Lee, and S. Winkler, “Machine learning techniques
and applications for ground-based image analysis,” IEEE Geoscience
and Remote Sensing Magazine, Special Issue on Advances in Machine Yee Hui Lee (S'96−M'02−SM'11) received the
Learning for Remote Sensing and Geosciences, vol. 4, no. 2, pp. 79–93, B.Eng. (Hons.) and M.Eng. degrees from the School
June 2016. of Electrical and Electronics Engineering, Nanyang
[30] A. Ruiz and N. Villa, “Storms prediction: Logistic regression vs random Technological University, Singapore, in 1996 and
forest for unbalanced data,” Case Studies in Business, Industry and 1998, respectively, and the Ph.D. degree from the
Government Statistics, vol. 1, no. 2, pp. 91–101, 2007. University of York, York, U.K., in 2002. She is
[31] S. Manandhar, S. Dev, Y. H. Lee, Y. S. Meng, and S. Winkler, “A data- currently an Associate Professor with the School
driven approach to detecting precipitation from meteorological sensor of Electrical and Electronic Engineering, Nanyang
data,” in Proc. International Geoscience and Remote Sensing Symposium Technological University, where she has been a
(IGARSS), 2018. Faculty Member since 2002. Her research interests
[32] V. Vonikakis, Y. Yazici, V. D. Nguyen, and S. Winkler, “Group happiness include channel characterization, rain propagation,
assessment using geometric features and dataset balancing,” in Proc. antenna design, electromagnetic bandgap structures, and evolutionary tech-
18th ACM International Conference on Multimodal Interaction (ICMI), niques.
Emotion Recognition in the Wild Challenge, Tokyo, Japan, Nov 2016.
[33] M. M. Rahman and D. N. Davis, “Cluster based under-sampling
for unbalanced cardiovascular data,” in Proc. World Congress on
Engineering, 2013.
[34] National Environment Agency, “Annual weather review,” https://www.
Yu Song Meng (S'09−M'11) received the B.Eng.
nea.gov.sg/corporate-functions/resources/publications/annual-reports,
(Hons.) and Ph.D. degrees in electrical and elec-
[Last accessed: 26-June-2019].
tronic engineering from Nanyang Technological
[35] S. Manandhar, Y. H. Lee, Y. S. Meng, F. Yuan, and J. T. Ong, “GPS
University, Singapore, in 2005 and 2010 respec-
derived PWV for rainfall nowcasting in tropical region,” IEEE Trans.
tively.
Geosci. Remote Sens., vol. 56, no. 8, pp. 4835–4844, Aug 2018.
He was a Research Engineer with the School
[36] S. Manandhar, S. Dev, Y. H. Lee, S. Winkler, and Y. S. Meng,
of Electrical and Electronic Engineering, Nanyang
“Systematic study of weather variables for rainfall detection,” in Proc.
Technological University, from 2008 to 2009. He
International Geoscience and Remote Sensing Symposium (IGARSS),
joined the Institute for Infocomm Research, Agency
2018.
for Science, Technology and Research (A*STAR),
[37] W. P. Elliott and J. K. Angell, “Variations of cloudiness, precipitable
Singapore, in 2009 as a Research Fellow and then
water, and relative humidity over the United States 1973-1993,” Geophy.
a Scientist I. In 2011, he was transferred to the National Metrology Centre,
Res. Letters, vol. 24, no. 1, pp. 41–44, Jan. 1997.
A*STAR, where he is currently appointed as a Senior Scientist I. From 2012
[38] S. Dev, S. Manandhar, Y. H. Lee, and S. Winkler, “Study of clear sky
to 2014, he was part-timely seconded to Psiber Data Pte. Ltd., Singapore,
models for Singapore,” in Proc. PIERS, 2017.
where he was involved in metrological development and assurance of a
[39] S. G. Jin, O. F. Luo, and S. Gleason, “Characterization of diurnal cycles
handheld cable analyser, under a national Technology for Enterprise Capability
in ZTD from a decade of global GPS observations,” J. Geod., vol. 83,
Upgrading (T-Up) scheme of Singapore. Concurrently, he also serves as
no. 6, pp. 537–545, June 2009, doi: 0.1007/s00190-008-0264-3.
a Technical Assessor for the Singapore Accreditation Council-Singapore
[40] J. X. Yeo, Y. H. Lee, and J. T. Ong, “Performance of site diversity
Laboratory Accreditation Scheme (SAC-SINGLAS) in the field of RF and
investigated through radar derived results,” IEEE Trans. Antennas Prop.,
microwave metrology. His current research interests include electromagnetic
vol. 59, no. 10, pp. 3890–3898, 2011.
metrology, electromagnetic measurements and standards, and electromagnetic-
[41] Q. Zhao, Y. Yao, W. Yao, and Z. Li, “Real-time precise point positioning-
wave propagations.
based zenith tropospheric delay for precipitation forecasting,” Sci. Rep.,
Dr. Meng is a member of the IEEE Microwave Theory and Techniques
vol. 8, no. 7939, 2018, doi:10.1038/s41598-018-26299-3.
Society. He is a recipient of the Asia Pacific Metrology Programme (APMP)
Iizuka Young Metrologist Award in 2017 and the national T-Up Excellence
Award in 2015.10
Stefan Winkler (FS'18–SMS'14) is Deputy Di-
rector at AI Singapore and Associate Professor
(Practice) at the National University of Singapore.
Prior to that, he was Distinguished Scientist and
Director of the Video & Analytics Program at
the University of Illinois’ Advanced Digital Sci-
ences Center (ADSC) in Singapore. He also co-
founded two start-ups (Opsis and Genista) and
worked for a Silicon Valley company (Symmetri-
com).
Dr. Winkler has a Ph.D. degree from the Ecole
Polytechnique Fédérale de Lausanne (EPFL), Switzerland, and a Dipl.-Ing.
(M.Eng./B.Eng.) degree from the University of Technology Vienna, Austria.
He is an IEEE Fellow and has published over 130 papers. His research inter-
ests include video processing, computer vision, machine learning, perception,
and human-computer interaction.You can also read


