18 Month Outlook - An Assessment of the Reliability and Operability of the Ontario Electricity System
←
→
Page content transcription
If your browser does not render page correctly, please read the page content below
18 Month Outlook
An Assessment of the Reliability and Operability
of the Ontario Electricity System

FROM APRIL 2015 TO SEPTEMBER 2016
18-Month Outlook Update

Executive Summary
With adequate supply and reliable transmission service forecasted, the outlook for the
reliability of Ontario’s electricity system remains positive for the coming summer and
throughout the next 18 months.
The supply situation in the spring of 2015 has improved since the last forecast as several major
nuclear outages have been rescheduled. During normal weather conditions, reserve
requirements are expected to be met for summer 2015.
The Green Electron gas plant is currently under construction and is expected to come into
service in Q3 of 2015, bringing in close to 300 megawatts (MW) of power to Ontario.
Additionally, about 2,000 MW of new supply – mostly wind and some large solar projects – will
be incorporated into the province’s existing generation fleet, for a total of 2,300 MW of new
supply over the Outlook period. By the end of the period, the amount of solar generation
connected to the transmission grid is expected to grow to 280 MW, complementing the
approximately 1,900 MW of embedded solar facilities located within distribution networks. The
first storage project of the 34 MW procured last year is expected to come into service before the
end of this outlook period.
In addition, a Thunder Bay unit (153 MW) returned to service using advanced biomass fuel and
will contribute to the supply in northern Ontario.
Ontario was winter peaking in 2014 for the first time in 10 years due to milder summer
weather. With more typical weather, Ontario should be summer peaking in 2015. Embedded
solar generation will continue to reduce demand on the transmission system, in particular
during summer peaks. For 2015, both the winter and summer peaks will be subject to lower
demands due to the Industrial Conservation Initiative (ICI).
There are a number of changes occurring to demand measures over the 18-Month Outlook
period. In the spring of 2015, through an RFP process, the IESO will be procuring up to 100 MW
of load-following and unit commitment capability from demand-side resources. These pilot
projects will help identify opportunities to enhance participation of demand response (DR) in
meeting our existing system needs and how to better integrate these resources into the
electricity market. A DR auction is currently being developed by the IESO to augment the
existing DR capacity and to replace the expiring DR2 and DR3 contracts with a cost-competitive
mechanism.
The following table summarizes the forecasted seasonal peak demands over the next 18 months.

March 23, 2015                               Public                                 Page ii
18-Month Outlook Update

With the addition of significant wind supplies, conditions for surplus baseload generation
(SBG) will continue over the outlook period, potentially resulting in nuclear manoeuvring and
wind dispatch in real time.

Conclusions & Observations
The following conclusions and observations are based on the results of this assessment.
Demand Forecast
•   Ontario’s grid supplied peak demand is expected to decline throughout the period of this
    Outlook. Growth in embedded solar and wind generation capacity and on-going
    conservation initiatives reduce the need for energy from the bulk power system, while also
    putting downward pressure on peak electricity demands. Conservation, time-of-use rates
    and the ICI will also put downward pressure on peak demands, and in particular summer
    peaks. Grid supplied energy demand is expected to remain relatively flat over the forecast
    horizon as Ontario’s economy expands, whereas the ICI and time of use rates put
    downward pressure on peaks.
Resource Adequacy
•   Under the planned scenario, reserve requirements are expected to be met for the entire
    duration of this Outlook during normal weather, except two weeks during summer of 2016.
    The planning reserve is below the requirement for eleven weeks under the extreme weather
    scenario. These shortfalls are largely due to the planned generator outages in summer-fall
    2015 and summer 2016.
•   For the firm scenario, reserve is below requirements for three weeks during the Outlook
    period under normal weather conditions, in summer of 2016. Under extreme weather
    condition, the reserve is below the requirement for fourteen weeks. The firm scenario
    excludes any new generating facilities which haven’t reached commercial operation. As a
    result, the shortfall is more pronounced in the firm scenario than in the planned scenario.
•   About 2,300 MW of grid-connected generation is expected to be added throughout this
    Outlook period, which includes 1,700 MW of wind, 10 MW of hydroelectric, 300 MW of gas,
    240 MW of solar and 40 MW of biofuel resources.
Transmission Adequacy
Ontario’s transmission system is expected to be able to reliably supply the demand while
experiencing normal contingencies defined by planning documents under both normal and
extreme weather conditions forecast for this Outlook period.
•   Several local area supply improvement projects are underway and will be placed in service
    during the timeframe of this Outlook. These projects, shown in Appendix B, will help
    relieve loadings of existing transmission stations and provide additional supply capacity for
    future load growth. The IESO, Ontario’s transmitters and affected distributors are
    reviewing system needs and considering solutions in accordance with the Regional
    Planning Process established by the Ontario Energy Board (OEB). Plans are currently active
    in the GTA, Greater Ottawa, Southwest Ontario, Northwest Ontario, and Western Ontario
    regions.

March 23, 2015                               Public                                Page iii
18-Month Outlook Update
• High voltages in southern Ontario continue to occur, especially during periods of light load.
High voltages become more acute during these periods when shunt reactors are
unavailable. While the IESO and Hydro One are currently managing this situation with
day-to-day operating procedures, planning work for the installation of new voltage control
devices has been initiated.
• Hydro One has begun construction on the Guelph Area Transmission Refurbishment
project, with an expected completion date of Q2 2016. This project improves the
transmission capability into the Guelph area by reinforcing the supply into Guelph‐Cedar
Transformer Station (TS).
• In the Cambridge area, plans to incorporate a second 230/115 kV autotransformer at Preston
TS and associated switching and reactive facilities are being reviewed. Hydro One and the
IESO are exploring options that will help meet the IESO’s load restoration criteria following
a contingency on the main supply line. Studies will continue to assess the need for
additional measures to address longer term needs in the area.
• The upgrading of the 115 kV breakers at Leaside TS and Manby TS was completed in Q4
2014. Some bus and insulator replacement work at Manby TS is scheduled for completion
by Q2 2016. These new breakers facilities together with the Hearn SS rebuild completed in
Dec 2013 has increased the short-circuit withstand capability of the Toronto 115 kV system
and will allow new generation to be connected in the Manby and Leaside sectors.
• A new station, Copeland TS, is planned to be in service in downtown Toronto in Q1 2016.
The new station will facilitate the refurbishment of the facilities at John TS, while also
enhancing the load security in the downtown core.
• Work has started on the construction of Clarington TS and is scheduled to be complete by
the fall-2017. This facility will provide additional 500/230 kV transformation capacity to
maintain supply reliability following the shut-down of Pickering GS. The 230 kV switching
facilities at Clarington TS will also improve reliability to the loads in the Pickering, Ajax,
Whitby, Oshawa and Clarington areas.
Operability
• Conditions for SBG will continue over the Outlook period. However, it is expected that SBG
will be managed effectively via normal market mechanisms including inter-tie scheduling,
nuclear maneuvering or shutdown and the dispatch of grid-connected renewable resources.
March 23, 2015 Public Page iv18-Month Outlook Update Caution and Disclaimer The contents of these materials are for discussion and information purposes and are provided “as is” without representation or warranty of any kind, including without limitation, accuracy, completeness or fitness for any particular purpose. The Independent Electricity System Operator (IESO) assumes no responsibility to you or any third party for the consequences of any errors or omissions. The IESO may revise these materials at any time in its sole discretion without notice to you. Although every effort will be made by the IESO to update these materials to incorporate any such revisions it is up to you to ensure you are using the most recent version. March 23, 2015 Public Page v
18-Month Outlook Update
Table of Contents
Executive Summary ......................................................................................... ii
Conclusions & Observations ............................................................................ iii
Table of Contents ............................................................................................ vi
List of Tables .................................................................................................. vii
List of Figures ................................................................................................ vii
1 Introduction .......................................................................................... 1
2 Updates to This Outlook ........................................................................ 2
2.1 Updates to Demand Forecast .......................................................................................2
2.2 Updates to Resources..................................................................................................2
2.3 Updates to Transmission Outlook .................................................................................2
2.4 Updates to Operability Outlook ....................................................................................2
3 Demand Forecast ................................................................................... 3
3.1 Actual Weather and Demand .......................................................................................5
3.2 Forecast Drivers ..........................................................................................................7
3.3 Demand Response, Conservation and Embedded Generation .........................................7
4 Resource Adequacy Assessment ............................................................ 9
4.1 Assessments Assumptions ...........................................................................................9
4.2 Capacity Adequacy Assessment.................................................................................. 12
4.3 Energy Adequacy Assessment .................................................................................... 15
5 Transmission Reliability Assessment ................................................... 19
5.1 Transmission Outages ............................................................................................... 19
5.2 Transmission System Adequacy ................................................................................. 19
6 Operability Assessment ....................................................................... 23
6.1 Operation during Nuclear Outages ............................................................................. 23
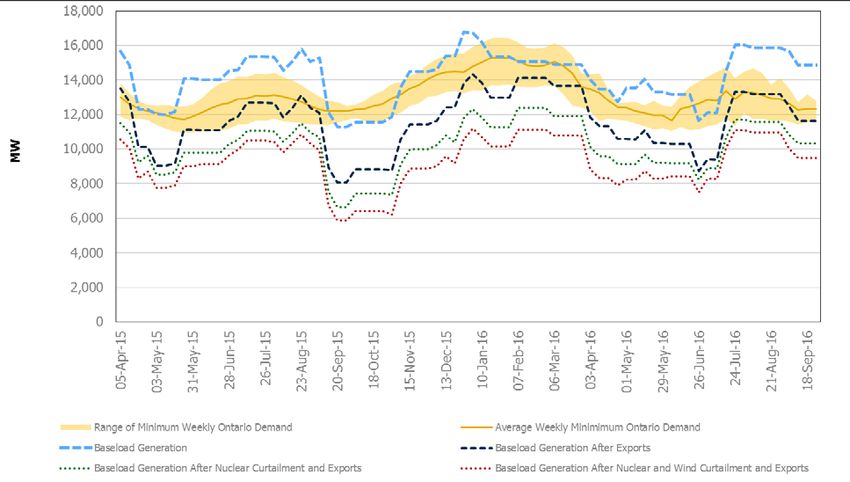
6.2 Surplus Baseload Generation (SBG) Forecast .............................................................. 23
6.3 Gas-Electric Interdependency .................................................................................... 24
March 23, 2015 Public Page vi18-Month Outlook Update List of Tables Table 3.1: Forecast Summary ..............................................................................................................4 Table 3.2: Weekly Energy and Peak Demand Forecast ..........................................................................5 Table 4.1: Existing Generation Capacity as of February 13, 2015 ...........................................................9 Table 4.2: Committed and Contracted Generation Resources ............................................................... 10 Table 4.3: Summary of Scenario Assumptions for Resources ............................................................... 11 Table 4.4: Monthly Historical Hydroelectric Median Values ................................................................... 11 Table 4.5: Monthly Wind Capacity Contribution Values ........................................................................ 12 Table 4.6: Monthly Solar Capacity Contribution Values ........................................................................ 12 Table 4.7: Summary of Available Resources ........................................................................................ 14 Table 4.8: Planned Scenario - Normal Weather: Summary of Zonal Energy ........................................... 16 Table 4.9: Planned Scenario - Normal Weather: Ontario Energy Production by Fuel Type ...................... 18 Table 6.1: Monthly Off-Peak Wind Capacity Contribution Values........................................................... 24 List of Figures Figure 4.1: Reserve Above Requirement: Firm Scenario with Normal vs. Extreme Weather ................... 13 Figure 4.2: Reserve Above Requirement: Planned Scenario with Normal vs. Extreme Weather .............. 13 Figure 4.3: Reserve Above Requirement: Planned Scenario with Present Outlook vs. Previous Outlook .. 14 Figure 4.4: Production by Fuel Type – Apr. 1 to Dec. 31, 2015 (%).................................................... 17 Figure 4.5: Production by Fuel Type – Jan. 1 to Sep. 30, 2016 (%) .................................................... 17 Figure 6.1: Minimum Ontario Demand and Baseload Generation .......................................................... 23 March 23, 2015 Public Page vii
18-Month Outlook Update

1 Introduction
This Outlook covers the 18-month period from April 2015 to September 2016 and supersedes
the last Outlook released on November 27, 2014.
The purpose of the 18-Month Outlook is:
    •   To advise market participants of the resource and transmission reliability of the Ontario
        electricity system;
    •   To assess potentially adverse conditions that might be avoided through adjustment or
        coordination of maintenance plans for generation and transmission equipment; and
    •   To report on initiatives being put in place to improve reliability within the 18-month
        timeframe of this Outlook.
The contents of this Outlook focus on the assessment of resource and transmission adequacy.
Additional supporting documents are located on the IESO website at
http://www.ieso.ca/Pages/Participate/Reliability-Requirements/Forecasts-&-18-Month-
Outlooks.aspx
This Outlook presents an assessment of resource and transmission adequacy based on the
stated assumptions, using the described methodology. Readers may envision other possible
scenarios, recognizing the uncertainties associated with various input assumptions, and are
encouraged to use their own judgment in considering possible future scenarios.
Security and Adequacy Assessments are published on the IESO website on a weekly and daily
basis, and progressively supersede information presented in this report.
Readers are invited to provide comments on this Outlook report or to give suggestions as to the
content of future reports. To do so, please contact us at:
    •   Toll Free: 1-888-448-7777
    •   Tel: 905-403-6900
    •   Fax: 905-403-6921
    •   E-mail: customer.relations@ieso.ca.

                                          - End of Section -

March 23, 2015                                Public                                 Page 1
18-Month Outlook Update
2 Updates to This Outlook
2.1 Updates to Demand Forecast
The demand forecast is based on actual demand, weather and economic data through to the end
of December 2014. The demand forecast has been updated to reflect the most recent economic
projections. Actual weather and demand data for January and February 2015 has been included
in the tables.
2.2 Updates to Resources
The 18-month assessment uses planned generator outages submitted by market participants to
the IESO’s Integrated Outage Management System (IOMS) as of February 13, 2015. In addition,
updates to available resources include the expected forced outage rates, seasonal generation
derates and variable resource contribution as determined by market participants or calculated
by the IESO based on actual experience.
The following generators completed the market registration process since the release of the last
Outlook:
• Liskeard Solar 1, 3 and 4 – 30 MW
• Three new hydraulic units at Smoky Falls – 264 MW
• Bluewater Wind Energy Centre – 60 MW
• Silvercreek Solar Park – 10 MW
• Third hydraulic unit at Kipling Generating Station (GS) – 79 MW
• Thunder Bay unit converted to burn biomass – 153 MW
2.3 Updates to Transmission Outlook
The list of transmission projects, planned transmission outages and actual experience with
forced transmission outages have been updated from the previous 18-Month Outlook. For this
Outlook, transmission outage plans submitted to the IOMS as of January 20, 2015 were used.
2.4 Updates to Operability Outlook
The Outlook for surplus baseload generation (SBG) conditions over the next 18 months uses the
updated planned generator outages. The generator outage plans are submitted by market
participants to the IESO’s IOMS. This Outlook is based on submitted generation outage plans
as of February 13, 2015.
- End of Section -
March 23, 2015 Public Page 218-Month Outlook Update 3 Demand Forecast The IESO is responsible for forecasting electricity demand on the IESO-controlled grid. This demand forecast covers the period April 2015 to September 2016 and supersedes the previous forecast released in November 2014. Tables of supporting information are contained in the 2015 Q1 Outlook Tables spreadsheet. Electricity demand is shaped by a several factors which have differing impacts. These factors can be grouped into those that increase demand (population growth and economic expansion), those that reduce demand (conservation and embedded generation) and those that shift demand (time of use rates and the Industrial Conservation Initiative [ICI]). How each of these factors impacts electricity consumption varies by season and time of day. Grid-supplied energy demand is forecasted to remain virtually flat over the forecast horizon. Growth in 2015 is projected to be small (0.1%) and much of the growth in 2016 (0.5%) will be due to the additional “leap year” day. Economic expansion and population growth will offset much of the reductions stemming from increased embedded generation and conservation savings over the forecast horizon. Peak demands are subject to the same forces as energy demand, though the impacts vary. This is true not only when comparing energy versus peak demand, but also in comparing the summer and winter peak. Summer peaks are significantly impacted by the growth in embedded generation capacity and pricing impacts (ICI and time-of-use rates). The majority of embedded generation is provided from solar powered facilities that have high output levels during the summer peak period and no output during the winter peak periods. Over the shoulder periods the timing of the peak hour and sunset are moving so the impact of embedded solar will vary. The ICI will have interesting impacts on winter and summer peaks in 2015 due to the fact that the program does not run on a calendar year but from May to April. The ICI impacts for May 2014 to April 2015 will have generally materialized in January 2015 as the summer of 2014 was so mild. With the return of more typical weather the ICI impacts for May 2015 to April 2016 will most likely be observed in the summer of 2015. As a result, both the winter and summer peaks of 2015 will be subject to ICI reductions. Minimum demand levels are similarly impacted by these same forces – primarily economic activity and embedded generation. The recession had led to lower levels of industrial activity, particularly overnight and on weekends due to reductions in the number of shifts. Although most embedded generation is solar, embedded wind generation contributes to lower minimums by supplanting grid-supplied electricity. However, offsetting some of this downward pressure on minimums there is a significant price incentive to shift load to overnight hours. Over the forecast, a relatively small increase in embedded wind generation and modest economic growth and load shifting will lead to a small increase in minimum demand levels over the forecast. The following tables show the seasonal peaks and annual energy demand over the forecast horizon of the Outlook. March 23, 2015 Public Page 3
18-Month Outlook Update

Table 3.1: Forecast Summary

           Season             Normal Weather Peak (MW)      Extreme Weather Peak (MW)

       Summer 2015                      22,991                       24,814
       Winter 2015-16                   22,237                       23,029
       Summer 2016                      22,966                       24,541

            Year              Normal Weather Energy (TWh)       % Growth in Energy

         2006 Energy                     152.3                        -1.9%
         2007 Energy                     151.6                        -0.5%
         2008 Energy                     148.9                        -1.8%
         2009 Energy                     140.4                        -5.7%
         2010 Energy                     142.1                        1.2%
         2011 Energy                     141.2                        -0.6%
         2012 Energy                     141.3                        0.1%
         2013 Energy                     140.5                        -0.6%
         2014 Energy                     139.3                        -0.8%
    2015 Energy (Forecast)               139.4                        0.1%
    2016 Energy (Forecast)               140.1                        0.5%

March 23, 2015                               Public                                  Page 4
18-Month Outlook Update
Table 3.2: Weekly Energy and Peak Demand Forecast
Load Normal Load Normal
Week Normal Extreme Forecast Energy Week Normal Extreme Forecast Energy
Ending Peak (MW) Peak (MW) Uncertainty Demand Ending Peak (MW) Peak (MW) Uncertainty Demand
(MW) (GWh) (MW) (GWh)
05-Apr-15 18,121 18,791 567 2,525 03-Jan-16 20,654 21,603 528 2,780
12-Apr-15 17,449 18,447 471 2,489 10-Jan-16 22,237 23,029 570 2,991
19-Apr-15 16,800 17,280 496 2,442 17-Jan-16 21,504 22,184 547 2,938
26-Apr-15 16,581 16,950 531 2,419 24-Jan-16 21,661 22,220 483 2,941
03-May-15 17,445 19,803 721 2,412 31-Jan-16 21,669 22,233 404 2,976
10-May-15 17,600 20,164 849 2,400 07-Feb-16 20,919 21,883 734 2,931
17-May-15 18,539 21,730 845 2,431 14-Feb-16 20,313 21,712 635 2,848
24-May-15 18,884 21,825 1,175 2,387 21-Feb-16 20,047 21,644 581 2,809
31-May-15 19,370 21,515 1,330 2,435 28-Feb-16 20,696 21,704 501 2,890
07-Jun-15 19,664 23,132 1,292 2,596 06-Mar-16 19,850 20,656 531 2,813
14-Jun-15 20,832 23,545 1,055 2,630 13-Mar-16 19,432 20,430 649 2,749
21-Jun-15 21,603 23,997 835 2,671 20-Mar-16 18,250 19,057 611 2,624
28-Jun-15 22,318 23,981 754 2,742 27-Mar-16 18,331 19,542 569 2,583
05-Jul-15 22,506 23,971 1,016 2,708 03-Apr-16 18,432 18,987 567 2,579
12-Jul-15 22,991 24,814 814 2,786 10-Apr-16 17,502 18,500 471 2,515
19-Jul-15 22,882 23,979 838 2,689 17-Apr-16 16,846 17,325 496 2,455
26-Jul-15 22,396 24,392 1,035 2,798 24-Apr-16 16,616 16,986 531 2,431
02-Aug-15 22,233 24,409 841 2,789 01-May-16 17,481 19,840 721 2,431
09-Aug-15 21,573 24,596 958 2,749 08-May-16 17,650 20,214 849 2,415
16-Aug-15 21,529 24,113 985 2,735 15-May-16 18,580 21,771 845 2,446
23-Aug-15 21,517 23,775 1,362 2,754 22-May-16 18,916 21,855 1,175 2,455
30-Aug-15 20,367 22,982 1,413 2,632 29-May-16 19,395 21,540 1,330 2,393
06-Sep-15 18,568 22,082 1,370 2,519 05-Jun-16 19,659 23,127 1,292 2,584
13-Sep-15 18,313 20,813 680 2,472 12-Jun-16 20,833 23,545 1,055 2,640
20-Sep-15 18,058 20,181 781 2,496 19-Jun-16 21,592 23,987 835 2,678
27-Sep-15 17,184 18,427 420 2,444 26-Jun-16 22,293 23,955 754 2,749
04-Oct-15 17,301 17,668 554 2,475 03-Jul-16 22,494 24,144 1,016 2,737
11-Oct-15 17,298 17,724 786 2,499 10-Jul-16 22,966 24,811 814 2,791
18-Oct-15 17,810 18,217 507 2,460 17-Jul-16 22,848 23,946 838 2,692
25-Oct-15 17,803 18,342 392 2,543 24-Jul-16 22,387 24,383 1,035 2,805
01-Nov-15 18,283 18,731 318 2,580 31-Jul-16 22,176 24,352 841 2,786
08-Nov-15 19,060 19,453 416 2,661 07-Aug-16 21,518 24,541 958 2,753
15-Nov-15 19,367 20,128 601 2,683 14-Aug-16 21,507 24,090 985 2,742
22-Nov-15 19,849 20,685 342 2,765 21-Aug-16 21,508 23,766 1,362 2,761
29-Nov-15 20,304 21,343 607 2,807 28-Aug-16 20,337 22,965 1,413 2,638
06-Dec-15 20,691 21,813 409 2,854 04-Sep-16 18,847 22,367 1,370 2,534
13-Dec-15 20,977 21,900 555 2,893 11-Sep-16 18,278 20,778 680 2,477
20-Dec-15 20,665 21,754 690 2,877 18-Sep-16 18,037 20,158 781 2,502
27-Dec-15 20,361 22,122 362 2,838 25-Sep-16 17,191 18,434 420 2,453
3.1 Actual Weather and Demand
Since the last forecast the actual demand and weather data for November, December, and
January have been recorded.
November
• November’s temperature was colder than normal ranking it in the top ten of the past 30
Novembers. As a result, Ontario’s energy demand for the month was 11.5 TWh (11.3 TWh
weather corrected). The actuals and weather corrected values were the lowest since 1997.
• The November peak occurred on the ninth coldest day of the month as the cold weather
generally landed on the weekends. Despite this the peak was 20,102 MW (21,298 MW
March 23, 2015 Public Page 518-Month Outlook Update
weather corrected as the peak didn’t occur on the coldest day). These peaks are consistent
with the levels seen since the recession.
• Wholesale customers’ consumption for the month decreased by 1.6% compared to the
previous November.
December
• December was milder than normal. Monthly energy demand was 12.2 TWh and bumped
up to 12.4 TWh after correcting for weather. Both values are low by historical standards for
December.
• The peak occurred on December 2, which was the third coldest day of the month but was
preceded by and followed by rather mild days. Therefore, the peak was a rather modest
20,938 MW (21,322 MW weather corrected). This was lower than last December but an
increase over 2012. There was a “cold snap” later in the month but it occurred over the
holiday period and therefore did not generate high peak demands.
• Wholesale customers’ capped off a negative quarter with consumption dropping by 1.4%
compared to December 2013.
January
• The weather for January was colder than normal. Energy demand for the month was
13.1 TWh (12.8 TWh weather corrected) which is low by historical standards. The actual
was the second lowest and the weather corrected the lowest January since market opening.
• Whereas the month was colder than normal, the peak temperature was just slightly colder
than normal. The peak demand for the month was on the coldest day and was 21,814 MW
(21,531 MW weather corrected). These are quite low by historical standards for January, but
this year was different as the ICI significantly reduced the January peak. This was the first
time that the ICI was “in play” during the winter.
• Wholesale customers’ consumption continued the weakness of the last quarter of 2014 into
2015. Year over year consumption fell by 3.2%.
February
• The weather for February was significantly colder than normal. Energy demand for the
month was 12.3 TWh, the highest February since 2008. However, the weather corrected
value was a much more modest 11.5 TWh, which is consistent with the relatively flat levels
of demand since the recession.
• The peak for the month was 21,494 MW, which was lower than last year’s February peak.
However, this year’s peak was significantly impacted by the ICI. The weather corrected
value of 20,132 MW was low by historical standards, but that was partially due to the ICI
impacts. The peak occurred on February 19th,which was the second coldest day of the
month and during a course of a “cold snap”.
• Wholesale customers’ consumption continued to decline, falling 4.7% compared to the
previous February. That marked five consecutive months of contraction.
March 23, 2015 Public Page 618-Month Outlook Update
Overall, energy demand for the four months from November to February was down 2.1%
compared with the same four months one year prior. After adjusting for the milder weather,
demand for the four months showed much larger decline of 2.7%.
For the four months, wholesale customers’ consumption posted a 2.7% decrease over the same
months a year prior with Pulp & Paper, Iron & Steel and Petroleum Products accounting for
most of the reductions.
The 2015 Q1 Outlook Tables spreadsheet contains several tables with historical data. They are:
• Table 3.3.1 Weekly Weather and Demand History Since Market Opening
• Table 3.3.2 Monthly Weather and Demand History Since Market Opening
• Table 3.3.3 Monthly Demand Data by Market Participant Role.
3.2 Forecast Drivers
Economic Outlook
The wild volatility in global markets over the past few months should eventually bode well for
Ontario’s economy. Lower energy prices and a lower dollar should benefit Ontario’s export
oriented industrial sectors. Once markets stabilize, Ontario should show stronger growth than
in recent years. Look for activity to pick up in the latter half of 2015. Despite a strong period of
growth in 2014, the industrial sector ended the year on a weaker note. As energy prices and the
dollar stabilize Ontario should be able to capitalize on stronger U.S. growth.
Wholesale customers’ electricity consumption had shown consistent growth since August 2013
before tailing off in the final quarter of 2014. As mentioned above, the level of activity should
pick up for this sector throughout 2015.
• Ontario’s economy should see improved growth in 2014 and 2015. Table 3.3.4 of the
2015 Q1 Outlook Tables presents the economic assumptions for the demand forecast.
Weather Scenarios
The IESO uses weather scenarios to produce demand forecasts. These scenarios include normal
and extreme weather, along with a measure of uncertainty in demand due to weather volatility.
This measure is called Load Forecast Uncertainty.
• Table 3.3.5 of the 2015 Q1 Outlook Tables presents the weekly weather data for the
forecast period.
3.3 Demand Response, Conservation and Embedded Generation
Demand response programs, conservation initiatives and embedded generation can all impact
demand over the forecast horizon. Demand response (DR) can be defined as the changing of
electricity consumption by end-use customers in response to market prices or market signals.
Ontario’s 2013 Long-Term Energy Plan assumes that DR will play a more significant role in the
future.
Using the definition above, DR is comprised of five programs: peaksaver®, dispatchable loads,
Demand Response 3 (DR3), time-of-use (TOU) tariffs and the Industrial Conservation Initiative
(ICI). However, for the purposes of the 18-Month Outlook, peaksaver®, dispatchable loads and
March 23, 2015 Public Page 718-Month Outlook Update
DR3 are treated differently than TOU or ICI. Demand Measures (DM), which include
peaksaver®, dispatchable loads and DR3, are treated as resources that can be dispatched in the
same way that generators are. TOU, ICI, conservation impacts and embedded generation
output are factored into the demand forecast as load modifiers.
3.3.1 Demand Measures
There are a number of changes occurring to demand measures over the 18-Month Outlook
period. Existing DR3 resources, which began the transition into IESO’s Capacity Based
Demand Response (CBDR) program in March 2015, are contracted for multi-year terms,
expiring at the latest, in 2018.
A DR Auction is currently being developed by the IESO to maintain the existing DR Capacity
and to replace the existing practice of multi-year contracting with a more cost-competitive
mechanism. The first DR Auction is expected to be held in December 2015 with a delivery date
of May 2016. Discussions with stakeholders about the development of the DR Auction are
underway; details can be found on the DR Auction Stakeholder Engagement page on the
IESO’s website.
The IESO is interested in learning about how DR can play an expanded role in meeting the
needs of Ontario’s electricity system. Specifically, the IESO seeks to evaluate the capabilities of
DR for both responding to five minute and hourly load changes in the real-time energy market
and committing to load curtailment day ahead or three hours ahead of real-time in return for
certain guarantees. To support this goal, the IESO will be procuring up to 100 MW of price-
responsive consumption capability from demand-side resources to participate in pilot projects.
These pilot projects will also help identify opportunities to enhance participation of DR in
meeting our existing system needs. The pilot will be launched via a competitive Request for
Proposal (RFP) in early 2015.
In terms of the demand forecast, the actual impacts of these programs are added back to the
demand and the forecast is based on demand prior to the impact of these programs. The total
demand measure capacity is discounted based on historical performance and contract data, to
reflect the reliably available resource capacity which is then included in the resource portfolio.
3.3.2 Load Modifiers
Conservation, TOU, ICI and embedded generation are accounted for in the demand forecast.
Conservation will continue to grow throughout the forecast period, and the demand forecast is
decremented for the impacts of conservation. The impact of TOU rates and ICI are factored into
the demand forecast as they have a downward impact on peak demands.
Embedded generation capacity will continue to grow over the forecast horizon. The forecast of
grid supplied electricity is directly impacted by the growth of distribution connected generation
as it supplants the need for bulk system power. The forecast accounts for the growth in
embedded generation production.
- End of Section -
March 23, 2015 Public Page 818-Month Outlook Update
4 Resource Adequacy Assessment
This section provides an assessment of the adequacy of resources to meet the forecast demand.
When reserves are below required levels, with potentially adverse effects on the reliability of
the grid, the IESO will reject outages based on their order of precedence. Conversely, an
opportunity exists for additional outages when reserves are above required levels.
The existing installed generation capacity is summarized in Table 4.1. This includes capacity
from new projects that have completed commissioning and the market entry process.
Table 4.1: Existing Generation Capacity as of February 13, 2015
Total Forecast Change in
Installed Capability at Number of Installed Change in
Fuel Type
Capacity Summer Stations Capacity Stations
(MW) Peak (MW) (MW)
Nuclear 12,947 11,484 5 0 0
Hydroelectric 8,462 5,684 71 343 0
Gas/Oil 9,920 8,707 29 0 0
Wind 2,543 346 21 60 1
Biofuel 455 292 8 153 1
Solar 40 11 2 40 2
Total 34,367 26,525 136 596 4
During this Outlook period, the IESO is moving forward with the second phase of its energy
storage procurement. Qualified applicants will be selected, and a draft RFP will be issued
shortly after. The IESO is seeking a broad range of technologies that can provide the best long-
term benefits.
The Phase II storage RFP for 16 MW will allow the IESO to build on its previous procurement
by expanding its storage portfolio and creating new learning opportunities. In 2014, the IESO
completed the Phase I RFP for 34 MW of its current storage procurement. The first of these will
come into service during this outlook period.
The IESO initially procured six megawatts of storage—a battery and flywheel to provide
regulation service—in 2012. These two projects are now operational.
4.1 Assessments Assumptions
4.1.1 Committed and Contracted Generation Resources
All generation projects that are scheduled to come into service, be upgraded, or be shut down
within the Outlook period are summarized in Table 4.2. This includes committed generation
projects in the IESO’s Connection Assessment and Approval process (CAA), those that are
under construction, as well as projects contracted by the IESO. Details regarding the IESO’s
CAA process and the status of these projects can be found on the IESO’s website at
http://www.ieso.ca/Pages/Participate/Connection-Assessments/default.aspx under Application
Status.
March 23, 2015 Public Page 918-Month Outlook Update
The effects of the seasonal exchange of electricity capacity between Ontario and Quebec as
agreed through the Memorandum of Understanding between HQ Energy Marketing Inc. and
the IESO and expected to start December 1, 2015 have not been taken into account in this
assessment.
The estimated effective date in Table 4.2 indicates the date on which additional capacity is
assumed to be available to meet Ontario demand or when existing capacity will be shut down.
This data is accurate as of February 13, 2015. For projects that are under contract, the estimated
effective date is based on the best information available to the IESO. If a project is delayed, the
estimated effective date will be the best estimate of the commercial operation date for the
project.
Table 4.2: Committed and Contracted Generation Resources
Estimated Capacity Considered
Project Name Also Known As Zone Fuel Type Effective Project Status Firm Planned
Date (MW) (MW)
Thunder Bay Condensing Turbine Project Northwest Biomass Commercial Operation 40 40
Adelaide Wind Energy Centre Southwest Wind Commercial Operation 60 60
Bornish Wind Energy Centre Southwest Wind Commercial Operation 74 74
Grand Renewable Energy Park Grand Wind Southwest Wind Commercial Operation 149 149
Northland Power Solar Abitibi Northeast Solar 2015-Q1 Construction 10
Northland Power Solar Empire Northeast Solar 2015-Q1 Construction 10
Northland Power Solar Long Lake Northeast Solar 2015-Q1 Construction 10
Northland Power Solar Martin's Meadows Northeast Solar 2015-Q1 Construction 10
Twin Falls Northeast Water 2015-Q1 Construction 5
Adelaide Wind Power Project Landon West Wind 2015-Q1 Commissioning 40
Goshen Wind Energy Centre Southwest Wind 2015-Q1 Commissioning 102
Dufferin Wind Farm Shannon Southwest Wind 2015-Q1 Commissioning 100
Jericho Wind Energy Centre Southwest Wind 2015-Q1 Commissioning 150
Goulais Wind Farm Northeast Wind 2015-Q2 Construction 25
Grand Renewable Energy Park Grand Solar Southwest Solar 2015-Q2 Commissioning 100
Bow Lake Phase 1 Northeast Wind 2015-Q2 Commissioning 20
K2 Wind Project Southwest Wind 2015-Q2 Construction 270
High Falls Hydropower Development Northwest Water 2015-Q2 Pre-NTP 5
Green Electron Power Project West Gas 2015-Q3 Construction 298
Leamington Pollution Control Plant West Oil 2015-Q3 Approvals & Permits 2
Cedar Point Wind Power Project Phase II Southwest Wind 2015-Q4 NTP 100
Kingston Solar Project East Solar 2015-Q4 NTP 100
Grand Valley Wind Farms (Phase 3) Southwest Wind 2015-Q1 NTP 40
Armow Wind Project Southwest Wind 2015-Q4 NTP 180
Grand Bend Wind Farm Southwest Wind 2015-Q4 NTP 100
Niagara Region Wind Farm Southwest Wind 2015-Q4 NTP 230
White Pines Wind Farm East Wind 2015-Q4 Pre-NTP 60
Total 322 2,289
Notes on Table 4.2:
1. The total may not add up due to rounding. Total does not include in-service facilities.
2. Project status provides an indication of the project progress. The milestones used are:
a. Connection Assessment - the project is undergoing an IESO system impact assessment.
b. Approvals & Permits - the proponent is acquiring major approvals and permits required
to start construction (e.g. environmental assessment, municipal approvals etc.).
c. Construction - the project is under construction.
d. Commissioning - the project is undergoing commissioning tests with the IESO.
e. Pre-NTP/NTP - Feed-in Tariff (FIT) projects are categorized as Notice to Proceed (NTP)
or pre-NTP. IESO issues NTP when the project proponent provides necessary approvals
and permits, finance plan, Domestic Content Plan and documentation on impact
assessment required by the Transmission System Code or the Distribution System Code.
f. Commercial Operation – the project has achieved commercial operation under the
contract criteria but has not met all the commissioning requirements of the IESO.
March 23, 2015 Public Page 1018-Month Outlook Update
4.1.2 Summary of Scenario Assumptions
In order to assess future resource adequacy, the IESO must make assumptions on the amount of
available resources. The Outlook considers two scenarios: a Firm Scenario and a Planned
Scenario as compared in Table 4.3.
Table 4.3: Summary of Scenario Assumptions for Resources
Planned Scenario Firm Scenario
Over the 18-Month Period
Total Existing Installed Resource
34,367
Capacity (MW)
Generators reached commercial
All Projects operation and generator shutdowns
New Generation and Capacity
and retirements
Changes (MW)
2,289 322
Both scenarios’ starting point is the existing installed resources shown in Table 4.1. The
Planned Scenario assumes that all resources scheduled to come into service are available over
the study period. The Firm Scenario only assumes resources that have reached commercial
operation. Also considered for both scenarios are generator-planned shutdowns or retirements
that have high certainty of occurring in the future. The Firm and Planned scenarios also differ
in their assumptions regarding the amount of demand measures. The Firm scenario considers
DR programs from existing participants only, while the Planned scenario considers DR
programs from future participants too. Both scenarios recognize that resources are not available
during times for which the generator has submitted planned outages.
The generation capability assumptions used in this Outlook are described in the following
paragraphs.
The hydroelectric capability for the duration of this Outlook is typically based on median
historical values (including energy and operating reserve) during weekday peak demand hours
from May 2002 to March 2014. Adjustments may be made periodically, when outage or water
conditions drive expectations of higher or lower output that varies from median values by more
than 500 MW. Table 4.4 shows the historical hydroelectric median values calculated with the
data from May 2002 to March 2014. These values are updated annually to coincide with the
release of summer 18-Month Outlook.
Table 4.4: Monthly Historical Hydroelectric Median Values
Month Jan Feb Mar Apr May Jun Jul Aug Sep Oct Nov Dec
Historical
Hydroelectric
6,059 6,025 5,876 5,812 5,841 5,716 5,684 5,414 5,018 5,401 5,730 6,131
Median Values
(MW)
• Thermal generators’ capacity and energy contributions, planned outages, expected forced
outage rates and seasonal deratings are based on market participant submissions or
calculated by the IESO based on actual experience.
March 23, 2015 Public Page 1118-Month Outlook Update
• Non-utility Generators (NUGs), whose contracts have expired but which continue to
operate and provide forecasts are included in both planned and firm scenarios. NUGs
whose contracts are expiring during the Outlook period are excluded from the Firm
scenario after their contract expiry date. These NUGs are included as part of the Planned
scenario if they have provided forecast data. Former NUGs that subsequently reach a
contract or register with the IESO as a dispatchable facility are added to both scenarios.
• For wind generation the monthly Wind Capacity Contribution (WCC) values are used at the
time of weekday peak, while annual energy contribution is assumed to be 29% of installed
wind capacity. Table 4.5 shows the monthly WCC values (with actual historic wind output
up to February 28, 2014). These values are updated annually to coincide with the release of
summer Outlook.
Table 4.5: Monthly Wind Capacity Contribution Values
Month Jan Feb Mar Apr May Jun Jul Aug Sep Oct Nov Dec
WCC (% of
Installed 33.1% 33.1% 26.2% 22.4% 23.4% 13.6% 13.6% 13.6% 16.7% 21.6% 28.6% 33.1%
Capacity)
• For solar generation, the monthly Solar Capacity Contribution (SCC) values are used at the
time of weekday peak. For annual solar energy contribution, 14% output of installed
capacity is assumed. The specifics on wind and solar values can be found in the
Methodology to Perform Long Term Assessments. Table 4.6 shows the monthly SCC
values. These values are updated annually to coincide with the release of summer Outlook.
Table 4.6: Monthly Solar Capacity Contribution Values
Month Jan Feb Mar Apr May Jun Jul Aug Sep Oct Nov Dec
SCC (% of
Installed 0.0% 0.0% 0.0% 1.0% 37.0% 27.0% 27.0% 27.0% 6.0% 1.0% 0.0% 0.0%
Capacity)
4.2 Capacity Adequacy Assessment
The capacity adequacy assessment accounts for zonal transmission constraints imposed by
planned transmission outages. The planned outages occurring during this Outlook period have
been assessed as of January 20, 2015.
4.2.1 Firm Scenario with Normal and Extreme Weather
The firm scenario incorporates generation capacity that reached commercial operation. This
will include the addition of roughly 280 MW of wind and 40 MW of biofuel capacity.
RAR levels, which represent the difference between Available Resources and Required
Resources, are shown in Figure 4.1. As can be seen, the reserve requirement under normal
weather conditions is being met throughout the Outlook period except for three weeks in
summer of 2016. During extreme weather conditions, the reserve is lower than the requirement
for a total of thirteen weeks during the summers of 2015 and 2016. This shortfall is largely
attributed to the planned generator outages scheduled during those weeks.
March 23, 2015 Public Page 1218-Month Outlook Update Figure 4.1: Reserve Above Requirement: Firm Scenario with Normal vs. Extreme Weather 4.2.2 Planned Scenario with Normal and Extreme Weather The planned scenario incorporates all existing capacity plus all capacity coming in service. Roughly 2,300 MW of generation capacity is expected to connect to Ontario’s grid over this Outlook period. Reserve Above Requirement levels, which represent the difference between Available Resources and Required Resources, are shown in Figure 4.2. As can be seen, the reserve requirement is being met throughout the Outlook period under normal weather conditions, except for two weeks during summer of 2016. The reserve is lower than the requirement for eleven weeks during the summer months of 2015 and summer of 2016 under extreme weather conditions. This shortfall is largely attributed to the planned outages scheduled for those weeks. Figure 4.2: Reserve Above Requirement: Planned Scenario with Normal vs. Extreme Weather 4.2.3 Comparison of Resource Scenarios Table 4.7 shows a snapshot of the forecast available resources, under the two scenarios, at the time of the summer and winter peak demands during the Outlook. March 23, 2015 Public Page 13
18-Month Outlook Update

Table 4.7: Summary of Available Resources
                                                  Summer Peak 2015        Winter Peak 2016      Summer Peak 2016
Notes                   Description                 Firm     Planned       Firm      Planned      Firm     Planned
                                                  Scenario   Scenario    Scenario    Scenario   Scenario   Scenario
     1            Installed Resources (MW)        34,689        35,547   34,689       36,656     34,689     36,656
     2       Total Reductions in Resources (MW)    7,171         7,852    5,805       6,856      10,623     11,766
     3            Demand Measures (MW)              511           591      483         563        511        591
     4            Available Resources (MW)        28,029        28,286   29,367       30,363     24,577     25,481

Notes on Table 4.7:
1.       Installed Resources: This is the total generation capacity assumed to be installed at the time of the
         summer and winter peaks.
2.       Total Reductions in Resources: Represent the sum of deratings, planned outages, limitations due to
         transmission constraints and allowance for capability levels below rated installed capacity.
3.       Demand Measures: The amount of demand expected to be reduced.
4.       Available Resources: Equals Installed Resources (line 1) minus Total Reductions in Resources (line 2)
         plus Demand Measures (line 3).

Comparison of the Current and Previous Weekly Adequacy Assessments for the
Planned Normal Weather Scenario
Figure 4.1 provides a comparison between the forecast RAR values in the present Outlook and
the forecast RAR values in the previous Outlook published on November 27, 2014. The
difference is mainly due to the changes to outages and changes in the demand forecast. The
most significant difference is for spring of 2015 which reflects there will no longer be
overlapping nuclear outages during that period.
Figure 4.3: Reserve Above Requirement: Planned Scenario with Present Outlook vs. Previous Outlook

Resource adequacy assumptions and risks are discussed in detail in the “Methodology to
Perform Long Term Assessments”.

March 23, 2015                                         Public                                      Page 14
18-Month Outlook Update 4.3 Energy Adequacy Assessment This section provides an assessment of energy adequacy, the purpose of which is to determine whether Ontario has sufficient supply to meet its forecast energy demands and to highlight any potential concerns associated with energy adequacy within the period covered under this 18- Month Outlook. 4.3.1 Summary of Energy Adequacy Assumptions In order to achieve results consistent with the capacity adequacy assessments, the energy adequacy assessment is performed using the same set of assumptions pertaining to resources expected to be available over the next 18 months. Refer to Table 4.1 for the summary of ‘Existing Generation Capacity and Table 4.2 for the list of ‘Committed and Contracted Generation Resources’ for this information. The monthly forecast of energy production capability, based on information provided by market participants, is included in the 2015 Q1 Outlook Tables Appendix A, Table A7. For the energy adequacy assessment, only the Planned Scenario as per Table 4.3 with normal weather demand is considered. In addition, in order to reasonably capture the variability and uncertainty associated with wind resources, multiple wind samples (hourly profiles) were considered in the energy adequacy assessment. Generator forced outages were modelled using a convergent Monte Carlo technique which pre-filters statistically unlikely outage patterns. The key assumptions specific to the Energy Adequacy Assessment (EAA) are described in the IESO document titled “Methodology to Perform Long Term Assessments”. 4.3.2 Results - Planned Scenario with Normal Weather Table 4.8 summarizes key energy statistics over the 18-Month period for the Planned Scenario with normal weather demand for Ontario as a whole, and provides a breakdown by each transmission zone. The results indicate that supply is expected to be adequate over the 18-month timeframe of this Outlook with the analysis showing no occurrences of unserved energy. March 23, 2015 Public Page 15
18-Month Outlook Update

Table 4.8: Planned Scenario - Normal Weather: Summary of Zonal Energy (*)

                                                                              Zonal Energy Available
                                                         Net Inter-
                                                                    Potential Demand on    Energy on
                 18 -Month Energy    18-Month Energy       Zonal
                                                                    Un-served Peak Day of Peak Day of
                      Demand            Production        Energy
   Zone                                                              Energy    18-Month    18‑Month
                                                         Transfer
                                                                                 Period      Period
                         Average              Average
                 TWh                 TWh                   TWh        GWh           GWh          GWh
                           MW                   MW
Ontario          207.3   15,733.0    207.3    15,733.0        0.0      0.0         455.2         581.6
Bruce              0.8       62.0     63.1     4,788.0       62.3      0.0           1.4         126.8
East              12.8      969.0     15.2     1,156.0        2.4      0.0          27.0          80.8
Essa              10.9      828.0      3.1       236.0       -7.8      0.0          23.5          15.5
Niagara            5.6      425.0     19.8     1,506.0       14.2      0.0          13.9          41.4
Northeast         15.9    1,208.0     13.5     1,022.0       -2.4      0.0          25.3          33.7
Northwest          6.0      454.0      6.7       509.0        0.7      0.0           9.9          13.5
Ottawa            13.4    1,014.0      0.7        53.0      -12.7      0.0          30.2           2.2
Southwest         43.1    3,271.0      4.8       363.0      -38.3      0.0          90.5          22.5
Toronto           79.0    5,999.0     70.3     5,332.0       -8.7      0.0         187.6         180.7
West              19.8    1,503.0     10.1       768.0       -9.7      0.0          45.9          64.5

(*) Values corrected on March 31, 2015.
Figure 4.4 and Figure 4.5 show the percentage production by fuel type for each calendar year of
the 18-Month period under conditions of zero net exports, while Table 4.9 summarizes these
simulated production results by fuel type, for each year.

March 23, 2015                                  Public                                     Page 16
18-Month Outlook Update
Figure 4.4: Production by Fuel Type – Apr. 1 to Dec. 31, 2015 (*)
4.1% 0.5%
8.6%
Nuclear
Hydro
24.6% Gas & Oil
62.2% Wind
Bio Fuel
Figure 4.5: Production by Fuel Type – Jan. 1 to Sep. 30, 2016 (*)
0.3%
5.4%
8.5%
Nuclear
Hydro
24.6% Gas & Oil
61.1% Wind
Bio Fuel
(*) Figures corrected on March 31, 2015 to reflect the values in Table 4.9.
March 23, 2015 Public Page 1718-Month Outlook Update
Table 4.9: Planned Scenario - Normal Weather: Ontario Energy Production by Fuel Type
2015 2016
Fuel Type Total
(Apr 1 – Dec 31) (Jan 1 – Sep 30)
(Grid Connected)
(GWh) (GWh) (GWh)
Nuclear 63,964 63,763 127,727
Hydro 25,276 25,725 51,002
Gas & Oil 8,851 8,914 17,765
Wind 4,211 5,596 9,807
Biofuel 511 280 792
Other (Solar & DR) 78 126 205
Total 102,892 104,405 207,297
4.3.3 Findings and Conclusions
The energy adequacy assessment results indicate that Ontario is expected to have sufficient
supply to meet its energy forecast during the 18-Month Outlook period for the Planned scenario
with normal weather demand. Additional sensitivity modelling runs were conducted to
analyze the energy adequacy picture under more onerous demand conditions to capture the
impact of load forecast uncertainty. Under these conditions Ontario is again expected to have
sufficient supply to meet the forecast demand over the 18-Month Outlook period without
reliance on imports or system operator control actions.
- End of Section -
March 23, 2015 Public Page 1818-Month Outlook Update 5 Transmission Reliability Assessment The IESO requires transmitters to provide information on the transmission projects that are planned for completion within the 18-month period. Construction of several transmission reinforcements is expected to be completed during this Outlook period. Major transmission and load supply projects planned to be in service are shown in Appendix B. Projects that are already in service or whose completion is planned beyond the period of this Outlook are not shown. The list includes only the transmission projects that represent major modifications or are considered to significantly improve system reliability. Minor transmission equipment replacements or refurbishments are not shown. Some area loads have experienced significant load growth to warrant additional investments in new load supply stations and reinforcements of local area transmission. Several local area supply improvement projects are underway and will be placed in service during the timeframe of this Outlook. These projects help relieve loadings on existing transmission infrastructure and provide additional supply capacity for future load growth. 5.1 Transmission Outages The IESO’s assessment of the transmission outage plans is shown in Appendix C, Tables C1 to C10. The methodology used to assess the transmission outage plans is described in the IESO document titled “Methodology to Perform Long Term Assessments”. This Outlook contains transmission outage plans submitted to the IESO as of January 14, 2015. 5.2 Transmission System Adequacy The IESO assesses transmission adequacy using the methodology on the basis of conformance to established criteria, planned system enhancements and known transmission outages. Zonal assessments are presented in the following sections. Overall, the Ontario transmission system is expected to supply the demand under the normal and extreme weather conditions forecast for the Outlook period. The existing transmission infrastructure in some areas in the province, as described below, have been identified as currently having or anticipated to have some limitations to supply the local needs. Hydro One and the IESO are considering long-term options to address these situations in accordance with local communities under the Regional Planning Process established by the Ontario Energy Board (OEB). Plans are currently active in the GTA, Greater Ottawa, Southwest Ontario, Northwest Ontario, and Western Ontario regions. 5.2.1 Toronto and Surrounding Area The load supply capability to the GTA is expected to be adequate to meet the forecast demand through to the end of this 18-month period. The upgrading of the 115 kV breakers at Leaside Transformer Station (TS) and Manby TS was completed in Q4 2014. The remaining work at Manby TS covering bus reinforcement and insulator replacement is scheduled for completion by Q2 2016. These upgrades will allow additional generation to be incorporated into the Toronto 115 kV system and the distribution level by increasing the short-circuit capability of the 115 kV system. March 23, 2015 Public Page 19
18-Month Outlook Update

The development of Clarington TS has started with a scheduled in-service date of fall 2017.
This will ensure that the additional 500 kV to 230 kV transformation capacity required to
maintain supply reliability, will be available before Pickering GS is shutdown. Without this
additional capacity there would have been an increased risk of overloading the existing auto-
transformers at Cherrywood TS.
The associated 230 kV switching facilities at Clarington TS will also improve the supply
reliability to the loads in the Pickering, Ajax, Whitby, Oshawa and Clarington areas by
providing a full, alternative source of supply to these loads.
In central Toronto, Copeland TS was originally expected to be in service in Q3 2015 but is now
scheduled to be in service in Q1 2016. The new station will allow some load to be transferred
from John TS. This will help meet the short and mid-term need for additional supply capacity
in the area and will also facilitate the refurbishment of the facilities at John TS.
High voltages in southern Ontario continue to present operational challenges during periods of
light load requiring the temporary removal from service of at least one of the 500 kV circuits
between Lennox TS and Bowmanville SS during those periods. The situation has become
especially acute during those periods when the shunt reactors at Lennox TS have been
unavailable due either to repair or maintenance activities. While the IESO and Hydro One are
currently managing this situation with day-to-day operating procedures, the situation is
expected to become more difficult once Pickering GS is shut down. Planning work for the
installation of new voltage control devices has been initiated.
In order to increase the load-meeting capability of the two 230 kV circuits between
Claireville TS and Minden TS and allow the proposed Vaughan TS No. 4 to be connected,
Hydro One is planning to install two 230 kV in-line breakers at Holland TS, together with a load
rejection scheme. These facilities are scheduled to be in service by early 2017. Until these
facilities become available, operational measures will be required to avoid possible overloading
of these circuits during peak load periods.
Transmission transfer capability in Toronto and surrounding area is expected to be sufficient for
the purpose of supplying load in this area with a margin to allow for planned outages.
5.2.2   Bruce and Southwest Zones
In the Guelph area, Hydro One has begun construction on the Guelph Area Transmission
Refurbishment project to improve the transmission capability into the Guelph area by
reinforcing the supply into Guelph‐Cedar TS, with an expected completion date in Q2 2016. As
part of this project, circuit switchers are to be installed at Guelph North Junction that will allow
the 230 kV system between Detweiler TS and Orangeville TS to be sectionalized. These devices
will reduce the restoration times for the loads in the Waterloo, Guelph and Fergus areas
following a supply interruption.
Plans for a second 230/115 kV autotransformer at Preston TS, together with the associated
switching and reactive facilities, are currently being revisited. Hydro One and the IESO are
exploring options that will not only improve the load restoration capability to those customers
in the Cambridge area affected by a major transmission outage, but also accommodate the

March 23, 2015                                 Public                                 Page 20
You can also read