Real Time Aircraft Atypical Approach Detection for Air Traffic Control
←
→
Page content transcription
If your browser does not render page correctly, please read the page content below
Preprints (www.preprints.org) | NOT PEER-REVIEWED | Posted: 12 March 2021

        Real Time Aircraft Atypical Approach Detection for
                       Air Traffic Control
                                 Gabriel Jarry∗ , Daniel Delahaye∗ , Stephane Puechmorel∗ , Eric Feron†
                              ∗ ENAC, Université de Toulouse, 7 Avenue Edouard Belin, 31400 Toulouse

                                  Email: {gabriel.jarry, daniel.delahaye, stephane.puechmorel}@enac.fr
                                        † King Abdullah University of Science and Technology,

                              Division of Electrical, Computer and Mathematical Science and Engineering,
                                             on leave from Georgia Institute of Technology,
                                                       Thuwal, 23955, Saudi Arabia
                                                      Email: eric.feron@kaust.edu.sa

           Abstract—In this paper, a complete tool for real-time detection        excursions. Undesirable events can lead to final events and
        of atypical energy behaviors of airplanes is presented. The               thus compromise safety or reduce aerodrome capacity. Their
        methodology extends in real time an existing offline process using        identification and detection is an important issue.
        Dubins trajectories as a predictor of the remaining distance to the
        runway threshold. Two major contributions are presented in this              Unstabilized approaches have been observed in several
        paper. First, a real-time measure of the aircraft energy behaviour        accidents, such as that of Air Nostrum flight 8313 on July 30,
        is defined, indicating whether the aircraft is in good condition          2011, where the aircraft suffered structural damage following
        to intercept the extended runway centreline from its current              a hard landing at Barcelona airport [7]. Peak descent rates in
        position. Secondly, a 2D trajectory suggestion is given, allowing         excess of 3000ft/min were recorded and the aircraft crossed the
        safe management of the approach path according to atypical
        criteria of historical data. Finally, this document proposes a            runway threshold at 315ft, where the nominal reference height
        comprehensive tool for air traffic controllers, which is a major          (RDH), i.e. the nominal height above the runway threshold, is
        step forward in understanding, becoming aware of and resolving            approximately 50ft. Another example is the July 6, 2014 crash
        critical situations that could lead to accidents.                         of Asiana Airline Flight 214 at San Francisco Airport, which
           Index Terms—Approach Path Management, Atypical Flight                  resulted in 3 fatalities and 185 injuries [8]. The plane was
        Event, Non-Compliant Approach, Real Time, Anomaly Detection,              recorded with a very low speed on final approach and finally
        Functional Principal Component Analysis, Unsupervised Learn-              stalled before crashing.
        ing, Dubins Path,
                                                                                     Various studies have been conducted to determine the pre-
                                                                                  cursors of the unstabilized approach. In particular, Jiao et
                               I. I NTRODUCTION
                                                                                  al. [9] have shown that speed is the main source of non-
        A. Operational Motivations                                                stabilization, followed by localizer and glide deviations.
           Approach and landing accidents (i.e. accidents that occur
        during the initial approach, intermediate approach and landing
        phases) account for 47 per cent of the total number of                    B. Previous Related Works
        accidents and 40 per cent of fatalities each year. In addition,              Particular atypical situations called "Glide Interception
        a large majority of accidents show significant differences                From Above" (GIFA) have been identified as undesirable.
        from nominal approaches such as atypical airspeed or atypical             These situations are critical because of the potential difficulties
        altitude [1]. In addition, airport Terminal Manoeuvring Areas             in managing aircraft energy and because aircraft are neither
        and Control Traffic Regions are characterised by a dense and              designed nor certified to intercept glide from above.
        highly complex air traffic flow. This complexity is likely to                To improve safety and reduce the number of GIFAs, an
        increase as IATA predicts that the number of air passengers               online detection tool has been implemented at Charles-De-
        worldwide will rise from around 4 billion today to 7,8 billion            Gaulle airport and used by the Air Traffic Controllers in real
        in 2036 [2]. Analyzing and gaining a better understanding of              time. It consists of four 3D volumes using the Area Proximity
        flight operational issues like atypical behaviors would benefit           Warning (APW) described in 1. The first three volumes are
        air traffic managers and flight operators.                                alert volumes, the ATCs warn pilots that they are too high on
           In order to meet the safety requirements of the International          the glide path. The last volume is a decision volume, where
        Civil Aviation Organization, the French Directorate of Civil              the ATC and pilots must decide whether to continue or abort
        Aviation launched a national safety programme in 2006, which              the approach. The results of the experiments are positive since
        is currently divided into three national safety programmes                today the GIFAs are detected and appropriate action is taken.
        published for the period 2009-2013: [3], 2013-2018: [4] and               About 5 flights out of the 700 per day trigger an alarm and in
        2018-2023: [5]. The risk portfolio [6] distinguishes between              about half of the cases, the GIFAs suggest a recovery slope as
        undesirable events such as unstabilized approaches, and ul-               recommended. Nevertheless, this tool focuses only on potential
        timate events such as control flights into terrain, or runway             energy.

                                                                              1
            © 2021 by the author(s). Distributed under a Creative Commons CC BY license.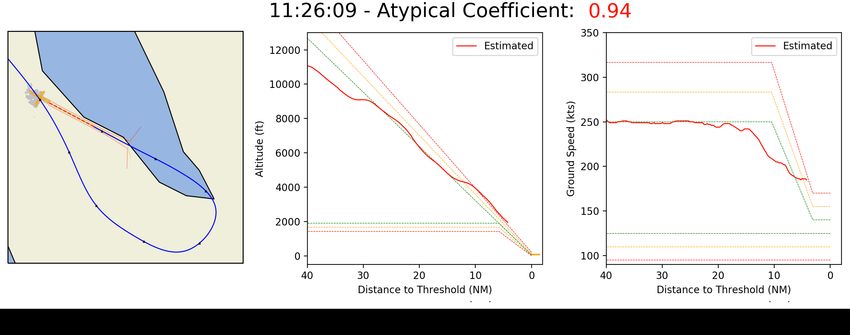
Preprints (www.preprints.org) | NOT PEER-REVIEWED | Posted: 12 March 2021

        Figure 1. Illustration of the Glide Interception From Above detection
        implemented at Charles de Gaulle airport. 3D volumes have been set up to
        detect when an aircraft is too high on the glide path. A recovery plan is
        proposed. If it is still too high on the glide path further downstream, the air
        traffic controllers suggest a go-around.

                                                                                              Figure 2. Illustration of the methodology for detecting atypical trajectories. A
                                                                                              sliding window is applied on all trajectories. The dimension is then reduced
           Previous work [10] has proposed using unsupervised learn-                          by applying a Functional Principal Component Analysis decomposition on
        ing to provide post-operational detection of atypical behaviour                       the portions of such trajectories. An outlier detection and scoring is applied
        in the total energy of the aircraft. This methodology proposed                        on the decomposition vector space, which allows to assign to each trajectory
                                                                                              portion a score between 0 and 1, determining the local atypicality.
        by Jarry et al. is based on the combination of a sliding win-
        dow, an information geometry tool called functional principal
        component analysis and outlier scoring as illustrated in Figure
        2. A portion of the flight is then considered atypical (and given                     the same philosophy but improves it by using a FPCA that
        a score of 1) if the total energy of the aircraft (computed in                        integrates the underlying functional nature of the trajectories,
        the runway referential using the ground speed, the vertical                           and the use of a sliding window that allows to localize the
        speed, and the height) does not behave in terms of norm                               atypicality. Finally, the distance to the remaining runway
        and variation like other flights at a particular distance from                        threshold, which is more appropriate for energy management,
        the runway threshold. In other word, the score is inversely                           is used as a reference instead of time. In addition, work has
        proportional to the statistical frequency in the learning data                        also been carried out on the detection of anomalies in on-
        set. The result is a continuous score between 0 and 1 along the                       board data using multiple kernel [16], active learning [17],
        trajectory. The score is 0 if the underlying segment is similar                       or recurrent neural network methods [18]. In general aviation
        to a large number of other segments at the same distance from                         operations, several projects have also been conducted to detect
        the runway threshold. The score is 1 if it is a totally unknown                       anomalies [19], and lead safety analysis with energy based
        energy segment, and it is then called atypical energy behaviour.                      metrics [20], [21]. In addition, Andreu et. al. have developed
        This is a post-operational methodology that requires the entire                       an on-board methodology [22] to propose recovery trajectories
        trajectory to be applied. It can not be applied directly in real                      when aircraft present over-energy. The roles of cockpit alerting
        time because the remaining trajectory to the runway threshold                         systems are multiple, but all present significant human factor
        is unknown. This methodology has been validated with flight                           issues and must be designed accordingly [23].
        data records from airline safety offices and safety events [11].                         Recently, Singh et al. [24] proposed real-time detection
        It showed a significant correlation between the atypical energy                       of unstable approaches. Their detection philosophy has sim-
        behavior and airline safety events. In particular, while the                          ilarities with the FPCA process. Indeed, they use the data
        unstabilized approach represents between 3 and 4% of typical                          set to estimate upper and lower limits of parameters, while
        flights, it accounts for 50.4% of atypical flights between 5NM                        Jarry et al. [10] propose to determine an atypical coefficient
        and the runway threshold. In addition, the methodology was                            based on clusters and their distribution. However, there are
        compared to the detection of anomalies with the help of gen-                          major differences. First, the upper and lower limits do not
        erative adversarial networks [12] in a similar way to an auto-                        account for potential atypical variations within these limits,
        encoder. The FPCA methodology presents similar results with                           which are detected with the FPCA process. Second, they
        the advantage of giving a local atypicality score. Moreover, it                       address a simplified problem, since they focus only on the last
        seems more flexible as it is deterministic and not subject to                         phase of flight, where the aircraft is aligned with the extended
        the potential problem of neural network convergence.                                  runway centreline. Third, they assume a normal distribution
           Other projects and research have been conducted to analyze                         assumption, which may not be true for all parameters. In
        anomalies, including anomalies in the onboard data. In partic-                        particular, the ground speed trajectories can easily be clustered
        ular, Li et al. have developed a very similar approach based                          into two groups. Indeed, some flights adopt their approach
        on PCA dimensional reduction and DBSCAN outlier scoring                               speed very early, while others wait until the very last moment
        [13]–[15]. The methodology proposed by Jarry et al. takes up                          to reduce speed, which implies at least a bi-modal distribution.

                                                                                          2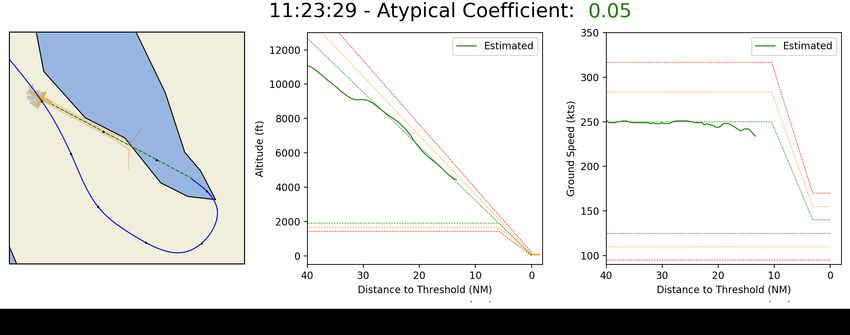
Preprints (www.preprints.org) | NOT PEER-REVIEWED | Posted: 12 March 2021

        C. Contribution

           This paper presents two major contributions. These contri-
        butions are based on the assumption that energy models [10]
        are available and illustrate how they can be used in a real-time
        framework. The first contribution is the real time extension of
        the post-operational methodology [10] using Dubins’ path as
        an estimator of the remaining distance. Second, a methodology
        to generate a typical 2D energy management trajectory is
        proposed while the aircraft is flying downwind or on base leg.
        At the end, a complete real-time atypical trajectory detection
        tool for Air Traffic Controllers is presented with two modes
        depending on the position of the aircraft. Before intercepting
        the localizer, the aircraft is usually radar vectored. At this
        stage, the tool is in a suggestion phase and gives two types of
        information. First, it estimates the current status of the aircraft
        considering a direct trajectory to intercept the localizer at the
        interception chevrons. Then, if this trajectory presents a high
        energy, a suggested trajectory is calculated. Finally, when the           Figure 3. Illustration of a Dubins path between two points A and B. The
                                                                                  solution here is RSL: a right turn, then a straight line, and finally a left turn.
        aircraft has intercepted the localizer, the tool switches to an
        alerting phase, giving the current status of the aircraft energy
        management.
           The paper is divided into three parts. First, the mathematical                             Z tf
        background around Dubins’ paths and optimal control is                             min tf =        1 dt
        presented. In addition, the real-time extension and the 2D                          u          0
        generation process using Dubins paths are detailed. Second,                        s.t. ẋ(t) = cos θ(t), x(0) = x0 , x(tf ) = xf ,
        the methodology and results are illustrated on different case                               ẏ(t) = sin θ(t), y(0) = y0 , y(tf ) = yf ,
        studies, in particular the Asiana Airline Flight 214 at San
        Francisco airport on July 6, 2013, the Pegasus Airlines Flight                          θ̇(t) = u(t), θ(0) = θ0 , θ(tf ) = θf ,
        2193, which overran Istanbul runway on February 5, 2020,                                          1
                                                                                                |u(t)] ≤ , t ∈ [0, tf ]
        the Hermes Airline Flight 7817, which overran Lyon Saint-                                         R
        Exupéry runway on March 29, 2013, and the Air India Express                  The solution is one of the following six combinations:
        Flight 1344, which overan Calicut airport on August 07, 2020.             RSR, RSL, LSR, LSL, RLR, LRL. Where R and L represent
                                                                                  respectively a right and left turning arc at maximum curvature,
                                                                                  and S a straight line segment. A simple illustration if given
                                                                                  in Figure 3, where the solution is RSL : a right turn, then
                  II. M ETHODOLOGY AND BACKGROUNDS                                a straight line, and finally a left turn. It has been applied
                                                                                  to various fields such as robotics for example. Buil et al.
        A. Dubin curves problem for trajectory generation                         applied Dubins’ method to find the shortest path for non-
                                                                                  holonomical robots [28]. Furthermore, it has been extended
           The real-time extension of the atypicality score triggers              to 3D by Chitsaz et al. referred as to Dubins’ plane [29].
        a major problem. To calculate the atypicality score, the re-
        maining distance to the runway threshold must be known.                   B. Real-time atypical scoring methodology
        This distance is well known if the aircraft is aligned with                  Returning to the real-time extension problem, the goal is
        the runway extension axis. However, if the aircraft is still              to estimate the remaining distance to the runway threshold,
        flying downwind or on base leg, the distance remaining to                 consequently a 2D path is sufficient for this evaluation. To
        the threshold is unknown. A simple estimate of the remaining              ensure this assumption, the real remaining distance is com-
        distance can be obtained using Dubins curves.                             pared with the estimated remaining distance using Dubin
           Key point of Dubin curves, is shortest path between A and              curves over 1600 radar data approaches. In Figure 5 are
        B when contraint by maximum curvature and a given direction               illustrated the box-plots of the differences between estimated
        of the line at A and B. The general solution was published by             and actual remaining distance between 15NM and 40NM that
        Dubins in 1958 [25]. It was also proved by Boissonnat et al.              are computed every 1NM.
        [26] by applying the principle of maximum Pontryagin [27].                   The error observes is negligible (under 1NM absolute error)
           The problem can be formulated as an optimal control                    from 15NM to 21NM. It then, underestimates the remaining
        problem, where the state variables are x, y, θ, the control               distance and usually gives a lower bound, which is the ex-
        variable is u, R is the minimum turning radius, and t is the              pected behavior. Only very few over estimations are observed
        curvilinear abscissa :                                                    and generally due to non-compliant approaches associated

                                                                              3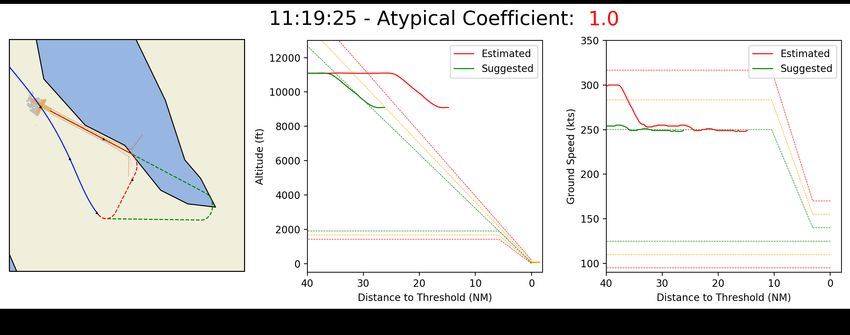
Preprints (www.preprints.org) | NOT PEER-REVIEWED | Posted: 12 March 2021

        Figure 4. Illustration of the different cases of the methodology. different situation. Case 1) in blue, corresponds to the portions of the trajectory where the
        aircraft is on the localizer (distance to the localizer less than one turning radius). Case 2) in green, corresponds to the portions of trajectory where the aircraft
        is at on base or downwind leg but beyond the perpendicular to the chevrons. Case 3) in red, corresponds to the portions of trajectories where the aircraft is
        in downwind leg, before the perpendicular to the chevrons.

        with trajectory shortening. The use of Dubin curves seems                            chevrons with the runway heading is calculated and added
        to be accurate.                                                                      to the distance between the FAP chevrons and the runway
           The following assumptions will be applied. First, the aircraft                    threshold.
        is considered to have a constant ground speed of 180kts and                             When the estimated remaining distance is calculated, it is
        turns with a bank angle of 25°, which implies a turning radius                       then easy to apply the scoring on the appropriate window,
        of 1.01NM. This is a lower bound assumption for the ground                           as proposed in the post-operational methodology [10]. In
        speed to obtain a lower bound estimation of the remaining                            summary, the post-operational method consists of applying
        distance. The bank angle is the usual bank angle recommended                         a functional principal component analysis and an atypical
        for turns. Three situations, illustrated in Figure 4, will be                        scoring on a sliding window, as shown in figure 2. At each
        considered to calculate the remaining distance:                                      point, the trajectory is given a score between 0 and 1.
           1) The aircraft is aligned with the runway extended cen-                             In summary, there are two ways to determine the remaining
               terline. The aircraft will be considered aligned with the                     distance depending on the aircraft situation. When the aircraft
               runway extended centreline if the distance between the                        has not yet intercepted the runway centreline, the distance is
               current position and its projection above the runway                          estimated by using Dubins curves. Otherwise, the remaining
               extended centreline is less than the minimum turning                          distance correspond to a straight line to the runway threshold.
               radius.                                                                       Finally, this distance is used to compute the atypical coefficient
           2) The aircraft is not aligned with the runway extended                           by applying the corresponding sliding window atypical energy
               centreline and its orthogonal projection on the run-                          model.
               way extended centreline is located after the intercept
               chevrons of the minimum altitude FAP.                                         C. Suggested trajectory methodology
           3) The aircraft is not aligned with the runway extended                              The trajectory generation process only addresses high-
               centreline, and its orthogonal projection on the runway                       energy cases where the aircraft has not intercepted the ex-
               extended centreline is located before the FAP minimum                         tended runway centreline. Low-energy cases are not studied
               altitude intercept chevrons.                                                  here. Indeed, when the atypicality is due to high energy, the
           In situation 1), the remaining distance to the runway thresh-                     idea is to give a longer trajectory in order to allow easier
        old is assumed to be the distance to the orthogonal projection                       dissipation of the excess of energy. Conversely, when a low
        plus the distance from the projection to the runway threshold.                       energy is detected, the idea is not to shorten the trajectory,
        In situation 2), the length of the Dubins curve from the                             so only the atypicality information is given to allow a better
        current position with the current heading to the orthogonal                          situation awareness. Indeed, the aircraft is usually operating
        projection with the runway heading is calculated and added                           in a traffic flow and a shortening of the trajectory could
        to the distance from the projection to the runway threshold.                         lead to the previous aircraft catching up. The good mitigating
        Finally, in situation 3), the length of the Dubins curve from                        strategy would be to maintain the energy level until it returns
        the current position with the current heading to the FAP                             to nominal.

                                                                                         4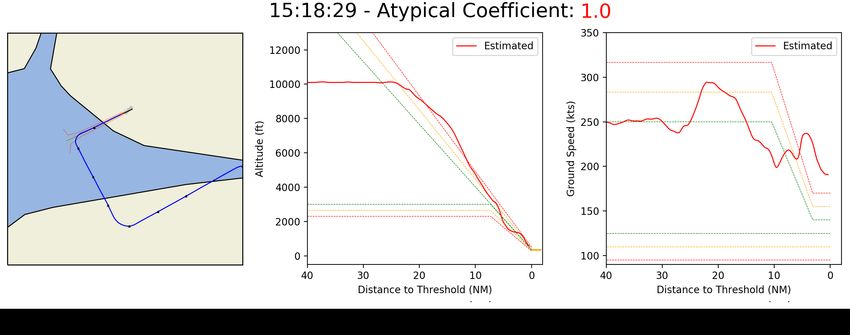
Preprints (www.preprints.org) | NOT PEER-REVIEWED | Posted: 12 March 2021

        Figure 5. Box plot of the difference between estimated and real remaining distance between 15NM and 40NM (computed every 1NM over 1600 radar
        trajectories)

           The generation process is simple; the point of interception           Saint-Exupéry runway on March 29, 2013, and the Air India
        of the localizer is gradually moved away from the runway                 Express Flight 1344, which overan Calicut airport on August
        threshold until a suitable atypicality level is reached. At each         07, 2020.
        stage, the current energy state is evaluated using Dubins                   For each crash, snapshots at certain moments of the trajec-
        curves. The generation process is carried out if the coefficient         tory will be presented. They illustrate the algorithm’s behavior
        of the current state is greater than 0.2 and the process is              and the information it could have transmitted to the air
        stopped if such a coefficient on the generated trajectory is             traffic controller. The coefficient displayed at the top of each
        less than 0.05.                                                          snapshot always corresponds to the direct trajectory to the
                                                                                 point of interception. If the aircraft is in suggestion phase
        D. Summary                                                               with high energy an alternative trajectory will be proposed,
           This paragraph details how to apply the methodology in                otherwise only the energy atypical information will be given.
        real time mode or in replay mode as for the four following               Additionally, the energy model used was previously built on
        use cases.                                                               a large data set (more than 15 000 trajectories).
           Let’s consider that the aircraft is in downwind leg (situation
        2) or 3) in Figure 2). Its last positions are known but the next         A. Asiana flight 214
        positions are unknown. In a replay mode, the next positions
                                                                                    On July 6, 2013, a Boeing 777-200ER operating Asiana
        are voluntarily hidden. Here is the process to apply at every
                                                                                 Airlines Flight 214 struck a seawall at San Francisco Inter-
        time step:
                                                                                 national Airport (SFO) in San Francisco, California. Three
           • With the current position and direction compute the esti-
                                                                                 passengers were fatally injured; 40 passengers were seriously
             mated curve with the methodology presented in Section               injured. The aircraft was destroyed by the force of the impact
             II-B and deduce the estimated remaining distance.                   and a post-crash fire. [8].
           • Apply an energy model to obtain the atypicality score
                                                                                    The flight was vectored for a visual approach to Runway
             for this estimated trajectory with the estimated remaining          28L and intercepted the final approach track at an altitude
             distance.                                                           slightly above the desired 3° glide path. After accepting air
           • If the trajectory presents an atypicality due to high energy,
                                                                                 traffic control’s instruction to maintain a speed of 180 knots
             apply the methodology presented in section II-C to obtain           at 5 nm from the runway, the crew mismanaged the aircraft’s
             the trajectory suggestion. Otherwise stop there and wait            descent and the aircraft was well above the 3° glide path.
             for the next time step.                                             In an attempt to increase the aircraft’s rate of descent and
           Let’s now consider that the aircraft is now in situation 1) in        capture the desired glide path, the pilot flying (PF) selected
        Figure 2. Only the two first steps presented above are applied.          an autopilot (A/P) mode (speed of flight level change (FLCH
                                                                                 SPD)) that, instead, caused the autopilot system to initiate a
                                   III. S TUDY                                   climb because the aircraft was below the selected altitude. The
           The purpose of this section is to illustrate the use of the           PF disconnected the A/P and moved the thrust levers to idle,
        tool and its functionalities. The analysis of four air crashes in        causing the autothrottle (A/T) to go into HOLD mode, a mode
        replay mode is presented : the Asiana Airline Flight 214 at              in which the A/T does not control airspeed.
        San Francisco airport on July 6, 2013, the Pegasus Airlines                 At 500 feet above the airport elevation, the stabilization
        Flight 2193, which overran Istanbul runway on February 5,                altitude, the precision approach path indicator (PAPI) would
        2020, the Hermes Airline Flight 7817, which overran Lyon                 have shown that the aircraft was slightly above the desired

                                                                             5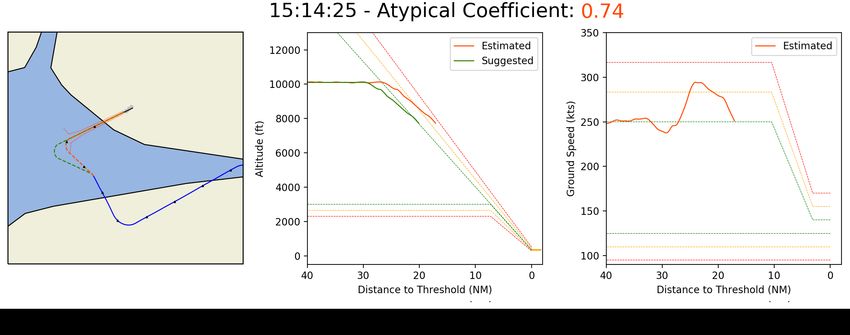
Preprints (www.preprints.org) | NOT PEER-REVIEWED | Posted: 12 March 2021

        Figure 6. Illustration of the Asiana Airline Flight 214. Figure a) represents the 2D trajectory, Figure b) illustrates the altitude profile, and Figure c) the ground
        speed profile. The plane is here in downwind leg (a). The tool indicates that a direct to the interception chevrons is critical (in red) and would cause the plane
        to be in over-energy due to high potential energy figure (a). The tool suggests a trajectory extending the tailwind leg (in green).

        Figure 7. Illustration of the Asiana Airline Flight 214 crash. Figure a) represents the 2D trajectory, Figure b) illustrates the altitude profile, and Figure c)
        the ground speed profile. The plane has just intercepted the runway centerline (a) and is in good condition, it is on the glide path (b) and presents a nominal
        speed (c).

        glide path. The airspeed had just reached the correct approach                       key points of the algorithm. First, the use when the aircraft
        speed of 137 knots. However, the thrust levers were still at                         is downwind, allows to alert of the aircraft status in the case
        idle, and the rate of descent was about 1200 feet per minute,                        of a radar vectoring for example. Second, the ability to detect
        well above the theoretical descent rate of about 700 fpm. The                        atypical variations within acceptable limits.
        aircraft subsequently descended below the desired glide path
        and the airspeed continued to decrease. At about 200 feet,                              At 11:19:25 the aircraft is downwind, perpendicular to the
        the flight crew became aware of the low airspeed and the low                         intercepting chevrons. The atypicity score for a direct hit to
        trajectory but did not initiate a go-around until the aircraft was                   the chevrons is maximum (1.0). The aircraft has a ground
        below 100 feet, at which point the aircraft did not have the                         speed of 250kts, and is very high on the plane. The suggested
        performance necessary to perform a go-around.                                        trajectory mode proposes to extend the trajectory to intercept
                                                                                             the runway centerline further (see Figure 6). At 11:23:29, the
           On-board data, available on the NSTB website, was used to                         aircraft intercepted the runway centreline after an extended
        study this crash. Only the parameters available on the ground                        downwind leg. The atypical coefficient returned to nominal
        (ground speed, vertical speed and altitude) are used by the                          values. The plane is very slightly above the glide path with a
        algorithm .The study of this crash allows to highlight two                           speed of 240 kts ground speed (see Figure 7) At 11:26:09, the

                                                                                         6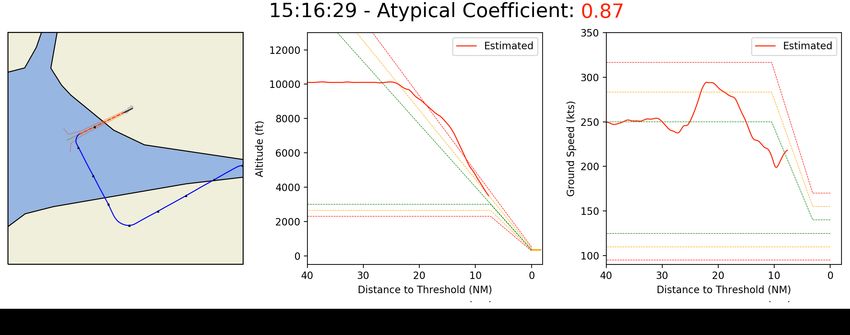
Preprints (www.preprints.org) | NOT PEER-REVIEWED | Posted: 12 March 2021
Figure 8. Illustration of the Asiana Airline Flight 214 crash. Figure a) represents the 2D trajectory, Figure b) illustrates the altitude profile, and Figure c) the
ground speed profile. The aircraft is 5NM from the runway threshold (a), above the glide path (b) with a ground speed of 180kts due to air traffic constraints
(c). The plane is in over-energy due to both high potential and kinetic energy.
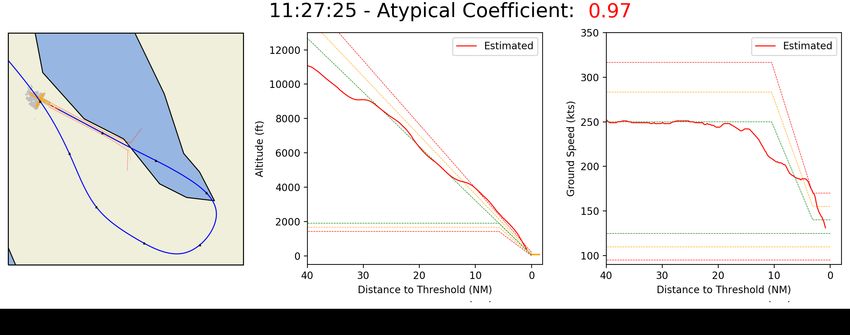
Figure 9. Illustration of the Asiana Airline Flight 214 crash. Figure a) represents the 2D trajectory, Figure b) illustrates the altitude profile, and Figure c)
the ground speed profile. The plane is at 500ft ground level, its speed (c) and altitude (b) have returned to nominal values but its energy variation is atypical
(with a coefficient of 0.97) and directs it towards an under-energy
aircraft is 5NM from the runway threshold, at 180kts ground have been detected with this type of tool.
speed (ATC constraint) and above the theoretical glide path.
The atypicality is high (0.94), and the aircraft is showing
B. Pegasus Airlines flight 2193
an over-energetic condition (see Figure 8). At 11:27:25, the
aircraft is at 500ft ground level on glide path and at approach On February 5, 2020, the Boeing 737-800 of Pegasus
speed. However its energy variation is atypical and it has an Airlines flight 2193 from Izmir suffered a runway overrun
atypical score of 0.97 which will not decrease for the rest of on landing at Sabiha-Gökçen Airport in Istanbul, Turkey and
the final (see Figure 9). broke into three parts [30], [31]. Three people were killed,
179 injured and the plane was destroyed. It comes less than
This case is very interesting because the aircraft has a month after another Boeing 737 from the same company
switched from high energy to low energy. Traditional methods overran the runway at the same airport.
with a high and a low bound do not take into account the The journey from Adnan-Menderes Airport in Izmir to
sudden and atypical variations. Thus, during a certain period Istanbul went without a hitch. Around 18:30 local time (15:30
of time the aircraft could be considered in a nominal phase UTC), the plane attempted to land at Istanbul-Sabiha Gökçen
when it is not. Its abrupt energy variation is atypical and could in heavy rain and with a strong tail wind. A thunderstorm with
7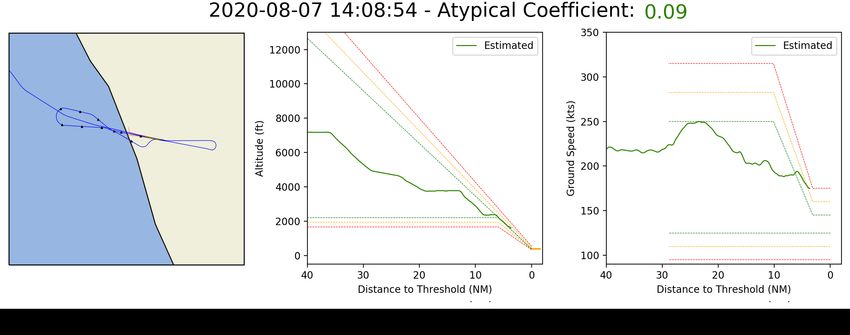
Preprints (www.preprints.org) | NOT PEER-REVIEWED | Posted: 12 March 2021

        Figure 10. Illustration of the Pegasus Airline Fight 2193 crash. Figure a) represents the 2D trajectory, Figure b) illustrates the altitude profile, and Figure
        c) the ground speed profile. The plane turns in base leg (a). Its ground speed increases (c) and it passes over the glide path (b).The tool suggests to slightly
        lengthen the track (in green).

        Figure 11. Illustration of the Pegasus Airline Fight 2193 crash. Figure a) represents the 2D trajectory, Figure b) illustrates the altitude profile, and Figure
        c) the ground speed profile. The plane is on the base segment (a). Its ground speed is back to normal (c) but it is high on the glide path (c). The tool still
        suggests extending the trajectory (in green).

        strong gusts of wind was crossing the area at the time of the                      remedial trajectories be proposed, or could a go-around be
        accident [30], [31].                                                               suggested ? To answer this question, the algorithm presented in
                                                                                           the previous sections has been applied to the ADS-B trajectory
           After what the Turkish Minister of Transport and Infras-
                                                                                           of this flight from flightradar24.
        tructure described as a "hard landing", the plane failed to
        decelerate in time. After skidding at the eastern end of the                          The flight analysis is now presented. For context, the aircraft
        runway, it slid about 60 metres and fell from a 30-40 metre                        fly over the runway threshold at 15:18:30 UTC. At 15:12:17, 6
        high embankment and split into three sections. The forward                         minutes before, our algorithm indicates an atypical coefficient
        part of the fuselage was particularly damaged during the                           of 0.73 materialized by the red dashed trajectory as shown in
        incident. The passengers escaped from the aircraft through                         Figure 10. The aircraft turns in base leg and passes above the
        holes between the fuselage sections. A fire broke out and was                      standard 3° glide path with a ground speed of 250kts. The
        quickly extinguished by the firefighters.                                          algorithm proposes a suggested trajectory (in green dashed
                                                                                           line) by slightly moving back the point of interception of the
          This flight presents an over-energy, and raises the question
                                                                                           localizer.
        of energy management upstream. To what extent could it be
        detected that the flight presented excess energy and could                           At 15:14:25, two minutes later, the plane is still high on the

                                                                                       8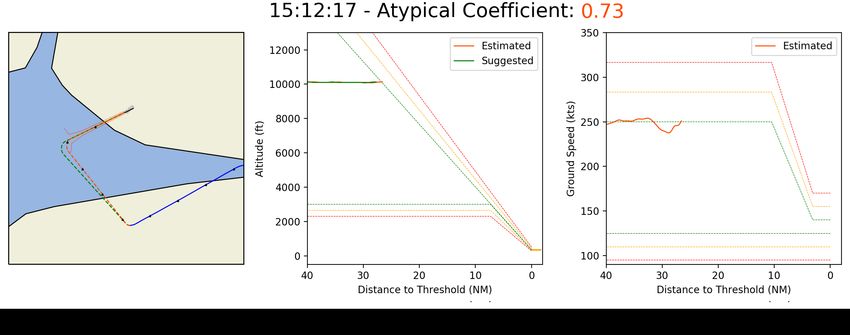
Preprints (www.preprints.org) | NOT PEER-REVIEWED | Posted: 12 March 2021

        Figure 12. Illustration of the Pegasus Airline Fight 2193 crash. Figure a) represents the 2D trajectory, Figure b) illustrates the altitude profile, and Figure c)
        the ground speed profile. The plane is on final approach (a), it is high on the glide path (b). Its ground speed is increasing (c) and its atypical score is 0.87.

        Figure 13. Illustration of the Pegasus Airline Fight 2193 crash. Figure a) represents the 2D trajectory, Figure b) illustrates the altitude profile, and Figure c)
        the ground speed profile. The aircraft is 1NM from the runway threshold. The glide path management presents large variations, its ground speed is 190kts
        the atypicality did not decrease throughout the final.

        glide path, the ground speed momentarily increased before                           fluctuating up to 240kts, and finally 190kts when flying over
        coming back to 250kts, probably due to a gust of wind. The                          the runway threshold as shown in Figure 13.
        coefficient of atypicality is still high (0.74), in the same way
        the algorithm proposes to lengthen the trajectory to dissipate
        the excess of energy as shown in Figure 11.
                                                                                               In addition, the full post-operational study of the trajectory
           At 15:16:29, the plane is on the localizer, the algorithm                        shows a non-conformity of the approach, the trajectory has
        switches to backup net mode. The algorithm gives an atypi-                          been shortened and the localizer intercepted downstream of
        cality coefficient of 0.83. The plane is still a bit high on the                    the interception chevrons. The on-board parameters are not
        glide path and its ground speed has just slightly increased to                      available but the management of the vertical profile brings the
        215kts as shown in Figure 12.                                                       question of flight stabilisation. In any case, the flight had been
           Throughout the final approach, the atypicality coefficient                       showing non-negligible signs of high energy for 6 minutes.
        will not fall below 0.8 and will cap at 1.0 from 1500ft to                          The extreme weather conditions, the wet runway, could have
        the runway threshold. It is also noted that the vertical profile                    prompted the controllers, if they had had access to such a tool,
        shows strong variations, the aircraft momentarily passes below                      to suggest to the pilots a go-around and thus perhaps avoid
        and then above the glide path. The ground speed is also very                        the accident.

                                                                                        9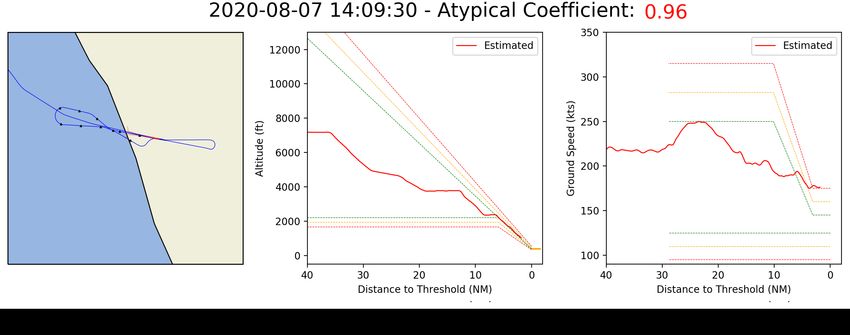
Preprints (www.preprints.org) | NOT PEER-REVIEWED | Posted: 12 March 2021

        Figure 14. Illustration of the Hermes Airline Fight 7817 crash. Figure a) represents the 2D trajectory, Figure b) illustrates the altitude profile, and Figure
        c) the ground speed profile. The crew follows the localizer interception heading given by the Air Traffic Controller and requests permission to deviate its
        trajectory by 10° left to avoid a cloud a). The aircraft’s ground speed is slightly high (c) and it is still under the glide path (b).The tool indicates that the
        aircraft is in a typical situation.

        Figure 15. Illustration of the Hermes Airline Fight 7817 crash. Figure a) represents the 2D trajectory, Figure b) illustrates the altitude profile, and Figure c)
        the ground speed profile. The aicraft intercepts the runway extended certerline. The deviation of 10° right, shortened the track a), the plane is now above the
        glide path b). The aircraft’s ground speed is around 250kts (c). The tool indicates an atypical situation due to an excess of potential energy.

        C. Hermes Airlines flight 7817                                                     runway 1,600 metres past threshold 36R. The aircraft exited
                                                                                           the runway longitudinally and came to rest about 300 metres
          The report of the French Bureau d’Enquêtes et d’Analyse                          past the opposite threshold.
        (BEA) [32], in charge of investigating this crash describes the                       The following analysis of the flight by the atypicality
        accident as follows.                                                               algorithm was performed on the radar data recorded by the
          The crew flew a category 1 (CAT I) ILS approach on runway                        French Air Navigation Service Provider (ANSP).
        36R with an Airbus A321 at Lyon Saint-Exupéry aerodrome.                              At 19:39:52, the aircraft follows the localizer interception
        The weather conditions were such that low visibility operating                     heading given by the Air Traffic Controller. In order to avoid
        procedures (LVP) prevailed.                                                        a cloud, the crew requested permission to deviate its trajectory
          As the aircraft crossed the stabilization height at 1 000 ft, the                by 10° left. At this moment, the aircraft is in a typical situation
        speed of the aircraft was 57 kt higher than the approach speed.                    the atypical coefficient is 0.01. The aircraft is just below
        At 140 ft, an inappropriate increase in thrust by autothrust                       glide path with a slightly high ground speed (280 kts) but
        keeps the aircraft at a high speed.                                                the remaining distance leaves a large margin to reduce speed
          The flare is long and the aircraft touches down on the                           (see Figure 14).

                                                                                      10
Preprints (www.preprints.org) | NOT PEER-REVIEWED | Posted: 12 March 2021
Figure 16. Illustration of the Hermes Airline Fight 7817 crash. Figure a) represents the 2D trajectory, Figure b) illustrates the altitude profile, and Figure c)
the ground speed profile. The plane has just recovered the glide path a). However, the potential energy b) has been transformed into kinetic energy and there
is a slight increase of the ground speed towards 260kts c). The atypicality increases around 0.88 due to an excess of kinetic energy.
Figure 17. Illustration of the Hermes Airline Fight 7817 crash. Figure a) represents the 2D trajectory, Figure b) illustrates the altitude profile, and Figure c)
the ground speed profile. The aircraft is about 3NM from the runway threshold a). Its atypicality peaks at 1.0 because of a very high ground speed of 210
kts c), although decreasing. The aircraft is not stabilized with a very high speed and nevertheless continues its approach.
At 19:42:54, the plane intercepts the runway extended continues its approach (see Figure 17).
certerline. The deviation of 10° right, shortened the track, the The study based on the algorithm shows that an energy
plane is now above the glide path. Its ground speed is 250kts. atypicality due to excessive energy appeared as early as 13NM
The atypicality is 0.75 due to an excess of potential energy. before the runway threshold and continued throughout the
(see Figure 15). final approach. The tool therefore shows the possibilities of
At 19:44:22, the plane has just recovered the glide path. anticipation and can be seen as a situation awareness alerting
However the potential energy has been transformed into kinetic system.
energy and there is a slight increase of the ground speed
towards 260kts. The atypicality increases around 0.88 due to D. Air India Express flight 1344
an excess of kinetic energy (see Figure 16).
On August, 7 2002, a B737 Air India Express Flight 1344
At 19:45:59, the aircraft is about 3NM from the runway was intented to land at Calicut International Airport [33].
threshold. Its atypicality peaks at 1.0 because of a very high The approach was for runway 28, but two landings were
ground speed of 210 kts, although decreasing. The aircraft aborted due to tailwind, and the aircraft circled, awaiting
is not stabilized with a very high speed and nevertheless clearance, before landing on runway 10. Due to the monsoon
11Preprints (www.preprints.org) | NOT PEER-REVIEWED | Posted: 12 March 2021
Figure 18. Air India Express Fight 1344 lateral, altitude and speed profiles. The aircraft intercepts the runway extended center line (a). The aircraft’s ground
speed and altitude profile are nominal (a and c). The tool indicates that the aircraft is in a typical situation.
Figure 19. Air India Express Fight 1344 lateral, altitude and speed profiles. The altitude profile is nominal however, its ground speed is around 200kts with
no sign of reduction. The atypical coefficient has increased up to 0.97 underlying an atypical variation leading the aircraft to high energy.
and flooding in Kerala at the time, poor weather conditions At 14:04:42, the aircraft intercepts the runway extended
reduced the visibility at the time of landing to 2 000 m (6 600 center line, the ground speed, the altitude profile and the
ft). Runway 28 was in use, and on the first attempt to land, atypical coefficient are nominal (see Figure 18).
the pilot could not see the runway and requested runway 10. At 14:08:02, the aircraft intercepts the glide path, the
On the second attempt on Runway 10 at 2 860 m (9 380 ft), altitude profile is nominal however, its ground speed is around
the aircraft landed near Taxiway "C", which is approximately 200kts with no sign of reduction. The atypical coefficient has
1 000 m (3 300 ft) beyond the runway threshold. The aircraft increased up to 0.97 underlying an atypical variation leading
did not stop short of the end of the runway and plunged 9 to the aircraft to high energy (see Figure 19).
10.5 m (30-35 ft) into a gorge, which split the fuselage in two At 14:08:54, the aircraft descends on the glide path, the
at impact. A total of 184 passengers, four cabin crew and two ground speed has started to reduce down to 175kts. The
cockpit crew were on board. Eighteen people died in the crash atypical coefficient is back to green areas(0.09). The reduction
(16 passengers and both pilots) and more than 100 people were of the energy returns the aircraft to a less atypical state (see
injured. Additionally, bad weather conditions with tail wind in Figure 20).
final approach and a wet runway were observed. At 14:09:30, the ADS-B data stopped at 1.6NM to the
Using the FlightRadar24 ADS-B data, the replay method- runway threshold. The aircraft is still on the glide path.
ology will be apply to analyse the final attempt. However, the ground speed is not reducing anymore and
12Preprints (www.preprints.org) | NOT PEER-REVIEWED | Posted: 12 March 2021
Figure 20. Air India Express Fight 1344 lateral, altitude and speed profiles. The aircraft descends on the glide path, the ground speed has started to reduce
down to 175kts. The atypical coefficient is back to green areas(0.09). The reduction of the energy returns the aircraft to a less atypical state
Figure 21. Air India Express Fight 1344 lateral, altitude and speed profiles. The ADS-B data stopped at 1.6NM to the runway threshold. The aircraft is still
on the glide path. However, the ground speed is not reducing anymore and stagnates at 175kts. The atypical coefficient increased up to 0.96 again underlying
a high kinetic energy
stagnates at 175kts. The atypical coefficient increased up to only very few flights in the learning set have performed this
0.96 again underlying a high kinetic energy (see Figure 20). energy management at this estimated remaining distance.
The proposed interface is not necessarily the one that
IV. D ISCUSSIONS would be suitable for air traffic controllers. One could for
With this proposal, different questions immediately come example imagine interception chevrons with variable position.
to mind and have been raised by the different operators (ATC If a direct trajectory from current position induces a high
and airlines) to whom the model has been presented. energy, the interception chevron would be pushed back to the
First of all, the notion of false positives is crucial. Indeed, suggested situation.
in the case of real time use by air traffic controllers, it is Concerning the energy management on approach, the work
not possible for too many warnings to appear. This implies carried out previously [11] has shown that one out of two
an appropriate calibration which could be done by coupling atypical flights between 5NM and the runway threshold are
with other statistical methods. It is nevertheless important to unstabilized. Calibration could therefore be considered by
point out that high atypical scores represent a situation with phase of flight and be more severe when approaching the
very low, if not zero, frequency in the historical data set. In runway threshold. The energy model could also integrate
other words, if the atypicality score is high, it implies that rotational energy in order to better analyze transitions between
13Preprints (www.preprints.org) | NOT PEER-REVIEWED | Posted: 12 March 2021
straight lines and curves. Additional information from ma- [3] DGAC, “Safety state program, 2009-2013,” 2009. Available at
chine learning tools [34] could help understanding on-board https://www.ecologique-solidaire.gouv.fr/sites/default/files/DGAC_
Plan-Strategique_2009-2013_FR.pdf.
behaviours. [4] DGAC, “Safety state program, horizon 2018,” 2013. Available
Secondly, the tool is placed in the framework of artificial at https://www.ecologique-solidaire.gouv.fr/sites/default/files/
intelligence, which implies an elaboration of the model from DGAC-PS-2018-FR-WEB.pdf.
[5] DGAC, “Safety state program, horizon 2023,” 2019. Available
a training set. On this subject, a road map has just been at https://www.ecologique-solidaire.gouv.fr/sites/default/files/DSAC_
published by EASA : [35]. It seems obvious that such a tool, if PlanHorizon_2023_FR.pdf.
used in real time, must follow the guidelines of the road map [6] DGAC, “Risk portfolio, ssp 2009-2013,” 2010. Available
at https://www.ecologique-solidaire.gouv.fr/sites/default/files/
to insure the trusworthiness of AI. In addition, such tools could Cartographie_Risques_10_2010.pdf.
lead to legal liabilities and therefore imply the implementation [7] Centro de Publicaciones, Ministerio de Fomento, “Report A-029/2011,
of detailed operational manuals and procedures. Accident Involving a Bombardier CL-600-2b19 (CRJ200), Registration
EC-ITU, Operated by Air Nostrum, at the Barcelona Airport, on 30 July
Nevertheless, a less critical and simpler to implement use is 2011,” tech. rep., Comisión de Investigación de Accidentes e Incidentes
condisered by airlines in the framework of flight data analysis. de Aviación Civil, Madrid, 2013. Available at https://www.fomento.
Indeed, this type of tool presents a major advantage for the gob.es/NR/rdonlyres/0E877F5B-5703-4AF3-95D9-3C6B1B8A2899/
118577/2011_029_A_ENG.pdf.
training and analysis of flights in replay mode. It allows [8] C. A. Hart, R. L. Sumwalt, M. R. Rosekind, and E. F. Weener,
operators to highlight potentially unmonitored flight events and “Descent Below Visual Glidepath and Impact With Seawall Asiana
above all is a pedagogical means of making crews aware of Airlines Flight 214 Boeing 777-200er, HL7742 San Francisco, Cali-
fornia July 6, 2013,” tech. rep., National Transportation Safety Board,
the stakes of energy management during approach and landing. 2014. Available at https://www.ntsb.gov/investigations/AccidentReports/
A Study carried out during COVID-19 crisis have shown an Reports/AAR1401.pdf.
increased number of atypical behaviours during low traffic [9] Y. Jiao, H. Sun, C. Wang, and J. Han, “Research on unstable approach
detection of civil aviation aircraft,” Procedia computer science, vol. 131,
periods [36]. pp. 525–530, 2018.
[10] G. Jarry, D. Delahaye, F. Nicol, and E. Feron, “Aircraft atypical approach
V. C ONCLUSIONS detection using functional principal component analysis,” Journal of Air
Transport Management, vol. 84, p. 101787, 2020.
In this paper a tool for detecting atypical aircraft approaches [11] G. Jarry, D. Delahaye, and E. Féron, “Trajectory approach analysis: A
was presented. The major contribution is the real-time ex- post-operational aircraft approach analysis tool,” 2019.
[12] G. Jarry, N. Couellan, and D. Delahaye, “On the use of generative
tension of a post-operational algorithm using Dubins paths. adversarial networks for aircraft trajectory generation and atypical
Two underlying uses have been presented and applied to approach detection,” 2019.
aircraft crashes. First, an estimation of the current state of the [13] L. Li, S. Das, R. John Hansman, R. Palacios, and A. N. Srivastava,
“Analysis of flight data using clustering techniques for detecting ab-
aircraft by considering that the aircraft makes a direct to the normal operations,” Journal of Aerospace information systems, vol. 12,
interception chevrons. Second, in the case where the previous no. 9, pp. 587–598, 2015.
estimate presents a high energy state, a trajectory is suggested [14] L. Li, R. J. Hansman, R. Palacios, and R. Welsch, “Anomaly detection
via a gaussian mixture model for flight operation and safety monitor-
to bring the aircraft back to a nominal energy state. ing,” Transportation Research Part C: Emerging Technologies, vol. 64,
This methodology presents a major advance, giving direc- pp. 45–57, 2016.
tions to new situation awareness alerting systems. The use in [15] L. Li, M. Gariel, R. J. Hansman, and R. Palacios, “Anomaly detection in
onboard-recorded flight data using cluster analysis,” in 2011 IEEE/AIAA
real time must obviously be subject to adequate calibration 30th Digital Avionics Systems Conference, pp. 4A4–1, IEEE, 2011.
and the development of operational procedures. However, a [16] S. Das, B. L. Matthews, A. N. Srivastava, and N. C. Oza, “Multiple
use in the framework of flight data analysis and flight safety kernel learning for heterogeneous anomaly detection: algorithm and
aviation safety case study,” in Proceedings of the 16th ACM SIGKDD
training as well as a use by safety authorities for prevention international conference on Knowledge discovery and data mining,
and safety improvement is envisaged in the very short term. pp. 47–56, 2010.
Finally, future works will focus on the real time calibration [17] M. Sharma, K. Das, M. Bilgic, B. Matthews, D. Nielsen, and N. Oza,
“Active learning with rationales for identifying operationally significant
of the methodology, the investigation of more cases and anomalies in aviation,” in Joint European Conference on Machine Learn-
the existence and minimization of false positives. Additional ing and Knowledge Discovery in Databases, pp. 209–225, Springer,
researches could be lead on the development of an appropriate 2016.
[18] A. Nanduri and L. Sherry, “Anomaly detection in aircraft data using
learning process and the use of complementary methods in recurrent neural networks (rnn),” in 2016 Integrated Communications
order to obtain a robust model meeting the safety requirement Navigation and Surveillance (ICNS), pp. 5C2–1, Ieee, 2016.
set by the EASA road-map. Other extensions could be made [19] T. G. Puranik and D. N. Mavris, “Anomaly detection in general-aviation
operations using energy metrics and flight-data records,” Journal of
to improve the trajectory generation process, by extending a Aerospace Information Systems, vol. 15, no. 1, pp. 22–36, 2018.
3D trajectory, or by integrating the atypicality coefficient in a [20] T. Puranik, H. Jimenez, and D. Mavris, “Energy-based metrics for safety
dedicated control model. Finally, it is also possible to consider analysis of general aviation operations,” Journal of Aircraft, vol. 54,
no. 6, pp. 2285–2297, 2017.
the use of reinforcement learning to suggest an on-board [21] T. G. Puranik, H. Jimenez, and D. N. Mavris, “Utilizing energy met-
trajectory that takes into account the aircraft configurations. rics and clustering techniques to identify anomalous general aviation
operations,” in AIAA Information Systems-AIAA Infotech@ Aerospace,
R EFERENCES p. 0789, 2017.
[22] R. Andreu Altava, J. C. Mere, D. Delahaye, and T. Miquel, “Graph-
[1] M. Tremaud, “Getting To Grips With ALAR,” tech. rep., Airbus Indus- search descent and approach trajectory optimization based on enhanced
trie, Oct. 2000. Available at https://www.cockpitseeker.com/wp-content/ aircraft energy management,” in AIAA Aviation 2019 Forum, p. 3618,
uploads/goodies/ac/a320/pdf/data/GettingToGripsWithALAR.pdf. 2019.
[2] IATA, “2036 Forecast Reveals Air Passengers Will Nearly Double to [23] A. Pritchett, “Reviewing the role of cockpit alerting systems,” in Human
7.8 Billion,” Oct. 2017. Available at https://www.iata.org/pressroom/pr/ Factors and Aerospace Safety: An International Journal: No. 1, pp. 5–
pages/2017-10-24-01.aspx. 38, Taylor and Francis, 2017.
14Preprints (www.preprints.org) | NOT PEER-REVIEWED | Posted: 12 March 2021
[24] N. P. Singh, S. K. Goh, and Sameer Alam, “Real-time Unstable
Approach Detection Using Sparse Variational Gaussian Process,” in 1st
International Conference on Artificial Intelligence and Data Analytics
for Air Transportation (AIDA-AT 2020), 2020.
[25] L. E. Dubins, “On curves of minimal length with a constraint on
average curvature, and with prescribed initial and terminal positions and
tangents,” American Journal of mathematics, vol. 79, no. 3, pp. 497–516,
1957.
[26] J.-D. Boissonnat, A. Cérézo, and J. Leblond, “Shortest paths of bounded
curvature in the plane,” Journal of Intelligent and Robotic Systems,
vol. 11, no. 1-2, pp. 5–20, 1994.
[27] L. S. Pontryagin, Mathematical theory of optimal processes. Routledge,
2018.
[28] X.-N. Bui, J.-D. Boissonnat, P. Soueres, and J.-P. Laumond, “Shortest
path synthesis for dubins non-holonomic robot,” in Proceedings of
the 1994 IEEE International Conference on Robotics and Automation,
pp. 2–7, IEEE, 1994.
[29] H. Chitsaz and S. M. LaValle, “Time-optimal paths for a dubins
airplane,” in 2007 46th IEEE conference on decision and control,
pp. 2379–2384, IEEE, 2007.
[30] “Three dead, 180 hurt as plane skids off runway,” BBC News, Feb. 2020.
Available at https://www.bbc.com/news/world-europe-51384667.
[31] “Pegasus Airlines flight 2193 overruns runway in Istanbul,”
Feb. 2020. Availaible at : https://www.flightradar24.com/blog/
pegasus-airlines-flight-2193-overruns-runway-in-istanbul/.
[32] B. d’Enquêtes et Analyses, “Rapport accident survenu le 29 mars 2013
sur l’aéroport de lyon saint-exupéry (69) à l’airbus a321 immatriculé sx-
bhs exploité par hermes airlines affrété par air méditerranée,” tech. rep.,
Bureau d’Enquêtes et d’Analyses, 2015. Available at https://www.bea.
aero/fileadmin/documents/docspa/2013/sx-s130329/pdf/sx-s130329.pdf.
[33] “Air India Express Flight 1344,” Wikipedia, Aug. 2020. Page Version
ID: 972120506.
[34] G. Jarry, D. Delahaye, and E. Feron, “Approach and landing aircraft
on-board parameters estimation with lstm networks,” in 2020 Interna-
tional Conference on Artificial Intelligence and Data Analytics for Air
Transportation (AIDA-AT), pp. 1–6, IEEE, 2020.
[35] “EASA Artificial Intelligence Roadmap 1.0 published | A human-centric
approach to AI in aviation.” https://www.easa.europa.eu/newsroom-and-
events/news/easa-artificial-intelligence-roadmap-10-published. Library
Catalog: www.easa.europa.eu.
[36] G. Jarry, D. Delahaye, and E. Feron, “Flight safety during covid-
19: A study of charles de gaulle airport atypical energy approaches,”
Transportation research interdisciplinary perspectives, vol. 9, p. 100327,
2021.
15You can also read