HAND PHONE USERS SURVEY 2017 - SKMM
←
→
Page content transcription
If your browser does not render page correctly, please read the page content below
ISSN 1823-2523

          SURUHANJAYA KOMUNIKASI DAN MULTIMEDIA MALAYSIA
      MALAYSIAN COMMUNICATIONS AND MULTIMEDIA COMMISSION

HAND PHONE USERS SURVEY 2017
                  STATISTICAL BRIEF NUMBER TWENTY-TWO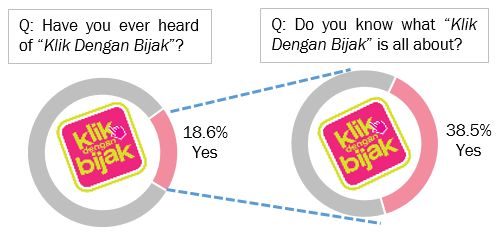
MALAYSIAN COMMUNICATIONS AND MULTIMEDIA COMMISSION, 2017

The information or material in this publication is protected under copyright and, except where otherwise
stated, may be reproduced for non-commercial use provided it is reproduced accurately and not used
in a misleading context. Where any material is reproduced, the Malaysian Communications and
Multimedia Commission (MCMC), as the source of the material, must be identified and the copyright
status acknowledged.

The use of any image, likeness, trade name and trademark in this publication shall not be construed as
an endorsement by the MCMC of the same. As such, the inclusion of these images, likenesses, trade
names and trademarks may not be used for advertising or product endorsement purposes, implied or
otherwise.

Published by:
Malaysian Communications and Multimedia Commission
MCMC Tower 1, Jalan Impact, Cyber 6
63000 Cyberjaya, Selangor Darul Ehsan
Tel: +60 3 8688 8000 Fax: +60 3 8688 1000
Aduan MCMC: 1-800-188-030
http://www.mcmc.gov.my

                            HAND PHONE USERS SURVEY 2017                              P a g e 1 | 61
TABLE OF CONTENTS

SECTION 1: EXECUTIVE SUMMARY ........................................................................................ 3
SECTION 2: INTRODUCTION ................................................................................................. 5
       Background of survey ...................................................................................................... 5
       Problem statement .......................................................................................................... 5
       Development of research questions.................................................................................... 6
SECTION 3: METHODOLOGY .................................................................................................. 7
       Target population and sample ........................................................................................... 7
       Method of data collection .................................................................................................. 7
       Sampling technique ......................................................................................................... 8
       Terms and definition ........................................................................................................ 8
       Method of data analysis .................................................................................................... 9
SECTION 4: MAIN FINDINGS ................................................................................................11
       Users of smartphone rose to 75.9% in 2017 ......................................................................11
       68.3% of smartphone users have been using smartphones for more than 2 years ..................... 12

       Ownership of smartphones ............................................................................................................... 13

       Feature phone continues to meet needs of certain segment of users ........................................... 17

       Internet-on-the-go............................................................................................................................ 19

       What people do on their smartphones? ........................................................................................... 20

       Approximately 28.4% of smartphone users made online purchases ............................................. 24

       Issues on Mobile Content Services and SIM card registration........................................................ 26

       Awareness on Klik Dengan Bijak campaign ..................................................................................... 30

       Postpaid and prepaid users .............................................................................................................. 31

       Managing mobile privacy .................................................................................................................. 33

       Hand phone users behaviour ............................................................................................................ 35
SECTION 5: RESPONDENTS’ DEMOGRAPHIC.........................................................................40

       Gender ............................................................................................................................................... 41

       Age group .......................................................................................................................................... 41

       Mobile-cellular telephone penetration rate by state........................................................................ 42

       Urban-rural distribution .................................................................................................................... 43

       Income category ............................................................................................................................... 44
SECTION 6: CONCLUSION ....................................................................................................45
SECTION 7: TABLES .............................................................................................................47
LIST OF TABLES AND FIGURES .............................................................................................57
LIST OF ABBREVIATIONS .....................................................................................................59

                                         HAND PHONE USERS SURVEY 2017                                                               P a g e 2 | 61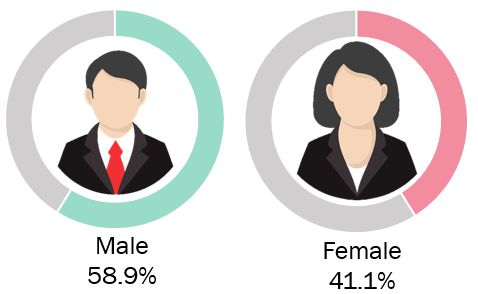
SECTION
 SECTION1: 1:
           EXECUTIVE SUMMARY
              EXECUTIVE SUMMARY

The Hand Phone Users Survey 2017 (HPUS 2017) is an annual survey
conducted by Malaysian Communications and Multimedia             Commission
(MCMC). HPUS 2017 provides information on the characteristics and
behaviours of hand phone users in Malaysia, as well as analysis to gauge
changes in terms of users’ behaviour and trends.

MCMC interviewed 2401 respondents through Computer Assisted Telephone
Interview (CATI) system. The survey sourced on selected key indicators span
from types of hand phone (i.e. basic phone, feature phone and smartphone),
online activities of smartphone users, measures taken to protect personal
data, concern on data privacy, level of trust on personal data kept by service
providers, dependency and behaviour of hand phone users, awareness on ‘Klik
Dengan Bijak (KDB)’ campaign, issues on Mobile Content Service (MCS) and
level of difficulty of SIM card registration process.

The survey draws attention to the following key themes and highlights covered
by the data:

   •   Users of smartphone continue to rise – Smartphone penetration
       rates grew by 7.2% from 68.7% in 2016 to 75.9% in 2017.

   •   Feature phone continues to meet needs of certain segment of
       users – Despite percentage of feature phone users has decreased from
       53.0% in 2016 to 31.0% in 2017, feature phone are still in demand
       especially for users from low income group with household income of
       RM 1,000 and below, foreign workers, as well as users aged 65 years
       old and above.

   •   Rising access to Internet via smartphones – Based on HPUS
       conducted since 2012, the percentage of smartphone users who used
       their phones for Internet access rose by 26.0%.

                        HAND PHONE USERS SURVEY 2017            P a g e 3 | 61
•   Using smartphones for e-Commerce gaining momentum –
    Approximately 28.4% smartphone users made online purchases with
    majority of them (69.5%) making purchases via mobile Apps.

•   Improved awareness to protect personal data among Malaysians
    – 64.5% of users were vigilant in protecting their hand phone using
    passwords compared to 53.8% in HPUS 2015 while 44.5% backed up
    their photos and contacts on their hand phone compared with 39.2% in
    HPUS 2015.

•   High dependency on hand phone were observed particularly
    among the youngsters – More than 80% of the youngsters felt
    anxious and would go back if they ever left their phone, waking up in
    the middle of the night to check their smartphone, and could not last an
    hour to check their phone after waking up.

                   HAND PHONE USERS SURVEY 2017               P a g e 4 | 61
SECTION
SECTION 2: 2: INTRODUCTION
INTRODUCTION
Background
Backgroundofofsurvey
survey
The Hand Phone Users Survey 2017 (HPUS 2017) is a twelfth series of purpose
built survey conducted by MCMC. This is in line with MCMC regulation goal to
conduct market research whereby to collect descriptive statistics pertaining to
characteristics and behaviours of hand phone users in Malaysia.
Problem
Problemstatement
statement
HPUS is an annual survey conducted by MCMC since 2004 aimed to collect
data pertaining to usage, behaviour and preferences of hand phone users in
Malaysia. These data cannot be obtained through administrative data
collection. For the purpose of this study, hand phone includes basic phone,
feature phone and smartphone.
Over the past decade, hand phone was just merely a tool for communications.
As technology evolved, the device has become more integral to people’s life
as it supports more services such as, computing access to the Internet and
video streaming. Accordingly, the collection of data, in particular, the trends
data may vary over time, as stakeholders commonly shift their focus and
demand. Therefore, the survey should maintain its flexibility to adapt to
evolving technology and needs of stakeholders.
Thus, HPUS intends to provide comprehensive and objective quantitative
assessment for MCMC’s internal and external stakeholders to facilitate
developing relevant policies and strategies in their respective areas.
HAND PHONE USERS SURVEY 2017 P a g e 5 | 61Development
Developmentofofresearch
researchquestions
questions
HPUS is a study to describe characteristics and behaviour of hand phone users in
Malaysia. Based on current issues and trends of hand phone usage, several
research questions have been identified and developed as illustrated in table
below:
Table 1: Development of research questions
Scope Indicators Research Questions
What is the growth of
% of smartphone
smartphone as compared to
and feature phone
Usage and feature phone users?
users
1 ownership of Does feature phone still serve
% of smartphone
hand phone users’ needs?
and feature phone
What is the preferred device to
ownership
access the Internet?
Time series analysis What activities on smartphone
Activities on
2 of activities on which had gained or lost
smartphone
smartphone popularity?
Measures taken to What are users concerns in the
protect personal event of losing their phone?
data What are the step taken by
Protection of Concern on data hand phone users to protect
3
personal data privacy their personal data?
Level of trust on Do hand phone users trust their
personal data kept service provider to keep their
by service providers personal data?
Dependency on
Behaviour of
hand phone Which age group posed high
4 hand phone
Hand phone dependency on their phone?
users
behaviour
Awareness on “Klik
Regulatory What is the level of awareness
Dengan Bijak”
measures/ of MCMC’s various initiatives
Issues on Mobile
5 initiatives for among hand phone users?
Content Services
consumer
SIM Card
protection
registration
HAND PHONE USERS SURVEY 2017 P a g e 6 | 61SECTION
SECTION 3: 3: METHODOLOGY
METHODOLOGY
Target
Targetpopulation
populationand
andsample
sample
The sample population was drawn from the main users of hand phones with
Mobile Station International Subscriber Directory Number (MSISDN) identical
to randomly generated numbers. They were the main users of prefix number
010, 011, 012, 013, 014, 016, 017, 018 and 019 networks. Both segments of
postpaid and prepaid users were covered. The definitions of terminologies
adopted in this survey were referenced to the international standards and
existing frameworks. At the end of 2017, there were 42.3 million mobile-
cellular subscriptions with a penetration rate of 131.2% to a population of
32.3 million.
Method
Methodofofdata
datacollection
collection
Fieldwork for this survey started on 9 August 2017 and ended on 7 September
2017. The survey was canvassed using a Computer Assisted Telephone
Interview (CATI) system operating from MCMC CATI Centre in Cyberjaya. The
questionnaire was administered by CATI. Trained interviewers called main
users of randomly selected hand phone numbers to seek their co-operation.
Responses given to pre-coded questions were clicked in, while open-ended
responses were typed in. The survey reached a sample of 2,401 hand phone
users.
HAND PHONE USERS SURVEY 2017 P a g e 7 | 61Sampling
Samplingtechnique
technique
The survey adopted confidence level of 95% and precision of ±2%. There was
only one stage of sample selection as the survey adopted a simple random
sample (SRS) approach. Sampling was done across networks with probability
proportional to size of the networks in terms of subscriptions.
Termsand
Terms anddefinition
definition
Basic phones1
Basic phone also called ‘low-end’ phones - are devices with limited feature
sets, limited or no factory-installed or user-installable value added third party
applications, and no or very limited data connectivity. The ‘basic’- or ‘low-end’
- appellation is a throwback to the early days of the emergence of GSM mobile
technology, where only basic functionality - such as call functions, SMS,
Unstructured Supplementary Service Data (USSD) v1 functionality, and a
phonebook - were needed (and available) to communicate.
Feature phones2
Feature phone has limited functionality and proprietary operating systems
such as Bluetooth, WAP-based phone browsers and ability to install and run
Java applets and applications and a camera. This device primarily use
narrowband 2G EDGE/EDGE+ speeds for mobile data access. Several feature
phone produced support of 3G network.
1
Source: Mobile Handset Use in Digital Financial Services (03/2017), ITU
2
ibid
HAND PHONE USERS SURVEY 2017 P a g e 8 | 61Smartphones3
A mobile handset that is used as the person’s primary phone device which has
capabilities to perform Internet-based services and function like a computer,
including having an operating system capable of downloading and running
applications, also those created by third-party developers.
Methodofofdata
Method dataanalysis
analysis
Types of data
HPUS 2017 distinguishes between annual core data, which are covered yearly
for time series analysis and trends data on topical hand phone behaviours
peculiar during the survey period. Specific requests from internal stakeholders
were taken into account during the process of developing the survey’s
questionnaires. Table 2 illustrates the core and trends data captured in HPUS
2017:
Table 2: Types of data
Trend Data Core data
1. Smartphone and feature phone users 1. Gender
2. Postpaid and prepaid users 2. Age group
3. Mobile Content Services 3. Income category
4. e-Commerce 4. Educational attainment
5. Managing mobile privacy 5. Urban-rural distribution
6. Behaviours of hand phone users
7. Awareness on “Klik Dengan Bijak (KDB)”
campaign
Data Analysis
Basic frequency count was computed to assess the results pattern. Cross-
tabulation between relevant indicators was done to identify significant
3
Source: International Telecommunication Union (ITU), 5th Meeting of the Expert Group on ICT Household
Indicators (EGH)
HAND PHONE USERS SURVEY 2017 P a g e 9 | 61relationships that would deduce meaningful inferences pertinent to the
objectives.
Important findings were featured in the form of a report complemented with
supporting charts and tables for the convenience of readers. Time series
analysis was established in demographics and socio-economic tracking whilst
the findings on current trends were analysed against evolutions that took
place around the world. Information from external sources was also included
as supplementary data to support any findings.
The data has been weighted to match nationality (Malaysian and non-
Malaysian) and ethnicity distribution, where the mid-year population
estimates from DOSM serves as the auxiliary information as follows:
Table 3: Mid-year population estimates 20174
Background characteristic Percent
Nationality
Malaysian 89.6
Malay 50.0
Chinese 20.8
Other Bumiputera* 11.7
Indian 6.2
Others 1.0
Non-Malaysian 10.4
*Other Bumiputera includes Bumiputera Sabah/Sarawak and Orang Asli
Finally, full results of the survey were appended in the form of percentage
tables at the end of the report.
4
Current Population Estimates, DOSM , 2017
HAND PHONE USERS SURVEY 2017 P a g e 10 | 61SECTION4:4:
SECTION MAIN
MAIN FINDINGS
FINDINGS
Users
Usersofofsmartphone
smartphonerose
rosetoto75.9%
75.9%in
in 2017
2017
Smartphone has rapidly become the preference device for most Malaysian to
remain connected. According to the survey, percentage of smartphone users
continue to rise from 68.7% in 2016 to 75.9% in 2017. Driving factors include
inexpensive devices, subsidies, aggressive campaigns and promotions by
service providers, affordable voice-data packages, increasing use of and
reliance on smartphones-based applications etc. are among key factors
contributed to the growth.
The finding is in line with report by Growth from Knowledge (GfK) Cooperation
anticipating strongest regional growth of smartphones demand in 2017, with
Malaysia and Bangladesh contributing most to this growth5. On the other
hand, the survey revealed that feature phone users dropped by 22.0% from
53.0% in 2016 to 31.0% in 2017.
Feature phone users Smartphone users
Figure 1: Percentage distribution of smartphone versus feature phone share, 2016
and 2017
5
Lucy Green (July 24, 2017), Global smartphones demand peaks alongside a leap in average sales price in 2Q17.
Retrieved from http://www.gfk.com/insights/press-release/global-samrtphones-demand-peaks-alongside-a-leap-in-
average-sales-price-in-2q17/
HAND PHONE USERS SURVEY 2017 P a g e 11 | 61Table 36 below shows percentage distribution of smartphones and feature
phones users from 2010 to 2017:
Table 4: Percentage distribution of hand phone users by type of phone
2010 2011 2012 2013 2014 2015 2016 2017
Smartphones 14.0 12.0 26.0 37.4 53.4 52.3 68.7 75.9
Feature phones 86.0 87.3 74.0 61.8 46.4 47.6 53.0 31.0
Don’t Know - 0.7 - 0.8 0.2 0.1 - -
68.3%
68.3% of
of smartphone have been
smartphone users have beenusing
usingsmartphones
smartphonesfor
for more
more than
than 2 2
years
years
Less than 1 year
1 - 2 years
13.4%
2 - 4 years
4 years and above 18.3%
47.2%
21.1%
Figure 2: Percentage distribution on the number of years using smartphones
6
From 2010 – 2015, the percentage were mutually exclusive, whereby respondent were asked on the type of hand
phone that they are using to answer the survey. (i.e feature phone or smartphone). Question: “The hand phone that
you are using now to answer is..”
Meanwhile, on 2016-2017, the percentage were not mutually exclusive, where by respondent were asked on the
type of hand phone that they are using. Question: “Do you use feature phone?” and “Do you use smartphone?”
HAND PHONE USERS SURVEY 2017 P a g e 12 | 61The survey found that nearly 7 out of 10 (68.3%) smartphone users are
holding onto their smartphones for more than 2 years. Of which, 47.2%
mentioned that they have been using their smartphone over the last 4 years,
followed by 21.1% already used it from 2 to 4 years. Meanwhile, only 13.4%
claimed they have been using it less than 1 year. Different scenario can be
observed in United States and European Countries, where on average their
consumers kept their smartphone for at least 2 years before upgrading it7.
Ownershipofofsmartphones
Ownership smartphones
In line with International Telecommunication Union (ITU) data collection,
HPUS 2017 also introduced a new question pertaining to the ownership of
smartphone. Figure 3 shows that among hand phone users, 75.9% are
smartphones users, while 74.0% are smartphone owners. The ownership8 is
especially high among younger people and those with relatively high income
and education levels (Figure 4 -6).
Figure 3: Smartphone users and ownership
7
Kantar Worldpanel Comtech (February, 2017), “An Incredible Decade For The Smartphone: What's Next?”
8
Based on Measuring the Information Society Report 2016 (MISR 2016), ITU have differentiate data collection on
mobile-cellular use and ownership. (Use: Proportion of individuals who used a mobile cellular, Own: An individual
who owns a mobile cellular if he/she has a mobile-cellular with at least one active SIM card for personal use)
HAND PHONE USERS SURVEY 2017 P a g e 13 | 61Smartphone Owners
100.0 Adoption
86.9 84.8
80.0
68.0
% 60.0 53.5
40.0
28.6
20.0
0.0
Below 20 20 - 34 35 - 49 50 - 64 65 and above
Figure 4: Percentage distribution of smartphone owners by age group (bar chart)
and adoption rate of smartphone owners by age group (line graph)
100.0 Smartphone Owners
92.8
87.1 Adoption
75.8
80.0
70.5
60.0 55.4
%
40.0
20.0
0.0
RM 5000 and RM 3,000 - RM RM 1,000 - RM RM 1,000 and Dependent
above 5,000 3,000 below
Figure 5: Percentage distribution of smartphone owners by income category (bar
chart) and adoption rate of smartphone owners by income category (line graph)
HAND PHONE USERS SURVEY 2017 P a g e 14 | 61100.0 Smartphone Owners
Adoption
93.8
80.0 71.2
80.1
60.0
47.5
% 42.9
40.0
26.7
20.0
0.0
Tertiary Post-Secondary Secondary Primary Others None
Figure 6: Percentage distribution of smartphone owners by highest educational
attainment (bar chart) and adoption rate of smartphone owners by highest
educational attainment (line graph)
Further, the survey also explored how many smartphones does respondents
owned and the underlying factors of those who owned more than one
smartphones. Based on Figure 7, result shows that 77.2% of smartphones
owners are most likely to own only one smartphone. This is followed by 17.7%
owning two and the remaining 5.1% respondents claimed to own three or
more smartphones.
Figure 7: Percentage distribution of total smartphone owned by respondent
HAND PHONE USERS SURVEY 2017 P a g e 15 | 61For those who owned more than one smartphone, 54.9% of respondents
claimed the reason is to separate between personal and office use, 40.9%
respondents used multiple smartphones as backup and 22.7% said that the
purpose of having additional devices is to access the Internet without any data
plan subscription. Whilst some respondents need for travelling purposes, child
use, coverage and battery life.
Figure 8: Percentage distribution of respondent who owned more than 1
smartphone9
9
Question asked to respondent who owned more than 1 smartphone
HAND PHONE USERS SURVEY 2017 P a g e 16 | 61Feature
Feature phone
phone continues
continues to meet
to meet needs
needs of certain
of certain segment
segment of
of users users
The benefits of feature phone are still in demand for quite a number of people,
especially among respondents in the low income group with household income
of RM1,000 and below (47.6%), including foreign workers (43.8%) as well as
users aged 65 years old and above (73.7%) (Figure 9).
Feature phone users by income category Feature phone users by nationality
43.8%
Dependent 31.6%
RM 1,000 and
below 47.6% 29.5%
RM 1,000 - RM
3,000 32.0%
RM 3,000 - RM
5,000 20.9%
RM 5000 and
above 6.1%
Malaysian Non Malaysian
Feature phone users by age group
73.7%
51.0%
38.3%
21.0%
12.4%
Below 20 20 - 34 35 - 49 50 - 64 65 and above
Figure 9: Feature phone users by demographic
HAND PHONE USERS SURVEY 2017 P a g e 17 | 61Figure 10: Percentage distribution on reason of still using feature phone
Note: 11.0% reported “others” which includes battery factor, features factor and lack of skills on using smartphones
This survey further examined the respondents’ reasons for not using
smartphones10. Firstly, majority of feature phone users (81.6%) said that the
device serves their needs. Secondly, 26.5% of them claimed that smartphone
is expensive, and thirdly, they are concerned on the impact of smartphones
that can lead to addiction. We also asked the feature phone users if they have
any intention to migrate to smartphone. Based on Figure 11, close to two
thirds or 63.2% of the feature phone users claimed that they have no intention
to change to smartphone.
Figure 11: Willingness to migrate to smartphone
10
This part of the survey only include for respondents who used feature phone only and do not use any smartphones.
24.2% of respondents not using smartphones (users of feature phones only)
HAND PHONE USERS SURVEY 2017 P a g e 18 | 61Internet-on-the-go
Internet-on-the-go
Based on HPUS conducted since 2012, the percentage of smartphone users
who use their phones for Internet access rose by 26%. Similarly, our Internet
Users Survey 2017 (IUS 2017) also recorded high proportion of Internet users
accessing the Internet while on-the-go (84.0%)11. In 2017, 94.8% of
smartphone users are using their phones to go online.
Table 5: Percentage distribution of Internet access using smartphone by users
2012 2013 2014 2015 2017
Access Internet using smartphone 68.8 78.5 90.1 92.4 94.8
(%)
Do not access Internet through 31.2 21.5 9.9 7.6 5.2
smartphone (%)
On the other hand, Figure 12 shows that 20.6% of feature phone users access
Internet using their phone. Among them, 61.3% users were able to access 3G
network12 on their feature phone. Meanwhile, 33.3% said their phones have
no capability to access 3G as their device only support 2G network (basic
phone). However, it should be noted that 2G network still serves the rakyat
as almost one third of respondents are still using 2G hand phones.
Some countries like Singapore13, Taiwan14 and Australia15 have already
terminated 2G technologies to refarm spectrum for 4G-LTE networks.
11
MCMC Internet Users Survey 2017: Device and Place to access Internet
12
Guideline was given to respondent to identify the capability: “ Feature phone that capable to access the 3G
network will display 3G/H+ on top left/ right on home screen phone”
13
Chang V (March 2017), “All you need to know about 2G network shutdown”. Retrieved from
http://www.straitstimes.com/tech/smartphones/all-you-need-to-know-about-the-2g-network-shutdown
14
Shan S (March 2017), “Government aims to end all 2G services by August”. Retrieved from
http://www.taipeitimes.com/News/taiwan/archives/2017/03/20/2003667125
15
Johnston R (December 2016), “Telstra’s 2G Network is Officially No More: What you need to do”. Retrieved
from https://www.gizmodo.com.au/2016/12/telstras-2g-network-is-officially-no-more-what-you-need-to-do/
HAND PHONE USERS SURVEY 2017 P a g e 19 | 61Figure 12: Percentage distribution of feature phones that are capable to access 3G
Whatpeople
What peopledodoon
ontheir
theirsmartphones?
smartphones?
Mobile devices, in particular smartphones are becoming part of our lifestyle,
not just for communications but also as a platform for getting information,
socializing, entertainment and performing banking activities.
Figure 13: Percentage distribution of smartphone Internet activities by users
HAND PHONE USERS SURVEY 2017 P a g e 20 | 61Communication continue to be the number-one activity among smartphones
users. Majority or 98.5% of them are using their device for text messaging
and voice over-the-top (OTT) services, such as WhatsApp, WeChat, Facebook
Messenger, Viber etc, which is slightly higher compared with HPUS 2015
(96.0%). Of which, 90.7% of them claimed to perform this activity at least
once a day. Apart from texting, 93.8% of respondents communicate through
voice calls but not many of them do it on daily basis when compared with
texting activity (65.1%).
Text Messaging and Voice Note 90.7 8.2 0.2
Voice calls 65.1 30.1 4.4 0.4
Video calls 24.8 39.1 29.4 6.7
Send or receive emails 44.3 31.5 20.7 3.5
Social networking 85.1 12.3 1.9 0.7
Searching/browsing the Internet 72.9 22.4 4.3 0.4
Banking 12.8 37.7 46.9 2.6
Entertainment 60.8 31.3 7.8 0.1
Reading 58.5 31.8 9.0 0.7
Get directions 17.7 33.7 40.1 8.6
View and manage security camera 50.0 26.1 22.5 1.4
0.010.0 20.0 30.0 40.0 50.0 60.0 70.0 80.0 90.0 100.0
%
At least once a day At least once a week At least once a month At least once a year
Figure 14: Percentage distribution of frequency of Internet activities by smartphone
users
Furthermore, a growing number of smartphones with front-facing camera has
made video calling easy to be used at anytime and anywhere. In addition,
availability of video calling feature on various communications applications
such as Apple’s FaceTime, Skype, WhatsApp, WeChat etc. combining with
HAND PHONE USERS SURVEY 2017 P a g e 21 | 61affordable data package has encouraged more people to communicate via this
platform. The survey found that 53.4% of respondents use their smartphones
for video calling, with 24.8% of them using it at least once a day.
Email continues to be used, with 60.0% of respondents using it with 44.3%
of them send and receive emails on daily basis.
Social networking media such as Facebook, Twitter, Instagram, LinkedIn, etc.
continue to be major platforms connecting friends, families and colleagues.
The usage of smartphone for social networking activities continue to increase
from 87.9% in 2015 to 88.1% in 2017.
Despite showing a slight decrease, searching and browsing the Internet are
still popular activity among smartphone users, with 87.5% claimed to perform
this activity compared with 90.0% recorded in HPUS 2015.
Smartphone is becoming a portable entertainment device and widely used for
watching videos or movies, play games and listen to music. The survey shows
that 83.7% of respondents used their smartphone for entertainment activities
where 60.8% of them do it at least once a day. The wider LTE coverage and
affordable data packages have made it possible for users. As at 2016,
percentage of the population covered by LTE mobile network in Malaysia
increased to 88.0% from 71.0% recorded in 2015.
This survey also found that lesser smartphone users or 49.7% used their
device for reading activity such as newspaper, iBook, online journal etc.
compared with 55.6% in HPUS 2015.
Smartphone also serves as important tool for direction finding. Navigation
applications such as Waze, GoogleMap, Apple Maps etc. are easily available
on almost all type of smartphone. As such, 74.0% of respondents claimed of
using these applications on their smartphones. Of which, 17.7% of them use
it on daily basis while 33.7% use it at least once a week and 40.1% at least
once a month.
HAND PHONE USERS SURVEY 2017 P a g e 22 | 61Banking-related activities such as bill payment, money transfer and checking
of bank balance via smartphone have yet to completely take off among
smartphone users. Nonetheless, there was a slight increase by 7.4% as
reported in HPUS 2017 to 37.5% in this survey.
Nonetheless, monitoring homes or business remotely via closed-circuit
television (CCTV) in particular for security reason has dropped from 11.5% in
2015 to 8.2% in 2017. The decline might be due to availability of more
integrated security solutions offered in the market, where consumers just
need to subscribe to the ‘security as a service’ from solution providers. The
emergence of Internet of Things (IoT) and cloud technologies allow disparate
devices such as CCTV, smoke detectors, access control panels, sensors etc.
are combined into one integrated solution. By subscribing to this service,
larger volumes of data can be stored securely at dedicated server facilities,
allowing users to archive video, audio and associated data for longer period
and improve its accessibility using various devices.
HAND PHONE USERS SURVEY 2017 P a g e 23 | 61Approximately
Approximately28.4%
28.4%of
ofsmartphone
smartphoneusers
users made
madeonline
onlinepurchases
purchases
We also introduced questions on online shopping in HPUS 2017 to capture
data and gauge e-Commerce activities amongst smartphone users. It was
noted that nearly 3 out of 10 smartphone users (28.4%) made online
purchases with majority of them (69.5%) making purchases via mobile Apps.
This trend is higher particularly amongst young adults aged between 20 - 34
years old.
40.0%
30.9%
30.0%
23.7%
20.0% 17.0%
10.0% 6.4%
0.0%
0.0%
Below 20 20 - 34 35 - 49 50 - 64 65 and
above
Figure 15: Percentage distribution of smartphone users performed e-Commerce
activities
In terms of frequency of purchasing products or services online, 54.9% of
smartphone users who conduct online purchasing claimed doing it at least
HAND PHONE USERS SURVEY 2017 P a g e 24 | 61once a month, while 32.8% said once a year. Only 11.1% purchased at least
once a week and 1.2% purchased daily.
Frequency of smartphone users performing Quality of Internet while
e-Commerce activities purchasing/ordering
Very Excellent
60.0 54.9 Bad
good 4.3% 3.4%
10.3%
40.0
32.8 Fair
33.3%
%
20.0
11.1 Good
48.7%
1.2
0.0
At least once At least once At least once At least once
a day a week a month a year
Figure 16: Frequency of smartphone users performing e-Commerce activities and
quality of Internet while purchasing/ordering
Further, smartphone users who made online purchasing were asked about
their perception on quality of the Internet while they made online purchasing.
On average, the data suggests that users are satisfied with quality of the
Internet, with 48.7% rate the quality as good followed by one third (33.3%)
claimed the quality of Internet to be fair. About 10.3% claimed as very good
while 4.3% said it is excellent. Only 3.4% rate the quality of Internet as bad
while performing online purchases.
HAND PHONE USERS SURVEY 2017 P a g e 25 | 61Issues
Issueson
onMobile
MobileContent
ContentServices
Servicesand
andSIM
SIM card
card registration
registration
HPUS 2017 also includes Mobile Content Services (MCS) 16 and Subscriber
Identity Module (SIM) card registration. Under MCS section, the survey
measures percentage of respondents subscribed to MCS, experience whereby
their credit/bill being charged on MCS without their consent as well as their
opinion on the relevancy of MCS. Meanwhile, in SIM Card Registration section,
the survey focused on the level of difficulty on the process of SIM card
registration in Malaysia.
Mobile
MobileContent Services
Content Services
According to the Communications and Multimedia Consumer Forum of
Malaysia (CFM), there has been a notable increase in the number of complaints
over unsolicited or spam Short Message Service (SMS) in Malaysia in 201517.
The survey found that 16.6% of hand phone users had subscribed or are
subscribing to MCS with 50.8% on games, 50.3% on ringtones and 21.9% on
wallpaper. A small number of respondents or 3.6% subscribed to sports,
quizzes, fitness program and celebrity photos.
Figure 17: Percentage distribution of MCS subscribers by users
16
Mobile Content Services (MCS) has been defined in the Mandatory Standards for the Provision of Mobile Content
Services, effective 1 July 2010, as any messaging service which provides content and is accessible on a mobile access
device or fixed access device, for which charges may be imposed over and above the standard network charges of
the relevant service provider. Source: MCMC
17
Digital News Asia (November 2015), “Spam SMS on the rise in Malaysia, CFM steps in”. Retrieved from
https://www.digitalnewsasia.com/spam-sms-rise-malaysia-cfm-steps
HAND PHONE USERS SURVEY 2017 P a g e 26 | 61In view of consumers’ welfare and rights, concern arises on the issue of
sending unnecessary paid messages to unsuspecting mobile users. The
Mandatory Standard (MS) for the Provision of MCS issued by MCMC took effect
in July 2010. The MS are aimed at providing a balanced regulatory framework
that can safeguard consumers interests by promoting responsible service
provisioning as well as laying the foundation for a continued growth of mobile
content industry18.
This survey further prompted the MCS subscribers on their experience being
charged without consent. When asked about their experience being charged
without their consent, 33.1% claimed to have been a victim. Of which, 38.4%
of them mentioned the incident happened before 2015, followed by 22.9%
and 20.9% in 2016 and 2017, respectively. The declining trends might be due
to the extensive use of smartphone, whereby games, ringtone etc. can be
downloaded free of charge or are built into the device.
Have you had any experience whereby your When did it happen?
credit / bill being charged on Mobile Content
Services without consent?
38.4%
Don't
know
3.5% 22.9% 20.9%
Yes
33.1% 12.6%
No 5.1%
63.4%
Before 2015 2016 2017 Not
2015 sure
Figure 18: Percentage distribution of MCS subscribers being charged without
consent
18
Convergence, Communications and Multimedia Policy and Regulatory Guide
HAND PHONE USERS SURVEY 2017 P a g e 27 | 61The number of applications that are available in the market today has grown
tremendously, from social networking, news, information and entertainment
can be downloaded for free. Thus, the survey further gathered opinion of hand
phone users whether MCS is still relevant. Based on Figure 19, it shows that
the percentage of MCS subscribers who personally thought that MCS is
relevant is almost equal with those who thought it is irrelevant (47.5% and
47.9%). Among those who said “No”, five-in-ten hand phone users mentioned
that content can be downloaded via Internet, followed by 35.8% claimed that
the content is not interesting and 32.2% said that it is no longer a trend.
Content can be downloaded
50.4%
via Internet
The content is not
Yes No 35.8%
interesting
47.5% 47.9%
Wide use of mobile apps 32.9%
It is no longer a trend 32.2%
Dont
know
4.6% Others 21.9%
Figure 19: Percentage distribution of users by opinion on the relevancy of MCS
SIM
SIMCard registration
card registration process
process
This part of the survey intends to gather opinion from hand phone users
pertaining to the process of SIM card registration.
The process of SIM card registration in Malaysia is not complicated. To
register, the users are required to visit their service providers’ service center,
authorized agent or dealers with their mobile phone and identity card/passport
for verification. Users are required to be personally present for registration;
registration by proxy is not allowed. Registration will be done electronically
HAND PHONE USERS SURVEY 2017 P a g e 28 | 61using either MyKad reader, Optical Character Recognition, Biometric Reader
or any other automated platform as approved by the MCMC.
Results revealed that nearly 6 out of 10 (59.3%) hand phone users said the
process was easy for them. Meanwhile, 17.8% considered the process as “very
easy” and less than 10.0% said it was difficult. Nonetheless, the current
process has caused a number of false registration incidents which led to
security and data integrity issues. The verification exercise by MCMC which
began in April 2017 and concluded at the end of May 2017 revealed, a total
of 708,392 numbers were found to be unmatched.
Figure 20: Percentage distribution of users by level of difficulty of SIM card
registration
MCMC in collaboration with service providers had established an Industry Task
Force for Data Verification, which aims to verify the integrity of prepaid
subscriber’s database and to rectify unmatched data from service provider’s
database.
As a result, MCMC had reviewed the Guidelines on Registration of End-Users
of Prepaid Public Cellular Service, to further enhance the registration process
and ensure that the interest and rights of consumers are being protected and
looked after. The new guideline on prepaid registration issued by MCMC on
June,1 2017 and took effect on January 1, 2018.
HAND PHONE USERS SURVEY 2017 P a g e 29 | 61Awareness
Awarenesson
onKlik
KlikDengan
DenganBijak
Bijakcampaign
campaign
The evolution of technology has slowly taken an essential part in people’s daily
life. However, without proper use, it may be abused. Thus, it is very important
to ensure the public use the Internet wisely. Klik Dengan Bijak (KDB)
campaign is one of the proactive actions taken by MCMC in order to initiate a
Public Awareness on Internet Safety campaign aimed for safety, security and
responsibility:
SAFETY SECURITY RESPONSIBILITY
To educate the public to use To encourage people to be To promote a positive use
the internet in a secure cautious when interacting of networked media content
manner. online in the community
Source: www.klikdenganbijak.my
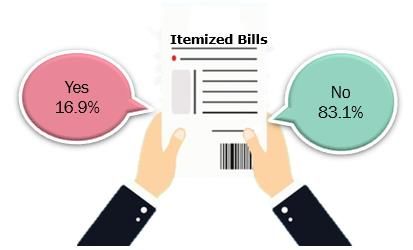
Thus, this segment attempts to identify the level of awareness among hand
phone users on the KDB programme. The survey showed that 18.6% of hand
phone users were aware of this programme. Among those who were aware,
38.5% had knowledge on the KDB programme.
Figure 21: Awareness and Knowledge on KDB Programme among hand phone users
HAND PHONE USERS SURVEY 2017 P a g e 30 | 61Postpaidand
Postpaid andprepaid
prepaidusers
users
According to Communications and Multimedia Pocket Book of Statistics 2017,
prepaid segment contributed the largest market share with 75.8%. In this
section, prepaid users were asked whether they are aware on availability of
itemized bills19. Majority (83.1%) of prepaid users do not know they can
request for itemized billing from their service providers.
Figure 22: Percentage distribution of prepaid users on awareness on itemized bills
for prepaid users
In terms of number of active SIM used by mobile phone users, the survey
suggests that majority of users continue to use only one SIM and multiple SIM
use is declining. Usage of one SIM increased to 68.0% as compared with
62.3% in HPUS 2014, up by 5.7 percentage points.
Meanwhile, for users with two SIMs, the percentage decreased by 3.6
percentage points during the same period. The same trend is seen for users
with three, four and five SIMs.
19
Awareness on itemized bills was only asked to prepaid users
HAND PHONE USERS SURVEY 2017 P a g e 31 | 6180
68.0
70
62.3 2014 2017
60
50
% 40
31.1
30 27.5
20
10 5.1 3.5
0.8 0.5 0.5 0.2 0.2 0.4
0
1 2 3 4 5 More than 5
Figure 23: Percentage distribution of users by number of active SIMs
Whether we are subscribing to postpaid or prepaid plans, keeping track on the
actual usage is very important. The survey further identified the monthly
expenses on hand phone users bills (Figure 24)20. More than half of hand
phone users spent less than RM50 for their bills. Meanwhile, 26.7% spent
between RM50 to RM100, 9.2% spent between RM100 to RM150, while 3.5%
spent between RM150 to RM200. Only 5.8% had bills RM200 and above.
100 2.1 6.2 6.0 5.8
8.7 7.4 3.3
3.6 4.8 3.2 3.5
4.9 9.7 9 9.2
10.2 8.6
80 11.4
27.5 28.4 29.8 31.6 26.7
60 33.9
%
40
51.3 53.4 50.6 50.3 54.9
20 41.1
0
2004 2005 2006 2008 2009 2017
Less than RM 50 RM 50 - RM 100 RM 100 - RM 150 RM 150 - RM 200 RM 200 and above
Figure 24: Percentage distribution of hand phone bills by users
20
The hand phone bills are inclusive of GST
HAND PHONE USERS SURVEY 2017 P a g e 32 | 61Managingmobile
Managing mobileprivacy
privacy
The survey also put an effort to understand concerns about breaching of
personal information in the event of lost or stolen phone. It is found that
“Losing Contact” (78.5%) and “No access to communication” (72.3%) were
the top two concerns raised by the respondents in the event of losing their
hand phones. Six out of ten users were concerned of misuse of their social
network or email identity by others (66.8%). Meanwhile, 45.3% feared that
their financials details would be stolen. Nonetheless, 2.7% have no concerns
to all of the above.
78.5% 72.3% 66.8% 66.3% 61.1% 45.3%
Account
Misuse of Cost and Personal
information
No access to identity (e.g. hassle (of photos or text
Contacts (e.g. bank or
communication email, social replacing the images
financial
network) phone)
account)
Figure 25: Percentage of users on mobile privacy concern
Note: 2.7% No worries
In addition, we also asked all smartphone users on steps taken to protect their
personal data. Comparison with previous HPUS surveys show that awareness
among consumers on the steps taken to protect their personal data have
improved significantly. For instance, 64.5% of users are vigilant in protecting
their hand phone using passwords compared to 53.8% in HPUS 2015, while
44.5% backed up their photos and contacts on their hand phone compared
with 39.2% in HPUS 2015.
HAND PHONE USERS SURVEY 2017 P a g e 33 | 612015 53.8% - - 39.2% 29.4% 33.7%
2017 64.5% 57.5% 54.1% 44.5% 42.8% 42.1%
Password Don’t use Don’t send or Back up Turn off the Clear
protect (e.g. untrusted access photo and location browsing or
pin, draw apps/ sensitive contacts tracking search
pattern, websites data from features history
fingerprint) hand phone
Figure 26: Percentage distribution of users on personal protection
Note: 19.0% do nothing
The survey further asked the hand phone users’ opinion whether their
personal data kept by their service provider is confidential, 52.7% of hand
phone users personally believe that service providers kept their data
confidential. Meanwhile, 21.7% mentioned that they did not feel that their
personal data is safe with the service providers.
Q: Do you think that your personal data is
kept confidential by service provider?
25.7%
Don’t know 52.7%
Yes
21.7%
No
Figure 27: Percentage distribution of users’ opinion on personal data kept by service
providers is confidential.
HAND PHONE USERS SURVEY 2017 P a g e 34 | 61Handphone
Hand phoneusers
usersbehaviour
behaviour
Few questions were asked related to users’ dependency on their hand phone.
Findings show at least 1 out of 4 hand phone users checked their phone
constantly, even with no notification (24.9%).
Figure 28: Percentage distribution of users on checking their phone in a day
More than three quarter of users, (77.3%) claimed they checked their hand
phones before going to bed, or in the middle of the night, potentially affecting
their sleep quality21. The survey also found that law-breaking behaviour of
using hand phone while driving was admitted by 21.5% of users, with higher
proportion of young adults aged 20 – 34 years old. Other than that, at least 5
in 10 hand phone users claimed they use their hand phone during meals
(57.6%) and 5.6% admitted to use their phone where phone is prohibited
such as at petrol station and cinema, particularly among youngsters (aged 20
years old and below).
21
The light affects the body’s production of the sleep hormone melatonin, which makes it harder to fall asleep.
Harvard Health Letter (May, 2012, Retrieved from https://www.health.harvard.edu/staying-healthy/blue-light-has-
a-dark-side
HAND PHONE USERS SURVEY 2017 P a g e 35 | 61% %
% %
Figure 29: Percentage distribution of users using their phone while doing other
activities
Further questions were asked on time taken to check their phone after waking
up. Survey found that 81.3% of hand phone users can’t last an hour to check
their phones after wake up. Meanwhile, less than 20.0% of hand phone users
took more than 1 hour before checking their hand phone after wake up22.
22
Note: 0.3% claimed they did not check at all
HAND PHONE USERS SURVEY 2017 P a g e 36 | 61Figure 30: Percentage distribution of users checking their phone after waking up
0.1 0.3 0.3 2.0
100
9.8 13.1
21.6
8.2 28.3
80 10.5
16.7 46.1
11.7
18.7 11.1
60
21.1
24.5 18.2
% 16.4 8.8
40 13.4 7.8
11.7 10.8
15.9 5.9
9.1 6.7 7.8
20
24.9 29.4
22.7 24.5 21.6
0
Below 20 20 - 34 35 - 49 50 - 64 65 and above
Immediately Within 5 minutes Within 15 minutes Within 30 minutes
Within an hour Longer than 1 hour Didn't check at all
Figure 31: Percentage distribution of users checking their phone after waking up by
age group
The survey further prompted on the first thing smartphone users do when
they check their hand phone after waking up. Majority of the respondents
(73.0%) claimed checking mobile messaging apps was the first thing they did
after waking up. Meanwhile, 7.3% visit their social network and 5.6% check
their missed calls. Less than 5.0% of respondents determine time using their
smartphone (3.4%) and check their email after waking up (3.1%).
HAND PHONE USERS SURVEY 2017 P a g e 37 | 6173.0%
80.0
60.0
40.0
20.0 7.3% 5.6% 3.4% 3.1%
0.0
Check mobile Visit social Checked Determine Check email
messaging network missed calls time
apps
Figure 32: Percentage distribution of smartphone users on the first thing they check
after waking up
Another trend behaviour this survey attempted to discover is users’
attachment to their hand phone where respondents were asked if they ever
turn back if they left their hand phones. Not surprisingly, the survey suggests
that users have a strong attachment to their hand phones; especially among
young adults with 85.8% of hand phone users would go back if they ever left
their phone. Only 14.2% say they will not do so.
Figure 33: Percentage distribution of users on turning back if they ever left their
phone
HAND PHONE USERS SURVEY 2017 P a g e 38 | 6113.1% 7.1%
13.9%
29.6%
45.1%
86.9% 92.9%
86.1%
70.4%
54.9%
Below 20 20 - 34 35 - 49 50 - 64 65 and above
Consider turning back Not consider turning back
Figure 34: Percentage distribution of users on consideration of turning back if they
ever left their phone, by age group
HAND PHONE USERS SURVEY 2017 P a g e 39 | 61SECTION5:5:RESPONDENTS’
SECTION RESPONDENTS’ DEMOGRAPHIC
DEMOGRAPHIC
This section provides an overview of the demographic characteristics and socio
economic profile of hand phone users. There are five (5) demographic
variables discussed in this section, namely; gender, age at the time of the
survey, residence, education level and income.
Table 6: Percentage distribution of hand phone users by basic
characteristics
Background characteristic Percent
Gender
Male 58.9
Female 41.1
Broad Age Group
Below 20 years old 10.1
20 – 34 years old 45.9
35 – 49 years old 26.4
50 – 64 years old 13.2
65 years old and above 4.5
Residence
Urban 59.9
Rural 40.1
Region *
Northern Region 19.4
Central Region 33.1
Southern Region 15.4
East Coast Region 13.4
Eastern Region 18.7
Educational Level **
Primary 11.6
Secondary 49.6
Post-secondary 7.3
Tertiary 28.9
*Northern Region includes Kedah, Perak, Perlis and Pulau Pinang; Central Region includes Negeri Sembilan, Selangor,
W.P. Kuala Lumpur and W.P. Putrajaya; Southern Region includes Johor and Melaka; East Coast Region includes
Kelantan, Pahang and Terengganu; Eastern Region includes Sabah, Sarawak and W.P. Labuan
**Individuals with formal education only. Primary: Primary school, Secondary: SPM/SPVM and Lower Secondary:
PT3/PMR, Post-Secondary: STPM/STAM/Certificate, Tertiary: Diploma, advanced diploma, degree and higher
HAND PHONE USERS SURVEY 2017 P a g e 40 | 61Gender
Gender
Figure 35: Percentage distribution by gender
Results revealed that male users have continued to outnumbered female
users. Males made up 58.9% while females account for 41.1%, a ratio of 1.43.
Hand phone usage by gender has recorded a stable trend throughout the year.
Table 7: Percentage distribution of hand phone users by gender
Gender 2011 2012 2013 2014 2015 2016 2017
Male (%) 55.2 56.5 57.6 56.9 56.9 56.9 58.9
Female (%) 44.8 43.5 42.4 43.1 43.1 43.1 41.1
Ratio 1.23 1.30 1.36 1.32 1.32 1.32 1.43
Agegroup
Age group
The HPUS 2017 results reflect the demographic profile of young adults, from
the age group of 20–24 with 18.4% users. The second largest group was 25–
29 which accounted for 14.2%. Meanwhile, the working age group (15-64
years old) represents 95.1%.
HAND PHONE USERS SURVEY 2017 P a g e 41 | 6120.0
18.4
15.0 14.2
13.2
10.9
9.7
% 10.0 8.9
6.5 6.5
4.5
5.0 3.8
2.9
0.4
0.0
Below 15 - 19 20 - 24 25 - 29 30 - 34 35 - 39 40 - 44 45 - 49 50 - 54 55 - 59 60 - 64 65 and
15 above
Figure 36: Percentage distribution of hand phone users by age category
Mobile-cellular
Mobile-cellulartelephone
telephonepenetration
penetrationrate
rateby
bystate
state
The percentage share of hand phone users’ base by state was used to estimate
mobile-cellular telephone penetration rate per 100 inhabitants by state. Table
8 below shows all states except W.P. Labuan have recoded penetration rate
above 100% in 2017.
Table 8: Mobile-cellular telephone penetration rate per 100 inhabitants
by state
State 2013 2014 2015 2016 2017 Trends
Johor 140.9 156.7 129.6 143.3 137.2
Kedah 137.0 121.9 142.0 120.1 101.6
Kelantan 127.9 117.5 159.6 119.6 121.5
Melaka 115.0 159.2 140.0 137.6 151.3
Negeri Sembilan 167.2 153.3 141.6 150.6 150.1
Pahang 130.0 148.3 160.9 127.0 109.0
Perak 122.4 149.2 120.9 124.1 133.4
Perlis 123.5 103.7 143.0 126.2 171.7
Pulau Pinang 162.2 143.8 146.8 146.6 127.9
Sabah 111.9 107.4 130.2 116.9 112.4
HAND PHONE USERS SURVEY 2017 P a g e 42 | 61State 2013 2014 2015 2016 2017 Trends
Sarawak 120.8 113.0 123.5 132.0 124.2
Selangor 164.5 156.1 157.2 164.7 138.2
Terengganu 141.7 156.5 165.5 132.7 133.1
WP Kuala Lumpur 231.2 220.8 205.0 206.0 185.7
WP Labuan 91.3 171.2 133.8 122.6 99.8
WP Putrajaya 103.3 191.3 210.0 150.2 112.4
Urban-ruraldistribution
Urban-rural distribution
The survey found that there is marginal disparity of hand phone users between
those who are living in urban and rural areas. The ratio of urban and rural
hand phone users is 1.5 to 1 in 2017.
70
60.1 62.3 61.3 59.9
60 57.7
50
39.9 42.3 40.1
37.7 38.7
40
%
30
20
10
0
2013 2014 2015 2016 2017
Urban Rural
Figure 37: Percentage distribution of the user by rural-urban dissection
HAND PHONE USERS SURVEY 2017 P a g e 43 | 61Income
Incomecategory
category
The highest percentage of income range for hand phone users remained at
RM 1,000 – RM 3,000 (39.3%). Meanwhile, the percentage of hand phone
users with income above RM 3,000 increased from 12.4% in 2015 to 17.7%
in 2017.
Table 9: Percentage distribution of hand phone users by monthly income
Income Category (%) 2012 2014 2015 2016 2017
Dependents 33.7 30.7 32.9 35.2 29.9
RM1,000 and below 19.6 17.4 19.8 15.2 12.9
RM1,000-RM3,000 36.5 36.6 34.9 32.6 39.3
RM3,000-RM5,000 7.2 10.1 8.6 10.2 11.3
RM 5,000 and above 3.0 5.2 3.8 6.8 6.4
Note: Income range includes lower boundary and dependents are those with no recurrent income.
HAND PHONE USERS SURVEY 2017 P a g e 44 | 61SECTION
SECTION 6:
6: CONCLUSION
CONCLUSION
Smartphone users have doubled during the past five years (2013: 37.4%,
2017: 75.9%). The growth was primarily contributed by extensive mobile
broadband coverage and intense competition, which has significantly dropped
the mobile broadband packages. For instance, entry-level package for prepaid
market dropped from RM28@1GB to RM20@1.5GB. Meanwhile for postpaid
market, the entry-level package dropped from RM28@1GB to RM28@3GB23.
In addition, smartphone prices have been made affordable by the service
providers’ innovative packages. Hence, it is encouraging hand phone users to
migrate to smartphone coupled with their demand for various digital services.
Wider adoption of smartphone in terms of usage as well as growing number
of mobile apps, e-commerce transactions will be conducted on the go via
smartphone. Thus, businesses should take this as an opportunity to leverage
on the mobile platform. Necessary adjustment is required in order for the
businesses to embrace this shift and remain competitive in the landscape of
digital economy.
On the other hand, more than half (63.2%) of feature phone users remain
loyal to their device as they have no intention to change to smartphone.
Majority of them claimed their phones serve their needs. Thus, it can be
deduced that 2G network is still needed to support basic and feature phone
users who are mainly from the low income group with household income of
RM1,000 and below (including foreign workers) as well as group of users aged
65 years old and above.
23
Comparison of entry level packages between Jan 2015 and Dec 2017
HAND PHONE USERS SURVEY 2017 P a g e 45 | 61You can also read