CLOUD PERFORMANCE BENCHMARK 2019 - 2020 Edition
←
→
Page content transcription
If your browser does not render page correctly, please read the page content below
CLOUD
PERFORMANCE
BENCHMARK

  2019 – 2020 Edition
2019/2020 EDITION

                                  CONTENTS
                                  3                    EXECUTIVE SUMMARY

                                  4METHODOLOGY

                                                       —
                                                  TE
                                  13               FINDINGS AND TAKEAWAYS

                                               U
                                           IB
                                  60   TR CONCLUSION AND RECOMMENDATIONS
                                        IS
                                       D
                                  T
                                  O
                              N
                        O
                   D
            —

2 | Cloud Performance Benchmark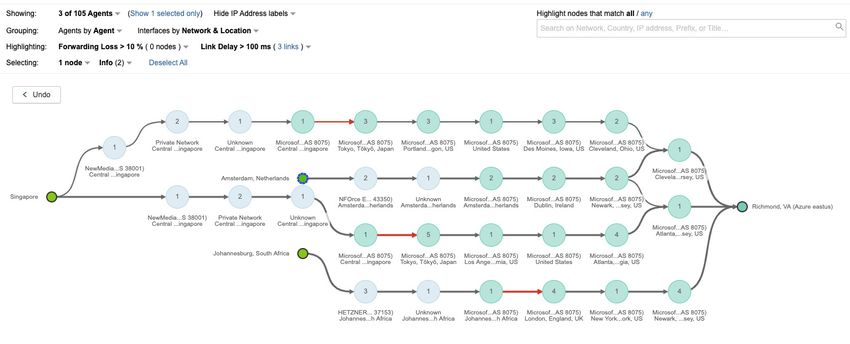
E XECU TI VE
                                              SUMMARY

                  The 2019 Cloud Performance Benchmark measures and compares network performance
                  between five top public cloud providers: Amazon Web Services (AWS), Microsoft Azure
                  (Azure), Google Cloud Platform (GCP), Alibaba Cloud and IBM Cloud. The measurements

                                                                                                   —
                  gathered benchmark the cloud providers against each other to discover what constitutes
                  average, normative and best-in-class network performance.

                                                                                        TE
                  As a follow-up to the inaugural 2018 study that covered AWS, Azure and GCP, the collected
                  2019 data makes comparisons with last year’s data to showcase what has and hasn’t

                                                                                  U
                  changed with network performance year over year. The 2019 report adds substantive new
                  findings on AWS’ Global Accelerator service offering, cloud connectivity in and out of China,

                                                                          IB
                  performance of US broadband provider connectivity to the cloud, and findings specific to the
                  newly added providers Alibaba Cloud and IBM Cloud.
                                                                TR
                  Enterprises making cloud choices rely heavily on comparative studies. Most previously
                  available studies on cloud providers focus on services offered, pricing tiers and global data
                                                         IS

                  center presence. However, performance studies of public cloud providers have historically
                                                   D

                  been missing in action. The few studies that existed lacked breadth of coverage, as well
                  as both depth and duration of metric data. The Cloud Performance Benchmark provides a
                  unique, unbiased third-party and metric-based perspective on public cloud performance as it
                                             T

                  relates to both end-user experience and back-end application architecture.
                                       O

                  For enterprises embracing digital transformation and venturing into the public cloud, the
                                  N

                  metrics and insights presented in the benchmark report will serve as a data-driven guide
                  to best practices and decision-making for operating in the cloud. The report reveals
                         O

                  comparable network performance data across all five public cloud providers. However,
                   D

                  significant anomalies exist and public cloud provider connectivity approaches vary
                  significantly, leading to geographical disparities in network performance and predictability.
            —

                  Ultimately, it is imperative for enterprise IT leaders to understand that cloud architectures
                  are complex and not to rely on network performance and connectivity assumptions or
                  instincts while designing them. Enterprises relying heavily on the public cloud or considering
                  a move to the cloud must arm themselves with the right data on an ongoing basis to guide
                  the planning and operational stages. Every organization is different, cloud architectures are
                  highly customized and hence these results must be reviewed through the lens of one’s own
                  business in choosing providers, regions and connectivity approaches.

3 | Cloud Performance Benchmark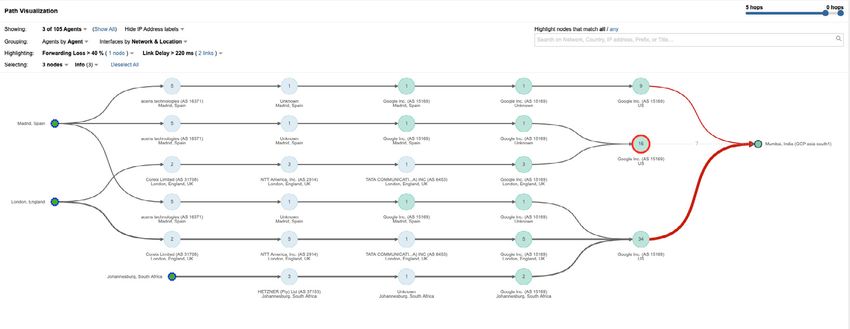
M E THOD OLOGY

    The findings presented in this report are based on data gathered from periodically monitoring bi-directional network
    performance such as latency, packet loss and jitter to, within and between multiple global regions of the five public cloud

                                                                                                   —
    providers over a four-week period.

                                                                                        TE
    Analysis of over 320M data points and in-depth path traces culminate as insights, trends and recommendations prescribed
    in this report. The insights uncovered in this report are categorized based on two guiding principles—the data collection
    methodology and common trends seen across the dataset. While the principles of data collection such as metrics gathered or

                                                                                   U
    frequency of testing remained consistent within the study, multiple test methodologies were deployed.

                                   End-User Measurements
                                                                           IB
                                                                 TR
                                   Network performance metrics gathered from global user location vantage
                                   points to global cloud regions across all five providers
                                                          IS
                                                     D

                                   Broadband ISP Measurements
                                   Network performance metrics to the five cloud providers’ hosting regions in
                                   North America from six broadband service providers in six US cities
                                              T
                                         O
                                   N

                                   Inter-AZ and Inter-Region Measurements
                                   Inter-AZ and Inter-Region performance within the same cloud provider
                           O
                     D

                                   Global Accelerator Measurements
                                   Network performance metrics for AWS’ Global Accelerator service from global
             —

                                   vantage points

                                   Multi-Cloud Connectivity
                                   Analysis of connectivity patterns between the five cloud providers

    The data presented in this report is collected using the ThousandEyes platform and testing framework. Before we get into the
    specifics of the methodologies listed above, it begs to outline the common guiding principles of the data collection framework.

4 | Cloud Performance Benchmark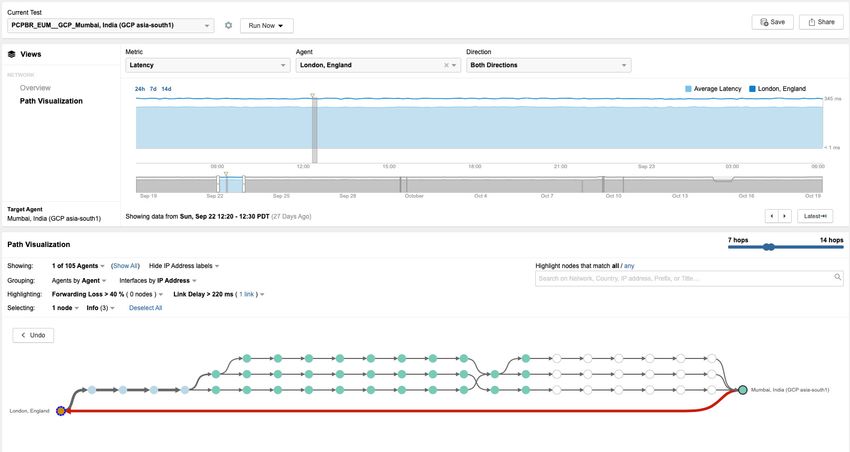
THE THOUSANDEYES PLATFORM
                       ThousandEyes uses an active monitoring technique to gather network metrics such as loss, latency and
                       jitter along with in-depth path metrics with detailed layer 3 hops. ThousandEyes vantage point agents are
                       deployed on both sides of the test measurement. These agents generate a stream of TCP probe packets
                       at pre-configured intervals in each direction. This allows us to measure loss, latency and jitter per direction
                       independently. For example, bi-directional latency is a combination of latency measurements from source
                       to target agent and vice versa.

                                                                                                  —
                                                                                      TE
                        THOUSANDEYES AGENT                                                   THOUSANDEYES AGENT

                                                                                 U
                                                                         IB
                                                               TR
                                                         IS
                                                  D
                                           T
                                     O
                                N
                        O
                   D
            —

5 | Cloud Performance Benchmark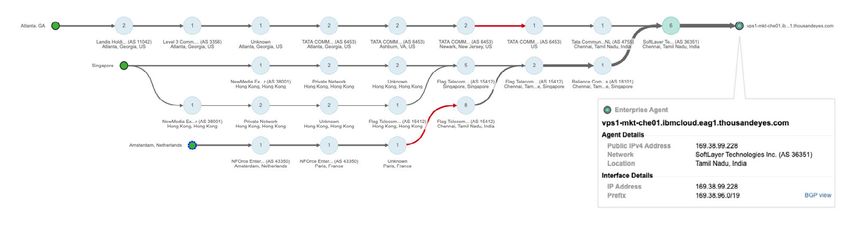
END-USER MEASUREMENTS
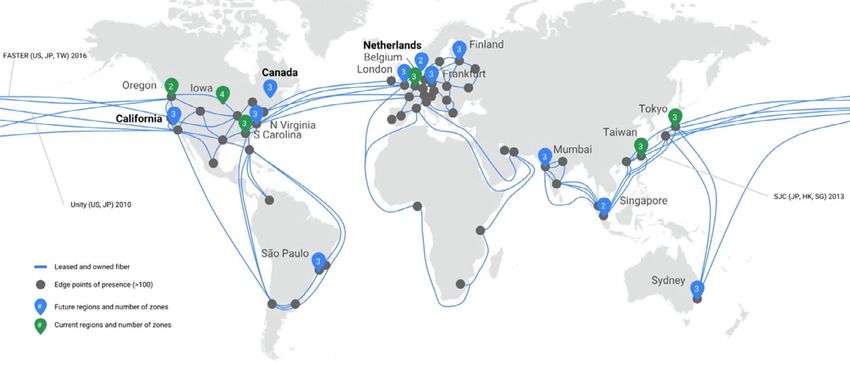
Network performance metrics were gathered every 10 minutes from 98 user vantage points deployed in data centers around the globe to 96 cloud regions across all five providers. The 98 user vantage points are hosted in Tier 2 and Tier 3 ISPs and were picked to represent a
uniform distribution around the globe. All user vantage points and the cloud hosting regions of the five cloud providers are listed in Figure 1. Network tests utilize TCP-based probes to collect hop-by-hop network path data along with network metrics like loss, latency and jitter.
The data consists of bi-directional measurements and includes both forward and reverse path information.
98 USER LOCATION VANTAGE POINTS
North Europe
Asian Europe North America & Canada Oceania
Chengdu, China Amsterdam, Netherlands Ashburn, VA, US Adelaide, Australia
Athens, Greece Atlanta, GA, US Auckland, New Zealand
us-east-1 Chengdu, China (China Mobile)
Barcelona, Spain Austin, TX, US Brisbane, Australia
Chengdu, China (China Telecom)
Dongguan, China Brussels, Belgium Baltimore, MD, US Melbourne, Australia
Dubai, United Arab Emirates Bucharest, Romania Boston, MA, US Perth, Australia
Foshan, China Cambridge, UK Charlotte, NC or MI, US Sydney, Australia
—
Guangzhou, China (China Mobile) Copenhagen, Denmark Chicago, IL, US Wellington, New Zealand
Guangzhou, China (China Telecom) Coventry, UK Detroit, MI, US
Dublin, Ireland Edison, NJ, US South America
asia-south1 Ho Chi Minh City, Vietnam Buenos Aires, Argentina
Istanbul, Turkey Düsseldorf, Germany Edmonton, Canada
Cordoba, Spain
TE
Jakarta, Indonesia Edinburgh, UK Houston, TX, US
Falkenburg, Germany Kansas City, MO Lima, Peru
Kwai Chung, Hong Kong Rio, Brazil
Manila, Philippines Frankfurt, Germany Las Vegas, NV, US
Helsinki, Finland Los Angeles, CA, US Santiago, Chile
Nagoya, Japan Sao Paulo, Brazil
Kazan, Russia Miami, FL
U
New Delhi, India
Riyadh, Saudi Arabia Kiev, Ukraine Montreal, Canada
Sendai, Japan Leipzig, Germany NYC, US
IB
Seoul, South Korea London, UK Orlando, FL, US
Shanghai, China (China Mobile) Luxenbourg Ottawa, Canada
Shanghai, China (China Telecom) Madrid, Spain Phoenix, AZ, US
Manchester, UK Raleigh, NC, US
TR
Singapore
Taipei, Taiwan Milan, Italy Sacramento, CA, US
Tel Aviv, Israel Moscow, Russia San Diego, CA, US
Tokyo, Japan Munich, Germany San Francisco, CA, US
Oslo, Norway Seattle, WA, US
IS
Africa Palermo, Italy St. Louis, MO, US
Cairo, Egypt Paris, Frence Toronto, Canada
Cape Town, South Africa Portsmouth, UK Vancouver, Canada
USER CLOUD REGION Johannesburg, South Africa Prague, Czechia Mexico City, Mexico
D
Sofia, Bulgaria
96 CLOUD REGIONS
T
Alibaba Cloud AWS GCP IBM Microsoft Azure
O
us-east-1 | Virginia, US ca-central-1 | Montreal, Canada northamerica-northeast1 | Montreal, Canada wdc04 | Washington, DC Brazil South | São Paulo, Brazil
us-west-1 | Silicon Valley, US sa-east-1 | São Paulo, Brazil southamerica-east1 | São Paulo, Brazil Sjc03 | San Jose, CA Canada Central | Toronto, Canada
N
eu-central-1 | Frankfurt, Germany us-east-1 | Ashburn, VA, US us-central1 | Council Bluffs, IA Mon01 | Montreal, Canada Canada East | Quebec City, Canada
eu-west-1 | London, UK us-east-2 | Columbus, OH, US us-east1 | Moncks Corner, SC Sao1 | São Paulo, Brazil Central US | Des Moines, IA
me-east-1 | Dubai, United Arab Emirates us-west-1 | San Jose, CA, US us-east4 | Ashburn, VA Lon02 | London, UK East US | Ashburn, VA
O
ap-northeast-1 | Tokyo, Japan us-west-2 | The Dalles, OR, US us-west1 | The Dalles, OR Par01 | Paris, Frence East US 2 | Boydton, VA
ap-south-1 | Mumbai, India eu-central-1 | Frankfurt, Germany us-west2 | Los Angeles, CA fra02 | Franfurt, Germany North Central US | Chicago, IL
D
ap-southeast-1 | Singapore eu-west-1 | Dublin, Ireland europe-north1 | Hamina, Finland Ams03 | Amsterdam, Netherlands South Central US | San Antonio, TX
ap-southeast-2 | Sydney, Australia eu-west-2 | London, UK europe-west1 | St. Ghislain, Belgium sng01 | Singapore West US | Santa Clara, CA
ap-southeast-3 | Kuala Lumpur, Malaysia eu-west-3 | Paris, France europe-west2 | London, UK che01 | Chennai, India West US 2 | Quincy, WA
—
ap-southeast-5 | Jakarta, Indonesia ap-northeast-1 | Tokyo, Japan europe-west3 | Franfurt, Germany tok02 | Tokyo, Japan France Central | Paris, France
cn-beijing | Beijing, China ap-northeast-2 | Seoul, South Korea europe-west4 | Eemshaven, Netherlands Syd01 | Sydney, Australia North Europe | Dublin, Ireland
cn-hangzhou | Hangzhou, China ap-south-1 | Mumbai, India asia-east1 | Changhua, Taiwan mel01 | Melbourne, FL UK West | Cardiff, UK
cn-hongkong | Hong Kong, Hong Kong ap-southeast-1 | Singapore asia-northeast1 | Tokyo, Japan hkg02 | Hong Kong, China West Europe | Amsterdam, Netherlands
cn-huhehaote | Hohhot, China ap-southeast-2 | Sydney, Australia asia-south1 | Mumbai, India seo01 | Seoul, South Korea Australia East | Sydney, Australia
cn-qingdao | Qingdao, China asia-southeast1 | Singapore dal12 | Dallas, TX Australia Southeast | Melbourne, Australia
cn-shanghai | Shanghai, China australia-southeast1 | Sydney, Australia mil01 | Milan, Italy Central India | Pune, India
cn-shenzhen | Shenzhen, China osl | Oslo, Norway East Asia | Hong Kong, Hong Kong
cn-zhangjiakou | Zhangjiakou, China tor01 | Toronto, Canada Japan East | Tokyo, Japan
mex01 | Mexico City, Mexico Japan West | Osaka, Japan
Korea Central | Seoul, South Korea
Korea South | Busan, South Korea
South India | Chennai, India
Southeast Asia | Singapore
West India | Mumbai, India
FIGURE 1
Bi-directional tests gather network metrics such as latency, packet loss and jitter from globally distributed user locations to 55 cloud regions of all three public cloud providers
6 | Cloud Performance Benchmark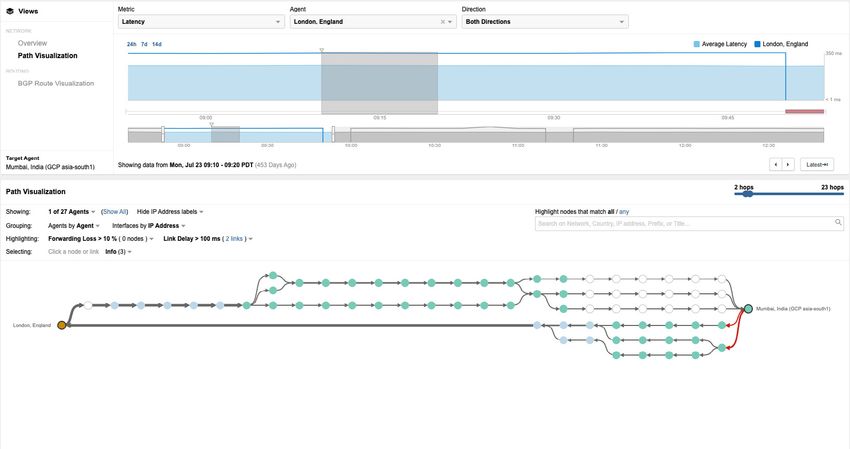
While we tested to all 96 hosting regions, we only compared results across the regions identified in
                       Table 1 below, as these data center locations provided the best opportunity to create an apples to apples
                       comparison across the cloud providers. NA (Not applicable) means that the provider doesn’t have a
                       presence in that region. If you are interested in a dataset beyond the regions listed in the table, please
                       contact ThousandEyes at cloudreport@thousandeyes.com.

                                                                                                                  Google Cloud
                                                 Amazon Web Services   Microsoft Azure       Alibaba Cloud                             IBM Cloud
                                                                                                                  Platform

                                                 us-east-1             East US               us-east-1            us-east4             wdc04
                        United States East
                                                 Ashburn, VA           Ashburn, VA           Virginia, NV         Ashburn, VA          Washington, DC

                                                 us-west-1             West US               us-west-1            us-west2             sjc03
                        United States West
                                                 San Jose, CA          Santa Clara, CA       Silicon Valley, CA   Los Angeles, CA      San Jose, CA

                                                                                                                  —
                                                 us-east-2             Central US                                 us-central1
                        United States Central                                                NA                                        NA
                                                 Columbus, OH          Des Moines, IA                             Council Bluffs, IA

                                                                                                  TE
                                                                                                                  northamerica-
                                                 ca-central-1          Canada East                                                     mon01
                        Canada                                                               NA                   northeast1
                                                 Montreal, Canada      Quebec City, Canada                                             Montreal, Canada
                                                                                                                  Montreal, Canada

                                                                                             U
                                                 sa-east-1             Brazil South                               southamerica-east1   sao1
                        South America                                                        NA

                                                                                     IB
                                                 São Paulo, Brazil     São Paulo, Brazil                          São Paulo, Brazil    São Paulo, Brazil

                        Europe – London /        eu-west-2             UK West               eu-west-1            europe-west2         lon02
                        Cardiff                  London, UK
                                                                       TR
                                                                       Cardiff, Uk           London, UK           London, UK           London, UK

                                                 eu-west-3             France Central                                                  par01
                        Europe – Paris                                                       NA                   NA
                                                 Paris, France         Paris, France                                                   Paris, Frence
                                                                     IS

                                                 eu-central-1                                eu-central-1         europe-west3         fra02
                        Europe – Frankfurt                             NA
                                                 Frankfurt, Germany                          Frankfurt, Germany   Franfurt, Germany    Frankfurt, Germany
                                                           D

                                                                       West Europe                                europe-west4         ams03
                        Europe – Benelux         NA                    Amsterdam,            NA                   Eemshaven,           Amsterdam,
                                                                       Netherlands                                Netherlands          Netherlands
                                                  T
                                             O

                                                 ap-southeast-1        Southeast Asia        ap-southeast-1       asia-southeast1      sng01
                        Asia – Singapore
                                                 Singapore             Singapore             Singapore            Singapore            Singapore
                                   N

                                                 ap-south-1            West India            ap-south-1           asia-south1          che01
                        Asia – India
                                                 Mumbai, India         Mumbai, India         Mumbai, India        Mumbai, India        Chennai, India
                        O

                                                 ap-northeast-1        Japan East            ap-northeast-1       asia-northeast1      tok02
                        Apac – Tokyo
                                                 Tokyo, Japan          Tokyo, Japan          Tokyo, Japan         Tokyo, Japan         Tokyo, Japan
                   D

                                                                                                                  australia-
                                                 ap-southeast-2        Australia East        ap-southeast-2                            syd01
                        Apac – Australia                                                                          southeast1
                                                 Sydney, Australia     Sydney, Australia     Sydney, Australia                         Sydney, Australia
                                                                                                                  Sydney, Australia
            —

                                                Table 1: Common cloud provider hosting regions evaluated in the report

7 | Cloud Performance Benchmark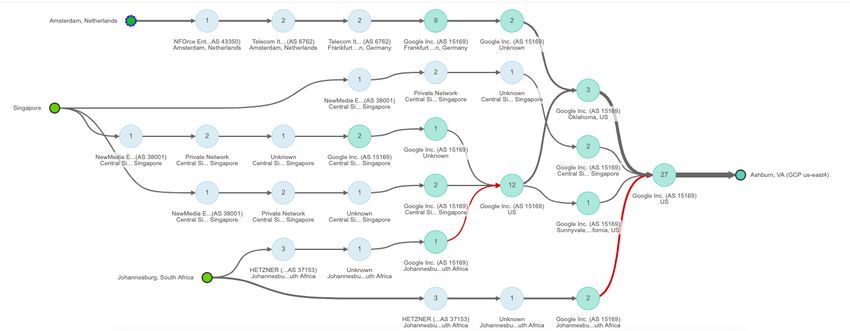
BROADBAND ISP MEASUREMENTS
                       Apart from testing to the cloud regions from the 98 locations listed above, a separate subset of
                       measurements was gathered from agents connected to broadband ISP providers in the United States.
                       Network performance metrics were gathered every 10 minutes from six broadband ISPs including AT&T,
                       Verizon, Comcast, CenturyLink, Cox and Charter, from six cities (Ashburn, Chicago, Dallas, Los Angeles,
                       San Jose and Seattle) in North America. As the tested broadband providers are located in North
                       America, measurements from broadband-connected agents were limited to cloud hosting regions in
                       North America to emulate the most realistic user scenarios.

                                                                                                —
                                                                                     TE
                                    Ashburn, VA
                                                                                                         US East

                                                                               U
                                                                       IB
                                    Chicago, IL               TR
                                                                                                     US Central
                                                       IS

                                    Dallas, TX
                                                  D
                                           T

                                    Los Angeles, CA
                                     O

                                                                                                        US West
                               N
                        O

                                    San Jose, CA
                   D
            —

                                                                                                         Canada
                                    Seattle, WA

                                                                       FIGURE 2
                            Broadband measurements were taken from user locations in six US cities (on the left) to North
                                      American hosting regions across the five cloud providers (on the right)

8 | Cloud Performance Benchmark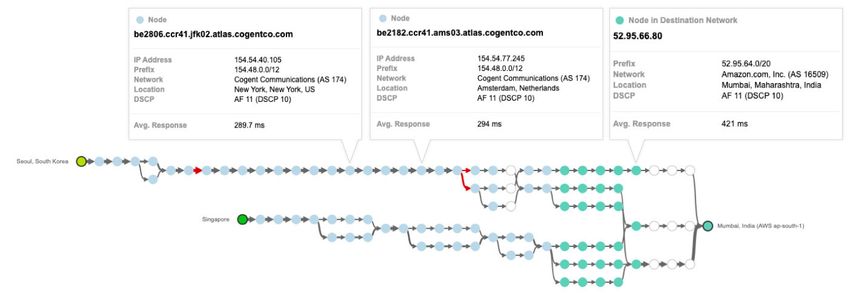
INTER-AZ AND INTER-REGION
                       MEASUREMENTS
                       As Availability Zones (AZ) and Regions are within a cloud provider, measurements in this category are
                       limited to a single public cloud provider. Inter-AZ network performance metrics were collected every
                       10 minutes from 6 AWS regions, 6 GCP regions, 4 Azure regions, 7 Alibaba Cloud regions and 4 IBM
                       cloud regions. Since Availability Zones are mapped independently within each account, sample sets
                       from multiple AZ pairs were analyzed to minimize any exceptions. Average inter-AZ latency metrics per
                       provider are presented to assess relative performance between the five cloud providers.

                                                                                               —
                                                                                    TE
                                                                     Region X

                                                                              U
                                                                       IB
                                                             TR
                                                      IS
                                                 D
                                            T
                                     O
                               N

                             us-east-1           us-east-1            us-east4            wdc04                East US
                        O

                              Virginia           Richmond             Ashburn            Washington            Ashburn
                             us-west-1           us-west-1            us-west1              Dallas           Central US
                   D

                           Silicon Valley        San Jose              Dallas               Dallas           Des Moines
                            eu-west-1            sa-east-1         europe-west-2            lon02           North Europe
            —

                             London              São Paulo            London               London              Dublin
                           eu-central-1          eu-west-2          Asia-south1             syd01          France Central
                            Frankfurt             London             Mumbai                Sydney               Paris
                            ap-south-1           eu-west-3        asia-southeast1
                             Mumbai                Paris             Singapore
                         ap-southeast-2         ap-south-1         southamerica-
                           Singapore             Mumbai                east1
                                                                     São Paulo
                            cn-shangai
                             Shangai

                                                                    FIGURE 3
                                                 Inter-AZ tests are within a single cloud provider

9 | Cloud Performance Benchmark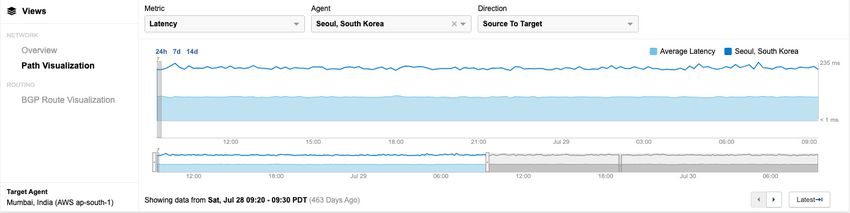
Similar to inter-AZ, inter-region measurements are limited to a single cloud provider. The number of
                       combinations depends entirely on the number of regions we tested against. To avoid large matrix
                       combinations, we kept the number of inter-region combinations to 15 for AWS, Azure and GCP, 14 for
                       IBM cloud and 13 for Alibaba Cloud.

                                                                          West Europe

                                                                                                —
                                     northamerica-northeast1

                                                                                     TE
                                                        UK West
                                                                                                       ap-northeast-1

                                                                               U
                          us-west2
                                                                         France Central

                                                                       IB
                                                                                          ap-south-1
                                                               TR
                                                       IS

                                                  southamerica-east1                                              ap-southeast-2
                                                  D
                                           T

                                                                       FIGURE 4
                                     O

                                                  Inter-Region tests are within a single cloud provider
                               N
                        O
                   D
            —

10 | Cloud Performance Benchmark
AMAZON GLOBAL ACCELERATOR
MEASUREMENTS
Announced in November 2018, AWS Global Accelerator (GA) is a networking service that improves the
availability and performance of applications hosted in AWS regions. By default, AWS does not anycast
public routes associated with their regions from global edge locations, resulting in traffic being forced
across the public Internet to their regions. The AWS Global Accelerator is a commercially available service
that modifies this behavior by leveraging the AWS global backbone.
The report tests the difference in network performance (latency, jitter and standard deviation of latency)
between the default connectivity path to AWS regions and while using the AWS Global Accelerator. At the
—
time of writing the report, the Global Accelerator is available from 14 of their regions. In this edition of the
report, we compare the Global Accelerator performance for 5 AWS regions from 38 global locations, as
TE
seen in Figure 5. As with all our other tests, we gather performance metrics every 10 minutes.
U
IB
TR
Internet
IS
Amazon Global Accelerator
D
User
T
O
N
38 USER LOCATIONS 5 AWS LOCATIONS
O
Amsterdam, Netherlands Lisbon, Portugal us-east-1 | Ashburn, VA, US
D
Atlanta, GA London, England us-west-1 | San Jose, CA, US
Bangalore, India (Reliance) Los Angeles, CA eu-central-1 | Frankfurt, Germany
Barcelona, Spain Madrid, Spain
ap-south-1 | Mumbai, India
Beijing, China (China Mobile) Montreal, Canada
—
ap-southeast-2 | Sydney, Australia
Beijing, China (China Telecom) Mumbai, India (Reliance)
Berlin, Germany (Telia) Munich, Germany
Boston, MA New Delhi, India
Brussels, Belgium New York, NY (Cogent)
Chengdu, China (China Mobile) Paris, France
Chicago, IL Portland, OR
Columbus, OH Raleigh, NC
Copenhagen, Denmark San Francisco, CA
Dallas, TX Seattle, WA
Dubai, United Arab Emirates Seoul, South Korea
Dublin, Ireland Singapore
Frankfurt, Germany (Cogent) Sydney, Australia
Hyderabad, India Tokyo, Japan
Johannesburg, South Africa Toronto, Canada
FIGURE 5
Amazon Global Accelerator
11 | Cloud Performance BenchmarkMULTI-CLOUD CONNECTIVITY
Multi-cloud connectivity patterns were detected by testing to a subset of regions across all five providers.
Given the scale of the test, with 96 hosting regions globally, multi-cloud performance metrics would
have been unwieldy and hard to interpret. Sample tests across the providers were used to understand
connectivity and peering patterns between the providers.
—
TE
U
IB
TR
IS
D
T
O
FIGURE 6
N
Multi-Cloud Connectivity
O
D
—
12 | Cloud Performance BenchmarkF I N DI N G S AN D
TAKEAWAYS
2018 VS 2019 COMPARISON
—
FINDING PROOF POINT
TE
Cloud providers autonomously make
architectural decisions that can impact the Google Cloud’s network topology is obscured
level of visibility into their internal networks, in 2019 when compared to the previous year.
U
highlighting the ephemeral state of the cloud.
IB
GCP saw the highest improvement of 36.37%
TR
Azure and GCP saw the highest improvement
followed closely by Azure with 29.29%
in inter-AZ latencies from 2018.
improvement from 2018.
IS
D
AWS improved performance predictability and
network performance in Asia by optimizing Variation in network latency improved by
peering and internet routing to its data center 42.29% in Asia for AWS deployments.
T
in Mumbai.
O
N
Despite a slight decrease year over year, Azure
continues to lead in performance predictability Network latency fluctuations improved by 50%
O
in Asia when compared to the other two cloud in Sydney but decreased by 31% in India.
providers.
D
—
GCP continues to exhibit 2.5-3.0x the network
GCP continues to show weaker performance latency in comparison to AWS, Azure, Alibaba
between Europe and India due to a lack of Cloud and 1.75x higher than IBM from Europe
direct connectivity on the GCP backbone. to the respective cloud provider regions
in India.
In 2018, we examined cloud performance data across three public cloud providers—AWS, Azure and GCP—during a period of four
weeks. The study found that there were significant architectural differences between the three providers that resulted in performance
inconsistencies (related to latency, loss and jitter) depending on where in the world an end user was located. Because there is no
steady state in the cloud, and because these providers are constantly making optimizations to their networks, a key question we
strove to answer was: how have these cloud providers improved or changed over the past year? In this section, we will discuss the key
differences we observed from 2018 to 2019.
13 | Cloud Performance BenchmarkVARYING LEVEL OF VISIBILITY IN
CLOUD PROVIDER NETWORKS
The first major difference that we observed over the past year is a significant reduction in visibility into
the Google Cloud Platform (GCP) network. ThousandEyes active monitoring uses a continuous stream of
probe packets with decreasing Time to Live (TTL) values to decipher the layer 3 hops along a service path.
This is what enables us to understand the hop-by-hop path that users take as they traverse a network.
In our testing, it appears that GCP is modifying the TTL of its packets to ensure that it doesn’t expire—
which is counterproductive when gathering per hop metrics. The result of this change is that GCP
—
regressed in the level of visibility observed through the ThousandEyes platform, particularly in the reverse
path (as shown in Figures 7 and 8). This behavior was not observed to be consistent across all GCP
TE
hosting regions.
U
IB
UNDERSTANDING PATH VISUALIZATION
TR
Path Visualization traces the journey of traffic streams from source to destination, identifying
hop-by-hop nodes with metrics such as path latency, forwarding loss at each node, link delays
IS
and Quality of Service (DSCP) remarkings along the way. Figure 7 represents the path from
a user location on the left to the data center of the cloud provider. Nodes along the path are
D
grouped by location and network they belong to, and the number within the circle represents
the number of grouped nodes. Grouped nodes are denoted by the network to which they
T
belong and the Autonomous System Number (ASN) of the ISP network along with the physical
location of the nodes in the group.
O
N
O
D
—
14 | Cloud Performance Benchmark—
TE
FIGURE 7
Reverse path from GCP India to London in 2018 reveals the connectivity path and
layer 3 hops between the source and destination
U
IB
TR
IS
D
T
O
N
O
D
FIGURE 8
Reverse path from GCP India to London is seen as a single hop in 2019
—
While this type of change may be imperceptible from a performance perspective, the loss of granular visibility
into the layer 3 hops can make it difficult to diagnose and resolve performance issues if and when they do
happen, resulting in higher MTTR for cloud issues. As Internet and cloud outages have become increasingly
damaging , loss of visibility can ultimately have detrimental impacts on the digital experience of your customers
and employees. This example with GCP demonstrates how a seemingly innocuous, behind-the-scenes
changes made by a public cloud provider within their network can have consequential impacts on the
enterprises they serve.
15 | Cloud Performance BenchmarkIMPROVEMENTS TO INTER-AZ
LATENCIES
When we analyzed bi-directional network latency, all three public cloud providers—AWS, Azure and
GCP—showed an improvement in inter-AZ latency when compared to the 2018 results (as shown in
Figure 9). The results revealed that GCP performed the best, with an overall average improvement in
latency across global regions of 36.37%, and Azure followed closely with a 29.29% improvement. AWS,
however, showed only marginal improvement in latency—less than 1% YoY. Bear in mind that absolute
inter-AZ latency numbers for all three providers are strong, in the low to fractional milliseconds range.
—
For inter-AZ latencies across providers and regions, please consult Figure 9.
TE
Inter-AZ Bidirectional Latencies: 2018 vs 2019
U
1.2
IB
1
TR
0.8
Latency (ms)
IS
0.6
D
0.4
T
0.2
O
0
N
AWS GCP Azure
Public Cloud Providers
O
2018 2019
D
FIGURE 9
YoY improvements in Inter-AZ latencies across the three cloud providers
—
16 | Cloud Performance BenchmarkAWS IMPROVES PERFORMANCE
PREDICTABILITY IN ASIA
The 2018 report highlighted a significant variation in bidirectional network latency (computed through
standard deviation from mean latency in a four week period) that reflected on the performance
predictability of connections for users in Asia to AWS’ hosting region in Mumbai (ap-south-1) as seen in
Figure 10. The vertical black lines are a measure of the standard deviation of latency, in other words how
far from the mean did latency measurements swing by. The higher the variation in latency, the lower the
performance predictability of the end-to-end connection.
—
Hosting Region: Mumbai, India
TE
AWS Azure GCP
450.00
BIDIRECTIONAL NETWORK LATENCY (MS)
400.00
U
350.00
300.00
IB
250.00
200.00
TR
150.00
100.00
50.00
IS
0.00
Asia Europe North America Oceania South America
2018 BIDIRECTIONAL LATENCY (MS)
D
FIGURE 10
Users in Asia connecting to AWS’ hosting region in Mumbai (ap-south-1) experienced a large swing in
T
bidirectional latency in 2018
O
In 2019, we found that while AWS’ connectivity architecture has not changed and that it still heavily relies
N
on the Internet, there have been improvements in both network latency and performance predictability
(Figure 11) between Asia and Mumbai, India. The results from our testing show that network latency
variations improved by 42.29% YoY.
O
D
Hosting Region: Mumbai, India
AWS Azure GCP
—
450.00
BIDIRECTIONAL NETWORK LATENCY (MS)
400.00
350.00
300.00
250.00
200.00
150.00
100.00
50.00
0.00
Asia Europe North America Oceania South America
2019 BIDIRECTIONAL LATENCY (MS)
FIGURE 11
Users in Asia experience reduced latency variation while connecting to AWS Mumbai (ap-south-1)
region in 2019
17 | Cloud Performance BenchmarkBy comparing the network path from a few user locations in Asia to the Mumbai (ap-south-1) region, we
observed that AWS has optimized its peerings. This change benefits AWS users as they are subject not
only to lower variations in latency but also a much faster network path.
Figure 12 below shows the network path from users in Seoul and Singapore connecting to AWS ap-south-1
in 2018. Note that the path visualizations below only highlight the forward path for readability. Notice how
traffic from Seoul goes across the Internet around the world, to the United States and Europe before
entering AWS network in Mumbai. Users from Singapore also traversed multiple hops through NTT’s
network before entering AWS.
—
TE
U
IB
TR
FIGURE 12
IS
Traffic path from Seoul and Singapore to AWS ap-south-1 (Mumbai) in 2018
D
In 2019, the network paths from the same user locations are more optimized, as seen in Figure 13 below.
User traffic avoids a round the world trip, stays in Asia and enters the AWS backbone sooner through an
T
Equinix interconnect in Singapore.
O
N
O
D
—
FIGURE 13
Traffic path from Seoul and Singapore to AWS ap-south-1 (Mumbai) in 2019
18 | Cloud Performance BenchmarkFrom 2018 to 2019, latency from Seoul to the AWS Mumbai region improved from 235 ms (Figure 14) to
140ms (Figure 15).
—
FIGURE 14
TE
2018 latency from Seoul in the forward direction
U
IB
TR
IS
D
FIGURE 15
T
O
2019 latency from Seoul in the forward direction
N
We saw similar improvements for other AWS regions in Asia. However, despite that improvement, AWS
continues to demonstrate the largest standard deviation in latency in Asia, as shown in Figure 16—likely a
O
byproduct of AWS’ heavy reliance on the Internet to route user traffic.
D
StandardDeviation
Standard Deviation Comparison
Comparison fromfrom
UserUser Locations
Locations in Asia
in Asia
—
Hosting Region: Mumbai, India
AWS (Asia)
Cloud Providers
GCP (Asia)
Azure (Asia)
0 20 40 60 80 100 120 140 160
Bidirectional Network Latency (ms)
2018 2019
FIGURE 16
2019 latency from Seoul in the reverse direction
19 | Cloud Performance BenchmarkAZURE END-USER PERFORMANCE
Microsoft Azure continues to use its global private backbone to move traffic from user locations to its
geographically diverse regions. Year over year, we noticed that Azure’s performance predictability
in some hosting regions improved. For instance, in Sydney, the performance variation over a four-
week period improved by 50%. However, in other regions, such as India, performance predictability
decreased by 30%.
—
Asia Europe North America Oceania South America
TBD
45.00
TE
40.00
35.00
U
30.00
IB
25.00 TR
20.00
15.00
IS
10.00
D
5.00
0.00
T
2018 2019
O
FIGURE 17
2019 latency from Seoul in the reverse direction
N
O
D
—
20 | Cloud Performance BenchmarkGCP’S CLOUD BACKBONE CONTINUES
TO IMPACT EUROPE & INDIA
Users in Europe are subject to 2.5-3X the network latency while accessing compute engine workloads
hosted in GCP’s asia-south1 region in Mumbai, India. This pattern was initially observed in the 2018 Cloud
Performance Benchmark report and attributed to the lack of connectivity on the GCP backbone between
Europe and India (as seen in Figure 18).
—
TE
U
IB
No Direct Route from Europe to India
TR
FIGURE 18
IS
No direct connectivity between Europe and India on the GCP backbone
D
The lack of connectivity results in traffic from Europe going half way around the world to reach the hosting
T
region in asia-south1 located in Mumbai. Figure 19 below compares the bidirectional network latencies
O
observed in 2018 and 2019, highlighting that there is still room for improvement within GCP’s network.
N
Hosting Region: Mumbai, India Hosting Region: Mumbai, India
O
AWS Azure GCP AWS Azure GCP
450.00 450.00
D
BIDIRECTIONAL NETWORK LATENCY (MS)
BIDIRECTIONAL NETWORK LATENCY (MS)
400.00 400.00
350.00 350.00
—
300.00 300.00
250.00 250.00
200.00 200.00
150.00 150.00
100.00 100.00
50.00 50.00
0.00 0.00
Asia Europe North Oceania South Asia Europe North Oceania South
America America America America
2018 BIDIRECTIONAL LATENCY (MS) 2019 BIDIRECTIONAL LATENCY (MS)
FIGURE 19
GCP continues to exhibit high network latencies between Europe and India
21 | Cloud Performance BenchmarkTAKEAWAY RECOMMENDATION
There is no steady state in the cloud, and Continuously monitor your external service
enterprises are subjected to the impacts of any provider networks. With increased visibility
architecture changes made at the discretion of and awareness you can:
public cloud providers. • Detect, triage and influence resolution
of any issues that is impacting customer
experience
• Keep your cloud providers accountable to
service level agreements and operational
responsiveness
—
TE
U
IB
TR
IS
D
T
O
N
O
D
—
22 | Cloud Performance BenchmarkUNDERSTANDING CLOUD
CONNECTIVITY ARCHITECTURES
FINDING PROOF POINT
Architectural and connectivity differences Path visualizations indicate that traffic destined
between the five cloud providers result in to AWS and Alibaba Cloud regions (data
varied levels of Internet exposure. centers) enter their respective backbone
closest to the target region. This is a marked
difference from how GCP and Azure handle
—
incoming traffic. Traffic enters the GCP and
Azure backbone closest to the end-user,
TE
regardless of the destination region. IBM
takes a hybrid approach to cloud connectivity,
with some regions purely relying on the IBM
U
backbone and others that primarily rely on
Internet connectivity to transport user traffic to
IB
its hosting regions.
TR
Cloud connectivity determines how users around the globe access resources deployed in the public cloud.
IS
For enterprises building their services on the public cloud, cloud connectivity architectures can directly
impact the end-user experience. Deployments with an increased reliance on and exposure to the Internet
D
are subject to greater operational challenges and risks. The Internet is a best effort medium, a constellation
of networks that are vulnerable to security threats, DDoS attacks, congestion and infrastructure outages—so
T
relying on the Internet increases unpredictability in performance, creates risk for cloud investments and
raises operational complexity.
O
N
Our analysis of network path data reveals important contrasts in cloud connectivity architectures between AWS,
Azure, GCP, IBM Cloud and Alibaba Cloud, primarily around the level of Internet exposure in the end-to-end
network paths. In this section, we’ll take a comparative look at the most significant architectural differences and
O
similarities between these five cloud providers.
D
—
23 | Cloud Performance BenchmarkALIBABA CLOUD AND AWS
Network path data for Alibaba Cloud reveals a clear behavior of forcing traffic across the public Internet prior
to absorbing the traffic into its backbone network. In Figure 20, you can see that traffic from a number of global
locations, destined for Alibaba Cloud in Silicon Valley, CA, traverses the Internet over multiple hops before
entering the provider’s backbone in San Jose or San Francisco, CA—just prior to reaching the destination.
—
TE
U
IB
TR
IS
D
FIGURE 20
T
Irrespective of the user location, traffic from global locations destined to Alibaba Cloud’s hosting
region in Silicon Valley enters the Alibaba Cloud backbone in San Jose, CA or San Francisco, CA.
O
N
O
D
—
24 | Cloud Performance BenchmarkWe’ve seen a similar pattern of behavior from AWS in the past, and the same is true this year. In this example,
shown in Figure 21, regardless of where users are located, the AWS network design forces traffic from the end
user through the public Internet, only to enter the AWS backbone closest to the target region in Mumbai, India.
—
TE
U
IB
TR
FIGURE 21
Irrespective of the user location, traffic from global locations destined to AWS’ hosting region in
IS
Mumbai, India enters the AWS backbone in Mumbai.
D
Connectivity architectures vary between the cloud providers due to differences in global routing policies. As
T
is the case for Amazon, AWS does not anycast public routes associated with each of their regions from global
O
edge locations, resulting in traffic always flowing across the Internet to their regions. The resulting exposure to
the Internet subjects its deployments to greater operational challenges and risks, especially in regions with less
N
stable Internet performance, such as in Asia.
O
D
—
25 | Cloud Performance BenchmarkAZURE AND GCP
This behavior is in stark contrast to how Microsoft Azure and Google Cloud design their respective networks.
As depicted in Figures 22 and 23, these providers absorb traffic from the end-user into their internal backbone
network closest to the user, irrespective of geographical location, relying less on the Internet to move traffic
between the two locations.
While normally relying on the provider’s backbone results in lower latency values and thus better performance,
it is sometimes the case that the absence of a direct path through the backbone results in circuitous routing
and higher latency. To that end, our tests show that Google Cloud still has some significant global gaps that
haven’t been addressed since last year’s report—notably that traffic from Europe and Africa takes 2.5-3xlonger
—
to get to India because it is routed through the GCP backbone in the US first. See Section xyz for more details.
TE
U
IB
TR
IS
D
FIGURE 22
T
O
Traffic from global locations enter Azure’s backbone close to the usera
N
O
D
—
FIGURE 23
Traffic from global locations enter GCP’s backbone closer to the end user
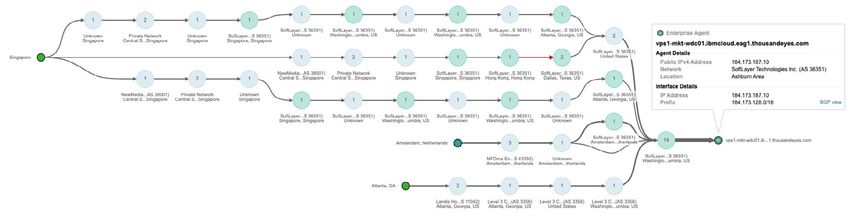
26 | Cloud Performance BenchmarkIBM CLOUD
IBM is the only cloud provider that takes a hybrid approach to cloud connectivity from users to hosting
regions. Depending on the hosting region and the expanse of the Softlayer backbone, user traffic rides
the Internet longer or enters the cloud provider’s backbone closer to the end user. Let’s look at this with an
example. Figure 24 shows the network connectivity path from users in Atlanta, Singapore and Amsterdam
accessing a workload in IBM’s region in Chennai, India. Notice how traffic from these end locations traverse
multiple ISPs and geographical regions before they enter the Softlayer network in Chennai, closest to the
hosting region.
—
TE
U
IB
TR
FIGURE 24
Traffic from global locations rely more on the Internet when accessing workloads
IS
in IBM’s Chennai region
D
T
O
N
O
D
FIGURE 25
—
Traffic from global locations enter IBM’s Softlayer backbone closer to the user location while
accessing workloads in their Washington, DC region
When compared to the network path from the same locations to a hosting region in Washington, DC, as
shown in Figure 25, we notice that traffic enters IBM’s network closer to the end user with minimal reliance
on the Internet.
27 | Cloud Performance BenchmarkTHE IMPACT OF THE CLOUD
CONNECTIVITY ON USER EXPERIENCE
Why AWS chooses to route its traffic through the Internet while the other big players use their internal backbone
might have to do with how each of these service providers has evolved. Google and Microsoft have the historical
advantage of building and maintaining a vast backbone network. AWS, the current market leader in public cloud
offerings, focused initially on rapid delivery of services to the market, rather than building out a massive backbone
network. Given their current position, increasing profitability and recent investments in undersea cables, it is likely
that their connectivity architecture will change over time.
—
Enterprises considering a move to the public cloud should consider connectivity architectures to evaluate their
appetite for risk while striking a balance with features and functionality. Enterprises should also be aware that
TE
even though public cloud backbones are each maintained by a single vendor, they are still multi-tenant service
infrastructures that typically don’t offer SLAs. Furthermore, public cloud connectivity architectures continuously
evolve and can be subject to precipitous changes at the discretion of the provider.
U
IB
While all public cloud providers rely on the public Internet to a certain extent, their level of dependence on the
Internet varies greatly—and this can have downstream impacts on the enterprises they serve. Simply put, the less
TR
time spent riding the public Internet, the more reliable and stable of an experience enterprises can expect.
IS
D
TAKEAWAY RECOMMENDATION
T
AWS deployments rely on the Internet to a Consider your organization’s tolerance for
O
greater extent than Microsoft Azure or Google exposure to the unpredictable nature of the
Cloud. For enterprises building their services Internet.
N
on AWS, this translates into traffic spending
relatively more time on the public Internet than
O
the cloud provider’s backbone.
D
—
28 | Cloud Performance BenchmarkGLOBAL END USER NETWORK
PERFORMANCE
FINDING PROOF POINT
Despite generally consistent performance The five cloud providers exhibited comparable,
across the five cloud providers, we found robust network performance across North
important exceptions, particularly in Asia America and Western Europe (UK, West EU),
and LATAM. however performance exceptions surfaced in
—
Asia and Latin America. For example:
• GCP exhibits 2.5x the network latency in
TE
comparison to AWS, Azure, Alibaba Cloud
and 1.75x higher than IBM from Europe to
regions in India
U
• Network latency from Rio to GCP’s Sao
IB
Paulo hosting region is 6x compared to
the other four cloud providers due to
TR performance impacts from an Internet
Exchange Provider network.
IS
D
Choosing the right cloud provider and regions requires a data-driven approach—and that approach must take
into account network performance as it relates to those who consume the service: the end users. In order to
T
understand performance from this angle, we tested bi-directional network latency from global user locations to
O
various geographical regions (data centers) of the five cloud providers.
N
While we found that all of the cloud providers exhibited generally comparable performance in the US and Europe,
there are certainly wide regional discrepancies that exist. The graphs in Figure 26 and 27 represent the mean
O
bidirectional latency from different continents to the hosting regions of the five cloud providers in Virginia, US, and
the United Kingdom respectively. As evident from the data, latency is comparable across all five providers. The
D
fluctuations in network latency, measured by standard deviation, is denoted by the vertical dark lines within each
measurement. As one would expect, the parent continent where the data center is located will experience the
—
minimum latency as traffic within the parent continent vantage points need to only traverse a short path to reach
the data centers.
29 | Cloud Performance BenchmarkHost Region: Virginia, VA
■ AliCloud ■ AWS ■ Azure ■ GCP ■ IBM
350
300
BIDIRECTIONAL LATENCY (MS)
250
200
150
100
—
50
0
Africa Asia (ex. China) China Europe North America Oceania South America
USER LOCATIONS
TE
FIGURE 26
Bi-directional network latency between global user locations and the Virginia data centers
U
(regions) of all five public cloud providers
IB
When connecting to hosting regions in India from Europe, our tests revealed a distinct discrepancy for
GCP users, in particular. Figure X represents the mean bi-directional latencies while connecting to data
TR
centers located in India from global regions of all five public cloud providers. Of note, it appears that
Google Cloud exhibits 2.5x the network latency in comparison to AWS, Azure, Alibaba Cloud and 1.75x
higher than IBM Cloud from Europe to regions in Mumbai, India and Chennai, India. Similarly, GCP users
IS
from Africa generally experience higher latency when connecting to its data center in India.
D
400 Host Region: United Kingdom
T
■ AliCloud ■ AWS ■ Azure ■ GCP ■ IBM
350
O
300
N
BIDIRECTIONAL LATENCY (MS)
250
O
200
D
150
100
—
50
0
Africa Asia (ex. China) China Europe North America Oceania South America
USER LOCATIONS
FIGURE 27
Bi-directional network latency between global user locations and the Virginia data centers
(regions) of all five public cloud providers
Despite the generally consistent performance noted above, we found important exceptions in network
latency, especially in geographical regions such as Asia and LATAM. These performance variations
highlight the reality that public cloud vendors do not yet have uniform or consistent performance globally.
Enterprises considering cloud deployments across multiple geographic regions can use these data points
to inform their architectural decisions.
30 | Cloud Performance BenchmarkREGIONAL EXCEPTION 1: INDIA
When connecting to hosting regions in India from Europe, our tests revealed a distinct discrepancy for
GCP users, in particular. Figure 28 represents the mean bi-directional latencies while connecting to data
centers located in India of all five cloud providers from global user vantage locations. Of note, it appears
that Google Cloud exhibits 2.5x the network latency in comparison to AWS, Azure, Alibaba Cloud and
1.75x higher than IBM Cloud from Europe to regions in Mumbai, India and Chennai, India. Similarly, GCP
users from Africa generally experience higher latency when connecting to its data center in India.
Host Region: Mumbai/Chennai, India
■ AliCloud ■ AWS ■ Azure ■ GCP ■ IBM
—
600
TE
500
U
400
BIDIRECTIONAL LATENCY (MS)
IB
300
TR
200
IS
100
D
0
T
Africa Asia (ex . China) China Europe North America Oceania South America
USER LOCATIONS
O
FIGURE 28
N
Bi-directional network latency between global user locations and the Mumbai/Chennai data
centers (regions) of all five public cloud providers.
O
D
—
31 | Cloud Performance BenchmarkBy examining the network path, Figure 29, of traffic originating in Spain, England and South Africa that is
destined for India, we can begin to understand why GCP exhibits higher latency between these regions. As
you can see, users originating in these three locations transit through Google’s backbone in the US before
reaching the destination in Mumbai. Of course, the circuitous route between these locations is not the most
direct, and it results in much higher network latency with the potential to affect users connecting to workloads
in GCP’s hosting region in Mumbai, India.
—
TE
U
IB
FIGURE 29
TR
Traffic from Europe and Africa traverse a circuitous route through the GCP backbone via the
United States to reach India.
IS
In contrast, Microsoft Azure users connecting from Europe and Africa to hosting regions in India follow a
D
more optimal route. In Figure 30, you can see that users originating in Spain, England and South Africa
destined for India enter the Microsoft backbone much closer to the end user before transiting to its
T
destination. The result is much lower latency and, likely, a more stable experience for end users.
O
N
O
D
—
FIGURE 30
Users on Azure experience a more optimal network path from Europe and Africa to India
32 | Cloud Performance BenchmarkREGIONAL EXCEPTION 2: SINGAPORE
Global user performance to the Singapore data centers of all five cloud providers is more of a mixed bag
but exhibits interesting differences in performance. For example, when connecting to services in GCP’s
Singapore data center, users from Africa, Asia and Europe experience higher latencies when compared
to the other four cloud providers. The sparse connectivity between Europe and India on GCP’s backbone
possibly explains why users in Africa and Europe take longer to reach workloads in GCP Singapore.
However, If you are serving customers in China, Alibaba Cloud shows the best latency while IBM is almost 3x
slower in the same geography.
cloud providers
Bidirectional
Latency (ms)
—
Alibaba aws azure gcp ibm
Africa 381.78 297.20 286.96 409.36 290.14
TE
Asia
90.76 96.59 102.29 140.49 108.57
ex. China
U
China 65.69 111.96 97.63 129.63 188.10
IB
Europe 250.76 232.17 196.68 301.58 196.87
TR
North
225.50 226.40 222.01 203.58 223.23
America
IS
Oceania 164.76 133.08 101.45 114.17 102.63
South
D
354.05 358.33 366.88 320.78 357.08
America
T
O
N
O
D
—
33 | Cloud Performance BenchmarkREGIONAL EXCEPTION 3: SOUTH AMERICA
While testing from global locations to cloud provider regions in Sao Paulo, we noticed that users in
Rio experienced a slow connection while accessing workloads in GCP’s hosting region in São Paulo
(southamerica-east1). As seen in the graph in Figure 31 below, GCP was 6x slower compared to the other
three providers. Note that Alibaba Cloud does not have a hosting region in Sao Paulo, so our comparisons
in this region was between AWS, Azure, GCP and IBM.
Host Region: São Paulo
■ AWS ■ Azure ■ GCP ■ IBM
350
—
300
BIDIRECTIONAL LATENCY (MS)
250
TE
200
U
150
IB
100 TR
50
IS
0
Africa Asia (ex. China) China Europe North America Oceania South America
USER LOCATIONS
D
FIGURE 31
Network latency between multiple user locations in South America and the data centers (regions)
T
of the public cloud providers with a presence in that region.
O
A deeper dive into the network path from Rio to GCP Sao Paulo showed that traffic was being handed
N
off to GCP’s network at a local IXP in Rio. As seen in the path visualization in Figure 32 below, round
trip latency from the user location in Rio to the IXP is what contributes to ~90% of the total bidirectional
O
latency, indicating a slowdown at the Internet exchange point rather than within GCP’s network.
D
—
FIGURE 32
Internet exchange provider slows down traffic from Rio to GCP São Paulo
Enterprises need to be cognizant of the fact that there are multiple external third-party dependencies
while using the cloud and that every single dependency in the service delivery supply chain is critical to
performance—and your cloud provider (as seen in this case) is not always at fault.
34 | Cloud Performance BenchmarkREGIONAL EXCEPTION 4: FRANKFURT
Suboptimal routing affects not just users in Europe connecting to Mumbai, but it also affects users in Asia
connecting to GCP’s hosting regions in Europe. As seen in the graph below (Figure 33), users from Asia
and China have relatively high network latency, ~20% more, when compared to the other providers.
Host Region: Frankfurt, Germany
■ AliCloud ■ AWS ■ GCP ■ IBM
400
350
—
300
BIDIRECTIONAL LATENCY (MS)
TE
250
200
U
150
IB
100
TR
50
IS
0
Africa Asia (ex. China) China Europe North America Oceania South America
D
USER LOCATIONS
FIGURE 33
Bi-directional network latency between global user locations and the Frankfurt data centers
T
(regions) of the public cloud providers with a presence in that region.
O
N
O
D
—
35 | Cloud Performance BenchmarkNETWORK PERFORMANCE IN CHINA
FINDING PROOF POINT
The Great Firewall imposes a performance toll Traffic to and from China, irrespective of
on all cloud provider traffic entering and exiting which cloud hosting region it is destined to or
China. originating from is subject to high packet loss.
On the contrary, traffic that is contained within
China does not experience packet loss.
—
Enterprises hesitant to choose a China-based Data-driven decisions enable enterprises
hosting region with a cloud provider have other to pick the optimal cloud provider and
hosting regions to serve customers in China.
TE
viable options that offer reasonable latency.
Singapore and Hong Kong are two viable
hosting regions with optimal network latency
from China.
U
• Alibaba Cloud has the best network latency
IB
between China and Singapore. Alibaba
Cloud outperforms Azure and AWS by 32%
TR and 41% respectively.
• Alibaba Cloud has the best network
latency between China and Hong Kong,
IS
outperforming both Azure and IBM.
D
Enterprises expanding their global presence in the AsiaPac market are challenged with varying and unpredictable
T
performance. Within Asia, China definitely holds a special position when it comes to network performance
O
and Internet behavior. Heavy and opaque sovereign controls over Internet behavior have long contributed to
N
characteristically unstable Internet performance throughout China. Sitting in between Chinese citizens and the
global Internet is the Great Firewall of China, a sophisticated content filtering machine. Employing a multitude
of censorship tools—such as IP blocking, DNS tampering and hijacking, deep packet inspection, and keyword
O
filtering—the Great Firewall is designed to ensure that online content aligns with the party line.
D
Privacy and ethics concerns aside, one of the drawbacks to this system is a vast reduction in performance. Our
testing confirmed that any traffic that passes the Great Firewall is subject to heavy packet loss, a characteristic that
—
was not common across any other political or geographical boundaries. For instance, Figure 34 below, represents
the packet loss experienced by users in global continents while connecting to two different hosting centers of
all five cloud providers—one in Virginia and the other in India. Irrespective of the cloud provider, packet loss
between China and the hosting region is consistently high, showing that no one is exempt from paying the “China
Performance Toll.”
36 | Cloud Performance BenchmarkPacket Loss
Packet Loss
Packet Loss Packet Loss
Africa Asia (ex. China) China Europe North America Asia (ex.Oceania
Africa China) China
South America
Europe
Africa Asia (ex. China) China Europe
North America Oceania South America North America Ocea nia South America
0.07 Hosting Region: Virgina, US Hosting Region: Mumbai / Chennai, India
0.07 0.06
0.06
0.06
0.05
0.05
0.05
PACKET LOSS (%)
0.04
PACKET LOSS (%)
PACKET LOSS (%)
0.04
0.04
0.03
0.03 0.03
0.02
0.02 0.02
0.01
—
0.01
0.01
0 0
AliCloud
0 AWS Azure GCP IBM AliCloud AWS Azure GCP IBM
AliCloudCLOUD PROVIDER AWS Azure GCP IBM
TE
CLOUD PROVIDER
CLOUD PROVIDER
FIGURE 34
Irrespective of the cloud provider, traffic entering and exiting China pays a performance toll
U
through high packet loss.
IB
As this behavior is an artifact of the Great Firewall, any traffic that does not cross the firewall is subject to TR
very minimal loss. We observed this pattern, as seen in Figure 35 below, while testing from vantage points
within China to Alibaba Cloud regions in China. Due to legal restrictions in using other cloud providers’
regions in China, we limited these tests to only Alibaba Cloud regions in China.
IS
D
PacketPacket
Loss Within
Packet
Loss Loss
Within China
China
Africa Africa Asia
Asia(ex. China)
(ex. China) China China
Europe Europe
North America North America
Oceania South AmericaOceania South America
T
0.07
O
0.06
N
AliCloud Beijing
0.05
PACKET LOSS (%)
O
0.04
ALICLOUD HOSTING REGIONS
ALICLOUD HOSTING REGIONS
D
0.03
0.02
AliCloud Hangzhou
—
0.01
0
AliCloud AWS Azure GCP IBM
CLOUD PROVIDER
AliCloud Shenzhen
0.00% 1.00% 2.00% 3.00% 4.00% 5.00% 6.00% 7.00% 8.00% 9.00%
PACKET LOSS (%)
LOSS %
FIGURE 35
Traffic within China is not subject to the Great Firewall penalties
37 | Cloud Performance BenchmarkThe data above shows that there is obvious benefits to picking an Alibaba Cloud region in China to host
workloads and services. However, enterprises that are still cautious and hesitant to pick a cloud provider
with origins in China or a hosting region in China do have options. We looked at bidirectional network
latency and bidirectional packet loss for a few regions closest to China (Singapore, Hongkong and India)
and compared the cloud providers with presence in these regions (Figures 36 and 37).
Bidirectional Latency from China
■ AliCloud ■ AWS ■ Azure ■ GCP ■ IBM
400.00
350.00
—
300.00
BIDIRECTIONAL LATENCY (MS)
250.00
TE
200.00
U
150.00
IB
100.00
50.00
TR
0.00
Hosting Region: Hongkong Hosting Region: Singapore Hosting Region: India
IS
-50.00
FIGURE 36
D
Bidirectional latency from China to hosting regions in Asia
T
O
Bidirectional Packet Loss from China
■ AliCloud ■ AWS ■ Azure ■ GCP ■ IBM
N
7.00%
O
6.00%
D
5.00%
Packet Loss (%)
—
4.00%
3.00%
2.00%
1.00%
0.00%
Hosting Region: Hongkong Hosting Region: Singapore Hosting Region: India
FIGURE 37
Bidirectional packet loss from China to hosting regions in Asia
38 | Cloud Performance BenchmarkAlibaba Cloud performs the best in both Singapore and Hong Kong for users connecting from China, both from
the perspective of network latency, predictability (black vertical lines) and packet loss, but not for India. If, for some
reason, Alibaba Cloud is not your first choice, Azure performs equally well across all three hosting regions, not
compromising on speed, predictability or packet loss.
TAKEAWAY RECOMMENDATION
All cloud providers, including Alibaba, pay Use data from the report to evaluate hosting
—
a performance toll when crossing the Great options to serve users in China.
Firewall of China.
TE
U
IB
TR
IS
D
T
O
N
O
D
—
39 | Cloud Performance BenchmarkYou can also read