Transmission Ten-Year Development Plan 2011-2020 - Public Version - Eskom
←
→
Page content transcription
If your browser does not render page correctly, please read the page content below
Transmission Ten-Year
             Development Plan
                2011-2020

Public Version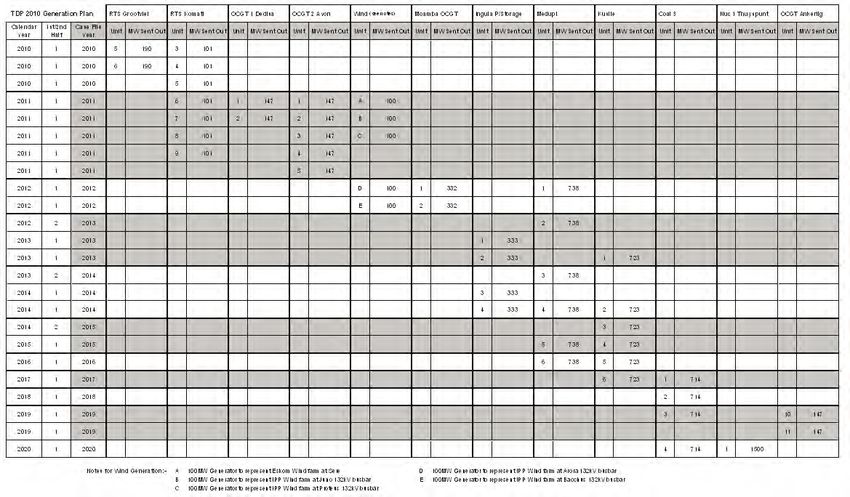
Foreword by Divisional Executive
    A reliable supply of electricity is essential for South       are integrated into the national power system and that
    Africa’s economy to grow and generate the additional          there is minimum infrastructure to meet prescribed
    job opportunities that our people so desperately              reliability criteria. Funding constraints mean that the
    need. A reliable Transmission network of adequate             time it will take to meet the full requirements of the
    capacity   to   meet     the   country’s    needs    is   a   Grid Code could be as late as 2020 .
    necessary condition for the provision of a reliable
    electricity supply to South Africa, and to support            We estimate that, in nominal terms, an investment of
    the Government’s initiatives          to create jobs. The     R166 billion is required to the end of the financial year
    Transmission network does not only require regular            2020. This is a significant investment on its own if one
    preventative maintenance and timeous repair of                compares it to what is needed for transport and water
    faults to remain reliable, but it must be developed and       projects. These investments already consider constraints
    extended as well to meet the increasing demands made          in funding and resource availability as they have ideally
    upon it; or alternatively connect new loads and power         been accelerated. These investments will result in the
    stations should be connected to the network.                  reliability standards only being completely met in the
                                                                  period 2015 to 2020.
    The National Energy Regulator of South Africa
    (NERSA) has published, in the Grid Code; the rules            It is clear that electricity is the lifeblood of South Africa’s
    governing investment in the Transmission network.             economy and hence there is a need for the country to
    Eskom, as the licensed Transmission Network Service           understand what is required to ensure a reliable and
    Provider plans the network according to this Code             secure supply and what investment levels are required
    and, subject to funding and other resource constraints,       to achieve it. We hope that this document will assist in
    builds the network according to these plans. Where            this dialogue, and we welcome comments and queries
    sufficient funds are not available to develop the network,    on the content and format.
    a consistent set of rules is applied to prioritise projects
    and allocate funding in such a way that the maximum           We would also like to take this opportunity to thank
    benefit is gained for South Africa.                           the team that has worked and continues to work on
                                                                  the development of these plans. It is a difficult and
    The Transmission Development Plan for the period              complex process which requires extensive consultation
    2011 to 2020 is the third such plan that is being             and multiple iterations.
    published in the public domain. It follows on the second
    such plan published in 2010. The major focus of the           Kind regards
    plans continues to ensure that the new power stations         Mongezi Ntsokolo

i     Transmission Ten-Year Plan 2011-2020
Disclaimer
The purpose of publishing the Transmission Ten-year          shall Eskom be liable for any direct, consequential,
plan is to inform stakeholders about the proposed            incidental, special, punitive, or any other damages
developments in the Eskom transmission network.              whatsoever, including, but not limited to damages for
These plans are subject to change as and when better         loss of business profits, business interruption, or loss of
technical solutions are identified or when more accurate     business information.
developmental information becomes available. The
information contained in Transmission’s Ten-year plan        While the Transmission Ten-year plan is updated
should therefore not be used for any other purpose           periodically,   Eskom makes no representation or
other than sharing of information.                           warranty as to the accuracy, reliability, validity, or
                                                             completeness of the information in this document.
The contents of this document do not constitute advice       Eskom does, however, endeavour to release plans based
and Eskom makes no representations regarding the             on the best available information at its disposal at all
suitability of the information contained in this document    times to ensure that the stakeholders are kept informed
to be used for any purpose. All such information is          about the developments in the transmission network.
provided “as is” without warranty of any kind and is         Thus, the information contained in this document
subject to change without notice. The entire risk arising    represents the most up-to-date information that was
out of its use remains with the recipient. In no event       available at the time it was released.

Executive Summary
Eskom Holdings is a vertically integrated company
licensed to generate, transmit, and distribute electricity
in South Africa. The Transmission Division of Eskom
Holdings is tasked with the responsibility of developing
the transmission network. The publication of the
Transmission Ten-year plan is to inform stakeholders
about Eskom’s plans with regard to the development
of the transmission network. This publication fulfils
the requirements of the South African Grid Code,
which requires the Transmission Network Service
Provider (TNSP) to annually publish plans on how the         the transmission system that have been completed
network will develop. This is the third publication of the   in the past year as well as projects that are planned
Transmission Ten-year plan.                                  for the next ten years. The transmission network
                                                             is the primary network of interest covered in
A public forum will be held with identified stakeholders     this publication. This covers electrical networks
to further disseminate and get feedback about the            with voltages ranging from 220 kV to 765 kV and
contents herein. These comments will be taken into           the transmission substations where these networks
account when the plan is revised. This publication           terminate. A few 88 kV and 132 kV electrical networks
contains projects intended to extend or reinforce            are included due to their strategic nature.

                                                                                                       © Eskom 2011        ii
The projects that are covered in this document include,     Eskom     Transmission      also   undertakes    capital
      inter alia, generation integration projects required to     expenditure in respect of refurbishment of ageing
      ensure that the network is adequate to evacuate and         infrastructure, facilities, production equipment, and
      dispatch power from the source to the load centres.         strategic capital spares.

      The publication also includes the transmission network      Facilities consist of buildings located at sites other
      strengthening plans required to carry the power from        than substations that are used by Transmission for
      the new power stations, and reliability projects required   offices, operation and control of the system, or as
      to ensure that the reliability and adequacy of the          maintenance depots and workshops.
      transmission network are sustained as load demand
      increases on the network.                                   Production equipment consists of office furniture and
                                                                  equipment, computer hardware and software, tools
      The estimated rand value of the planned projects            and other equipment used by maintenance personnel,
      is approximately R166 billion in the next ten years,        and vehicles.
      of which approximately R 6 billion is for customer
      -related projects; R31 billion for generation integration   Strategic capital spares are items not available
      projects, and approximately R129 billion is related to      from suppliers ex stock; for example, large power
      reliability projects. The costs given in the document       transformers, circuit breakers, etc. that are kept as a
      are, in general, high-level estimates and can change        strategic stock to allow units that fail in service and
      as global economic conditions change; that is, costs        cannot be repaired on site to be replaced as soon as
      are sensitive to foreign exchange, commodity price          practicable, thereby minimising the risk of customers
      fluctuations, and global demand.                            experiencing a lengthy outage.

      In general, the impact of reliability projects on the       Projects dealing with refurbishment of ageing
      customers is to improve availability of supply under        infrastructure, facilities, production equipment, and
      normal    and    contingency    operating    conditions,    strategic capital spares are not included in greater
      whereas customer and generation integration projects        detail in this document, but a summary of their
      allow generating plant and the load to be optimally         costs is illustrated in the chapter dealing with capital
      connected to the network.                                   expenditure.

iii     Transmission Ten-Year Plan 2011-2020
Table of Contents
FOREWORD BY DIVISIONAL EXECUTIVE                             i
DISCLAIMER                                                   ii
EXECUTIVE SUMMARY                                            ii
TABLE OF CONTENTS                                            iv
ABBREVIATIONS                                               vii

1. INTRODUCTION                                             1
1.1 Context of the Transmission Ten-Year Plan               1
1.2 Structure of the document                               1

2. LOAD DEMAND FORECAST AND GENERATION SCENARIOS            2
2.1 Load Forecast                                           2
2.2 Generation Assumptions                                  3

3. MAJOR FACTOR CHANGES FROM PREVIOUS TDP                    8
3.1 Geospatial Load Forecast                                 8
3.2 Generation Assumptions                                   9

4. COMPLETED PROJECTS SINCE LAST TDP                         9
4.1 Completed generation integration projects                9
4.2 Update on transmission reliability                       9
4.3 Grid Connections Applications                           10

5 NATIONAL OVERVIEW                                         11

6 BREAKDOWN OF THE TDP PROJECTS BY GRID                     14
6.1 Central Grid                                            14
6.2 East Grid                                               20
6.3 North Grid                                              24
6.4 North East Grid                                         29
6.5 North West Grid                                         34
6.6 South Grid                                              38
6.7 West Grid                                               43
6.8 Strategic Servitudes Under Investigation                47

7 CAPITAL EXPENDITURE PLAN                                  48

8 CONCLUDING REMARKS                                        49

                                                   © Eskom 2011   iv
APPENDICES
    APPENDIX A:     GENERATION ASSUMPTIONS                                           51
    APPENDIX B:     COSTING DETAILS                                                  52
    APPENDIX B1:    COSTING PER PROJECT TYPE                                         52
    APPENDIX B2:    COSTING OF PROJECTS PER CLN                                      52
    APPENDIX B3A:   COSTING FOR CENTRAL GRID PROJECTS                                53
    APPENDIX B3B:   COSTING FOR EAST GRID PROJECTS                                   54
    APPENDIX B3C:   COSTING FOR WEST GRID PROJECTS                                   55
    APPENDIX B3D: COSTING FOR SOUTH GRID PROJECTS                                    56
    APPENDIX B3E:   COSTING FOR NORTH EAST GRID PROJECTS                             57
    APPENDIX B3F:   COSTING FOR NORTH WEST GRID PROJECTS                             58
    APPENDIX B3G:   COSTING FOR NORTH GRID PROJECTS                                  59
    APPENDIX C:     PUBLICATION TEAM                                                 60
    APPENDIX D:     CONTACT DETAILS                                                  60

    TABLE OF FIGURES
    Figure 2.1:     The Eskom transmission system demand forecast                    3
    Figure 2.2:     Power station capacity introduction by year                      7
    Figure 2.3:     Planned Power Station Capacity by 2020                           8
    Figure 5.1:     Map showing relative location of the major TDP scheme projects   11
    Figure 6.1:     Current Central Grid network and CLNs                            14
    Figure 6.2:     Central Grid network diagram                                     19
    Figure 6.3:     Current East Grid network and CLNs                               20
    Figure 6.4:     East Grid geographical network diagram                           23
    Figure 6.5:     Current North Grid network and CLNs                              24
    Figure 6.6:     North Grid geographical network diagram                          28
    Figure 6.7:     Current North East Grid network and CLNs                         29
    Figure 6.8:     North-East Grid network diagram                                  33
    Figure 6.9:     Current North West Grid network and CLNs                         34
    Figure 6.10:    North West Grid geographical network diagram                     37
    Figure 6.11:    Current South Grid network and CLNs                              38
    Figure 6.12:    The South Grid networks diagram                                  42
    Figure 6.13:    Current West Grid network and CLNs                               43
    Figure 6.14:    West Grid geographical network diagram                           47
    Figure 7.1:     Summary of Capital Expenditure in the Transmission Division      48

v     Transmission Ten-Year Plan 2011-2020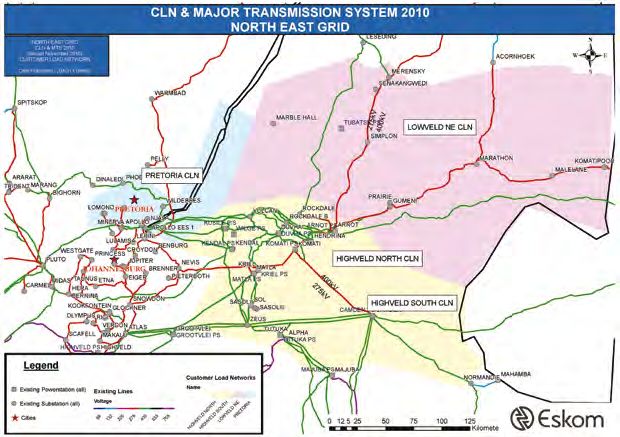
LIST OF TABLES
Table 4.1:       Connection Applications Quoted and Accepted                                  10
Table 5.1:       Major TDP transmission assets expected to be installed                       12
Table 6.1:       Central Grid CLN load forecast and percentage load increases                 15
Table 6.2:       New transmission assets for the Central Grid                                 15
Table 6.3:       East Grid CLN load forecast and percentage load increase                     20
Table 6.4:       East Grid new transmission assets                                            21
Table 6.5:       North Grid CLN load forecast and percentage load increases                   24
Table 6.6:       North Grid new transmission assets                                           25
Table 6.7:       North East Grid CLN load forecast and percentage load increases              29
Table 6.8:       Cumulative TDP transmission assets for the North East Grid                   30
Table 6.9:       North West Grid CLN load forecast and percentage load increases              34
Table 6.10:      Cumulative assets for North West grid                                        35
Table 6.11:      South Grid CLN load forecast and percentage load increases                   38
Table 6.12:      Cumulative TDP transmission assets for the South Grid                        39
Table 6.13:      West Grid CLN loads and percentage load increases                            43
Table 6.14:      Cumulative TDP transmission assets for the West Grid                         44
Table 7.1:       Capital Expenditure per year for different categories of projects            48
Table 7.2:       Reliability capital expenditure per project type                             49

                                                                                     © Eskom 2011   vi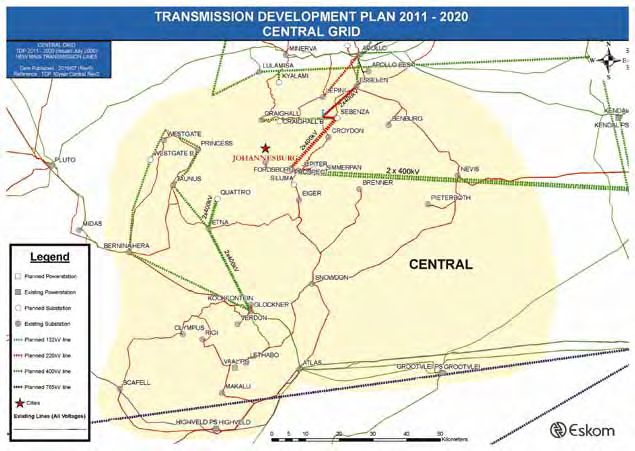
Abbreviations
      CLN (Customer Load Network)                               TDP – Transmission Development Plan
      A network supplying a subdivision of a grid, usually a    A development plan produced annually by Grid Planning
      significant geographical landmass or political boundary   detailing how the network will develop in the next ten
      served, e.g. Johannesburg CLN within the Central Grid     years.This comprises the proposed new projects listed in
                                                                this document as well as the customer projects omitted
      TNSP (Transmission Network Service Provider)              from this document due to their commercial sensitivity.
      A legal entity that is licensed to own and maintain a
      transmission network                                      OCGT – Open Cycle Gas Turbine
                                                                Combustion turbine fuelled by liquid fuel or gas, used to
      MW (Megawatts)                                            drive a generator.
      A million watts – a watt is a unit of electrical power
      production or demand                                      CCGT – Combined Cycle Gas Turbine
                                                                OCGT fitted with a waste heat recovery boiler and
      MVA (Megavolt-amperes)                                    steam turbines to increase electricity output using the
      A million volt-amperes-volt-ampere depicts vectoral       combustion turbine’s exhaust gases.
      summation of real power (MW) and apparent power
      (Mvars)                                                   HVDC – High Voltage Direct Current

      NERSA (National Energy Regulator of South Africa)         IQ – Indicative Quote
      A regulatory body for all forms of energy production      Quotation giving a non-binding indication of order of
      and usage in South Africa                                 magnitude costs

      MTS – Main Transmission Substation                        FQ – Feasibility Quote
      These are mainly substations that step the voltage down   Quotation giving customers costs and scope at 65%
      to Distribution Voltages                                  accuracy level

      RTS – Return to Service                                   BQ – Budget Quote
      A previously mothballed Power Station undergoing re-      Quotation giving customers costs and scope at 85%
      commissioning                                             accuracy level

      REFIT – Renewable Energy Feed in Tariff
      The NERSA promulgated tariffs payable to producers of
      renewable energy.

      IPP – Independent Power Producer
      These are power stations owned by independent parties
      other than Eskom.

vii     Transmission Ten-Year Plan 2011-2020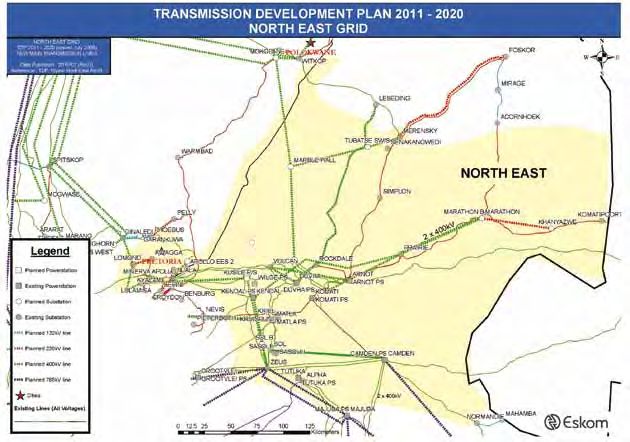
1. Introduction
1.1 CONTEXT OF THE TRANSMISSION TEN-
YEAR PLAN

Eskom Holdings is the biggest producer of electricity
in South Africa; it also transmits electricity via a
transmission network which supplies electricity at high
voltages to a number of key customers and distributors.
Eskom is a vertically integrated company licensed
to generate, transmit and distribute electricity. The
transmission licence is held by Eskom Transmission, the
transmission network service provider, (TNSP). Planning     1.2 STRUCTURE OF THE DOCUMENT
the transmission network is the responsibility of the
Grid Planning Department, in the System Operations          The document is structured in the following manner:
and Planning Division.
                                                            Chapter 2 deals with the electricity demand forecast
The TNSP is required to abide by the regulatory             and generation assumptions. The demand forecast
requirements to annually publish a document detailing       determines how the network is planned and it
the plans of how the transmission network will develop      contextualises the planning activity while the generation
in the next five years.The requirements further stipulate   assumptions outlines the generation build that informs
that the published document should include:                 some of the planned transmission network, as significant
                                                            transmission network is required to evacuate power
•   the acquisition of servitudes for strategic purposes;   from the power stations to the load.
•   a list of planned investments, including costs;
•   diagrams displaying the planned changes to the          Chapter 3 focuses on the major changes that have
    transmission system (TS);                               occurred since the completion of the previous published
•   an indication of the impact on customers in terms       Ten-year plan. The changes that occurred include the
    of service quality and cost; and                        enhancement of geospatial forecasting, which improves
•   any other information as specified by the NERSA         the forecasting of load at a spatial level, and the changes
    from time to time.                                      from the previous generation assumptions to the ones
                                                            informing this plan.
A further requirement is that the TNSP holds public
forums to share such plans with stakeholders in order       Chapter 4 focuses on projects that have been
to facilitate a joint planning process with them. The       completed in the past year and the impact they have
second ten-year plan was published in 2010, this is the     had on network reliability. This is partly to demonstrate
third publication based on the TDP for 2011 to 2020         the value of the projects as they are completed and to
(also called the 2010 TDP internally to Eskom) which        also inform stakeholders about the progress of projects
was finalised internally during the latter parts of 2010.   thus far.

                                                                                                      © Eskom 2011        1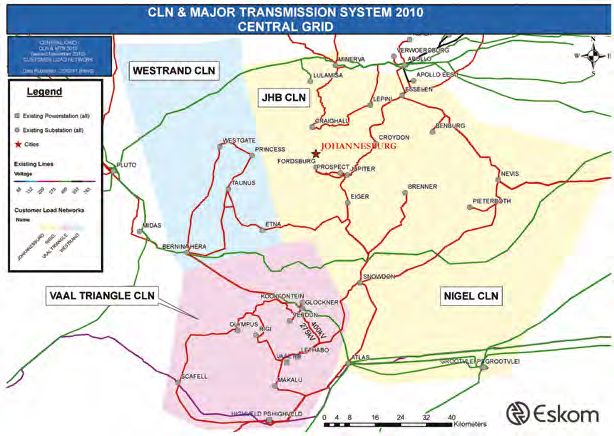
Chapter 5 deals with the national overview, which gives      to accommodate substations and lines respectively. In
    a high level explanation of the planned transmission         either case, the Environmental Protection Act requires
    infrastructure. This is intended to give a snapshot of the   Eskom to conduct an Environmental Impact Assessment
    major projects that are planned for the entire Ten-year      (EIA) and obtain environmental approval, which includes
    plan period and a high-level summary of the installed        consultation with affected stakeholders, prior to construction.
    transmission infrastructure.
                                                                 Chapter 7 deals with the capital expenditure of the
    Chapter 6 focuses on planned projects in detail and          ten-year plan.
    the impact they will have on the network. Generation
    integration and reliability projects are discussed per       Chapter 8 deals with various conclusions based on the
    Grid. In both instances, sites and servitudes are required   content of this document.

    2. Load Demand Forecast and Generation Scenarios
    2.1 LOAD FORECAST                                            The effects of the economic crisis have resulted in a
                                                                 significant impact on the demand in late 2008 and early
    Load forecasting is a fundamental requirement for a          2009. Hence the load forecast presented in this report
    Transmission planning cycle. Availability of sufficient      indicates relatively smaller system load demand as
    transmission network capacity in any country is              compared to the load forecast used in the 2010 – 2019
    important for economic growth. Grid Planning, in             TDP (2009 TDP). See Figure 2-1, on the next page, that
    consultation with the relevant Distribution regions,         illustrates the difference.
    compiles a forecast per point of supply for the network
    computer model.                                              Due to the long lead times and EIA requirements, the
                                                                 transmission planning studies were based on this load
    The geographically differentiated loads indicate that        forecast to provide enough time to initiate the necessary
    the growth rates and load profiles differ substantially      transmission infrastructure projects. The forecasted
    from one substation or area to another. The forecast         system peak demand for each year is given in Figure 2
    that was used for the 2011 – 2020 TDP (2010 TDP)             1 on the next page including the percentage growth for
    was developed using the 2009 July System peak load.          each year for the latest forecast:.

2     Transmission Ten-Year Plan 2011-2020
Transmission Demand Forecast
2010 TDP versus 2009 TDP
Figure 2.1: The Eskom Transmission System Demand Forecast
The planning studies for the TDP were based on meeting based on the draft document “Integrated Resource
the 2010 TDP load forecast in Figure 2 1. Further Plan for Electricity 2009 Report – Version 1” which
monitoring and analysis of the load growth are being was complied by the System Operations and Planning
undertaken to determine more accurately the location Division in October 2009. This draft document was
of the new loads as a result of the economic recovery anticipated to be in line with the IRP. The generation
and progress on customer-initiated developments. For plan in this report was then compared with the official
purposes of the TDP, loads are allocated to a CLN IRP and any significant variances were to be highlighted.
according to the location of the transmission substation
supplying them, even if they are physically located in a A number of scenarios were considered when
different CLN. developing the IRP. These were based on a reference
plan with the impact of certain factors taken into
2.2 GENERATION ASSUMPTIONS account to develop the potential scenario. These
scenarios were as follows:
The existing generation capacity was included as • Reference plan
fully installed generation capacity in the year of the • Domestic emission (Emission Constraint 1)
study. Cahora Bassa power import was modelled at • Regional emission (Emission Constraint 2)
a maximum of 1200MW. The future approved power • Delayed regional emission (Emission Constraint 3)
plant integration projects were incorporated in the year • Carbon Tax
in which they are expected to be commissioned. • IPP alternates 1
• IPP alternates 2
The expected official release of the IRP was December • Lowest CO2
2009. In order to comply to the TDP process timelines, • Policy portfolio
an assumed generation rollout has been detailed • Risk-adjusted emission portfolio (MYPD capacity)
© Eskom 2011 3Analysis of the various factors and the practicalities and during system peak, but for integration studies, they are
likelihood of implementation of the different scenarios studied at full output under system peak conditions to
showed that the “Risk-adjusted emission portfolio ensure that all the power can be evacuated.
(MYPD capacity)” scenario was the most likely one to
manifest. This was the recommended and expected IRP REFIT Renewable Generation
scenario. The REFIT programme will be going out for procurement
in the near future. The REFIT offers special tariffs for the
Therefore the TDP Generation Plan for the period 2011 following renewables:
to 2020 is based on this scenario as detailed in the IRP • Wind
report. The detail of this plan is discussed below: • Small hydro
• Landfill gas
Return to Service stations • Concentrating solar thermal
The Return-to-Service (RTS) units at Grootvlei and • Solar photovoltaic
Komati power stations are approved projects which are
assumed to be completed in 2010 and 2011 as per the The total REFIT generation is expected to be 725MW,
project schedules. with wind generation allocated 400MW. There is
presently no indication of the REFIT applicants that will
DoE OCGT power stations be granted licences by NERSA, and they are widely
The IRP indicates that the Department of Energy (DoE) dispersed geographically. The 325MW of REFIT stations
will implement the two OCGT power stations in 2011. other than wind are not modelled for purposes of the
These are assumed to be as previously proposed by the TDP due to the uncertainties surrounding both their
DoE with one close to the Dedisa MTS and the other location and output.
close to the Avon MTS. They will be based on 147MW
units and will be modelled as follows: The 400MW REFIT Wind may be a small number of large
• 2 x 147MW units at Dedisa wind farms or a large number of small wind farms. This
• 5 x 147MW units at Avon makes it difficult to model in the transmission network
files. Based on the location of wind and applications for
These are treated as peaking plant in the TDP studies wind generation connection, it has been decided to
and are used under contingency conditions or if required model the 400MW as four representative wind farms
4 Transmission Ten-Year Plan 2011-2020of 100MW which represent a cumulative total of 400kV line energised at 275kV will be constructed from
generation at that point. They are connected directly to the Moamba site directly to the 400/275kV substation
the 132kV busbars of existing MTS substations. in Maputo. A new 275kV line (60km) between the
Moamba site and the Infulene substation in Maputo is
The four MTS substations are: also proposed.
• Juno (2011)
• Proteus (2011) The Moamba total capacity is 664MW, modelled as two
• Aurora (2012) 332MW units. This will be a base load power station
• Bacchus (2012) which will be run during system peak, but can be scaled
down during low load conditions if required.
In addition, it is assumed that the Eskom 100MW
wind farm at Sere will also be established in 2011 and Ingula pumped storage
integrated as per the study proposal. The Ingula pumped storage power station is an
approved project which is assumed to have units 1 and
Since these are intermittent sources of generation in 2 completed in 2013 and units 3 and 4 completed in
the TDP studies, they are studied under two conditions, 2011 as per the project schedule.
namely:
• Zero output at system peak Base Load Coal
• Full output at system peak The Base Load Coal power stations at Medupi and
Kusile are approved projects; the new units of which
This is to determine the capacity and potential weakness are assumed to be completed between 2012 and 2017
under both generation conditions. as per the project schedules and in line with the IRP.
It is acknowledged that significantly more wind An additional base load coal power station is required,
generation may be connected to the network before which is assumed to be the proposed Coal 3 power
2020. However, it is difficult to determine the exact station at Lephalale, close to the Medupi site. The first
transmission requirements for the TDP without the unit will come on line in 2017 with an additional unit
actual location and size of the wind farms. Taking into each year until there are 4 units by 2020. This is in line
account that the normal average load factor of wind with the IRP. The assumed size is 750MW units with a
farms is of the order of 35%, this means that they will projected sent out power of 714MW per unit.
not have a significant impact on the capacity design of
the network. The applications for wind farms will be Nuclear 1 Generation
handled on a case by case basis, but only the above The Nuclear 1 site, selected for the purposes of the
allocated 500MW of wind generation has been included TDP, is the Thuyspunt site near Port Elizabeth. Although
in the TDP studies. it is acknowledged that the site selection has not been
completed, the Thuyspunt site is the preferred site from
Moamba OCGT Generation a transmission aspect. The initial unit size is assumed
The Moamba project is a proposed OCGT power to be a 1500MW unit for the purposes of the TDP
station in Mozambique, situated approximately 30km studies in line with the IRP assumption. Obviously, the
from the South African border near Komatipoort. integration requirements will change if a different site is
The power station will be integrated by looping in the selected, and may change if the size or the number of
existing 275kV line to the site. In addition, a new 60km units change.
© Eskom 2011 5Co-generation Projects and MTPPP It is the responsibility of the relevant Eskom Chief
There are a number of initiatives to introduce co- Planning Engineers to identify if there will be any change
generation projects into the Eskom power system. to the embedded generation within their respective
These have the effect of essentially reducing the grids within the TDP period. Changes in the embedded
demand at the point on the network where these generation will only be accounted for and included in
co-generation plants are connected. However, the the TDP studies if there is a high level of confidence in
network is still required to be able to supply the load if the changes.
the co-generation plant is not in service.
Demand Side Management programmes
As a result, they do not have a significant impact on The IRP has a large component of Demand Side
the network capacity design. In certain cases, the Management (DSM) which is proposed to exceed
co-generation may exceed the local load and the power 5000MW by 2020. However, there are no details
transfer into the system will have to be accommodated. provided on how and more importantly where this
These will have to be treated on a case by case DSM will be achieved. If such a large amount of DSM
basis to determine if they will have a significant is achieved, it would have effectively altered consumer
impact on the network. Therefore co-generation behaviour and should be reflected in the load forecast.
projects were not considered for the TDP studies. The transmission grid is still required to be able to supply
the projected load demand in case the DSM does not
One specific programme is the MTPPP programme materialise. The DSM is therefore not considered for
which offers PPA contracts to any generators that fall the purposes of the TDP studies for the period 2011
below a certain price level. The expected level of the to 2020.
MTPPP generation in the IRP is around 420MW. Except
for one large co-generation project and one medium Imported Power Options
size co-generation project, the rest are all below 20MW. Several generation project opportunities in the Southern
Effectively, these are all co-generation projects and are African region are currently being actively investigated
therefore not included in the transmission network and pursued by Eskom to identify which projects could
model for the TDP studies. Instead they will be treated be economically and strategically justified. However, the
on a case by case basis as specified above. IRP did not consider any significant levels of imported
power by 2020 other than the Moamba OCGT project
Embedded Generation and no other imports will be considered for the
There are a number of embedded municipal generation purposes of the TDP studies apart from existing plant
power plants within the network such as Kelvin in (e.g. Cahora Bassa).
Johannesburg and Rooiwal in Tshwane. These have been
accounted for in the load demand forecast and are
assumed to be available. No communication is known
with regard to these embedded generation plants
increasing output, reducing output or shutting down
within the TDP period. In the IRP, allowance is made for
some generation reduction, but there is no correlation
or allocation to specific power station units. Therefore
these reductions are ignored for the transmission
network model.
6 Transmission Ten-Year Plan 2011-2020Potential imported power projects were treated as New Generation summary
separate sensitivity analysis studies in the 20 year A summary of the new plant and the year that the
transmission strategic grid studies. last unit at the power station becomes commercially
available is given in Appendix A. These generation units
Any promising imported power projects can then were assumed to be in service at the expected dates.
be included and incorporated in future TDP updates
once a sufficient level of confidence in the timing and This is graphically illustrated in Figure 2 2 below and
implementation is attained. Figure 2 3 on the next page.
Assumed New Generation Capacity
2010 TDP-Plan
Figure 2.2: Power station capacity introduction by year
The proposed OCGT IPP plants to be provided by peak load periods or during emergencies, making
the Department of Energy (DOE) are not specifically it necessary to plan the network to meet local load
included in the studies. However, the two known sites without them being available for use.
in the East and South Grids have been studied, and
effectively, only the feeder bays at the relevant Eskom It is also acknowledged that the Tubatse (or Lima)
MTS substations are required to integrate them into pumped-storage scheme project near Steelpoort has
the network. been put on hold, but most of the infrastructure will still
be required for system reliability purposes in order to
These plants are designed for operation only during meet the needs of local loads.
© Eskom 2011 7Figure 2.3: Planned Power Station Capacity by 2020
3. Major Factor Changes from Previous TDP
There have been some changes in the factors influencing The changes in the Load Forecast from the previous
the selection and timing of projects for the TDP from TDP are also due the revised/improved allocation of
the previous TDP. The main factor was related to an the expected load and load growths at the relevant
even better understanding of the geospatial load centres load busbars based on a geospatial analysis of the
and forecast, and the potential generation scenarios. load developments. These changes were based on
the strategic grid planning analysis and newly available
These two factors are briefly discussed in this section as information.
background to the motivation of the projects and their
timing in the TDP. As a result, some of the load has moved between
substations and the need for new substations has been
3.1 GEOSPATIAL LOAD FORECAST identified. The improved distribution of the demand
forecast resulted in a number of new projects being
The effects of the economic crisis have resulted in a required within the TDP period as well as several of
significant impact on the demand in late 2008 and early the projects identified in the previous TDP being
2009. Hence the load forecast presented in this report reconfigured or re-phased. These changes were
indicates relatively smaller system load demand as undertaken in consultation with the Transmission Grids,
compared to the load forecast presented last year. Distribution and the major Metro authorities.
8 Transmission Ten-Year Plan 2011-20203.2 GENERATION ASSUMPTIONS It is proposed to implement two HVDC schemes with
a HVDC converter station in the vicinity of Coal 3 to
The major change in the generation assumptions from cater for the final configuration of six 750MW units.
the previous TDP is the inclusion of Wind Generation. Coal 4 is assumed to be out of this TDP period.
The Coal 3 generation is still assumed to be in the The HVDC lines will connect to HVDC rectifier terminal
Waterberg area, close to Medupi and in line with the stations in Gauteng and Kwa Zulu Natal (Central and
current project development with the target date for East Grids).
the first units in 2016.The integration of the first units at
Coal 3 will utilise the new Delta 765/400kV substation Nuclear 1 is considered, as in the previous TDP, to be
and the Delta-Epsilon lines will be energised at 765kV. located at the Thuyspunt site.
4. Completed Projects Since Last TDP
This chapter contains a list of projects completed for commissioning in FY2010/11. Over and above that,
since the last TDP. A project may consist of a number there are other projects that were not mentioned
of sub-projects, which may be placed into commercial in that plan (due to the fact that they were near
operation before the entire project is completed. This is completion) that have since been concluded.
done to ensure that the network and customers enjoy
the benefits of the new assets as soon as practicable. Central Grid
The installation of the 3rd and 4th transformers at
4.1 COMPLETED GENERATION INTEGRATION Lepini substation is completed.
PROJECTS
The transformers that were planned to be commissioned
According to the Transmission Ten-Year Plan 2010-
in 2010 were at Croydon, Eiger and Esselen substations.
2019, some RTS power stations were anticipated to
Esselen has been completed. Croydon and Eiger are
be completed in 2010. Parts of some of these projects
outstanding.
have since been completed, and the resultant benefits
are being realised.The completion status of the projects
Western Grid
is as follows:
There were no projects planned to be commissioned
in 2010/11.
Grootvlei RTS: generator bays 5 and 6 are still
outstanding and completion is anticipated in the
2011/12 financial year. East Grid
The construction of the Majuba Umfolozi 400 kV (765
Komati RTS: generator bays 4, 5, 6, 7, 8 and 9 are kV design) is completed.
still outstanding, and completion is anticipated in the
2011/12 financial year. Unit 3 was commissioned. The transformers that were planned to be commissioned
in 2010 were at Hector and Eros substations. Both
4.2 UPDATE ON TRANSMISSION RELIABILITY these projects have been completed.
This section discusses all the projects that were North East Grid
reflected in the Transmission Ten-Year Plan 2010 2019 The projects for the installation of additional
© Eskom 2011 9transformation capacity at Malelane and Marathon North West Grid
substations are in progress. The 400kV line projects There were no projects planned to be commissioned
planned to be commissioned in 2010 have not been in 2010/11.
completed.
4.3 GRID CONNECTIONS APPLICATIONS
North Grid
The planned Spitskop, Marang, Witkop and Spencer Table 4 1 outlines the number of Indicative Quotations
transformer projects for 2010/11 are completed. (IQ’s), Feasibility Quotations (FQ’s) and Budget
Quotations (BQ’s) that have been processed during the
South Grid period January 2010 to December 2010. These are as
There were no projects planned to be commissioned a result of applications for grid connections, as per the
in 2010/11. Grid Code.
Grid Indicative Quotations Feasibility Quotations Budget Quotations
Issued Issued Accepted Issued Accepted
Central 0 8 6 4 3
East 0 2 1 1 1
North East 4 9 4 3 2
North West 3 0 0 0 0
North 2 15 5 0 0
South 11 3 0 2 2
West 16 3 2 3 2
Total 36 40 18 13 10
% Acceptance 45% 77%
Table 4.1: Connection Applications Quoted and Accepted
As shown in Table 4 1 above, the number of opportunities to improve this performance. There
customer applications for grid connections processed have been a high number of Indicative Quote
is fairly high. Acceptance rates have increased when applications (most of the 36 applications above)
compared to last year. Furthermore, analysis and received to connect Renewable Energy Generation
consultation with customers is required to understand onto the Transmission Grid.
10 Transmission Ten-Year Plan 2011-20205. National Overview
The map in Figure 5 1 below shows a high-level relative location of the new transmission lines and the
view of the major TDP scheme projects where the associated MTS substations are indicated schematically.
Figure 5.1: Map showing relative location of the major TDP scheme projects
A summary of the major new assets that are
either approved or proposed to be added to
the transmission system over the next ten years
are listed in Table 5.1 on the following page.
© Eskom 2011 11TDP New Assets Total
HVDC Lines (km) 1,700
765kV Lines (km) 6,085
400kV Lines (km) 8,083
275kV Lines (km) 741
Transformers 250MVA+ 100
Transformershorizon of the TDP up until 2030. The objective of this transmission lines that will be constructed over this
strategic study was to align the transmission network period.There are also a number of series compensation
with the requirements of the generation future options projects required on the 765kV and 400kV lines
and the growing and future load centres. This Strategic required to improve the power transfer capability of
Grid Study has enabled the 10- year TDP to be aligned the Cape power corridors.
with the future long-term development of the whole
Eskom system. Two new SVCs are proposed to support the
Northern Cape (West Grid) and the proposed Sishen-
The addition of over 72 000 MVA of transformer capacity Saldanha Spoornet expansion, namely a +200/-100
to the transmission system is an indication of both the MVAr SVC at Aries and a smaller one of +45/-100
increasing load demand and the increasing firm capacity MVars at Garona.
requirements of the customers.Approximately 2 800 MVars
of capacitive support are required to support areas Some projects have associated distribution projects to
of the network under contingency conditions to enable customers to benefit from them. For example,
ensure that the required voltage levels are maintained. a new MTS substation may require distribution
They also improve system efficiency by reducing infrastructure to link it to the existing distribution
network losses. network or to connect new bulk loads. Distribution
infrastructure and individual feeder bays to connect
Approximately 14 900 MVArs of reactors are a direct distribution infrastructure or bulk loads are not
result of the long lengths of both 765kV and 400kV reported on individually in this report.
© Eskom 2011 136. Breakdown of the TDP Projects by Grid
6.1 CENTRAL GRID
The Central Grid consists of four customer load The expected peak CLN demands by 2020 and
networks (CLNs), namely; Johannesburg, Vaal Triangle, the average percentage load increase for the period
West Rand and Nigel. The current transmission for each CLN are given in Table 6.1 on the following
network and CLNs are shown in Figure 6 1 below. page.
Figure 6.1: Current Central Grid network and CLNs
Table 6.1: Current Central Grid network and CLNs
14 Transmission Ten-Year Plan 2011-2020Actual Peak Load Forecasted Load (MW) Ave. Annual %
CLN
2009 (MW) 2011 2016 2020 Load Increase
Johannesburg 4202 4432 5720 6550 4.2
West Rand 1980 2221 2287 2553 1.4
Nigel 1668 1907 1979 2082 1
Vaal Triangle 1262 1459 1560 1627 1.1
Table 6.1: Central Grid CLN load forecast and percentage load increases
The TDP schemes for the Central Grid consist substations. The integration of Medupi and Kusile
of extending the 275kV network (built at 400kV power stations will result in the Central Grid 400kV
insulation level to allow for future upgrade to 400kV) network being strengthened as well. The increase
the installation of additional transformers at existing in transmission assets by end 2015 and end 2020
substations, as well as the construction of seven new and the cumulative total is shown in Table 6-2.
Transmission Assets New Assets expected in New Assets expected Total New
for Central Grid 2011 - 2015 in 2016 - 2020 Assets expected
Total kms of line 623 329 952
765kV Lines (km) 0 0 0
400kV Lines (km) 597 295 892
275kV Lines (km) 26 34 60
Total installed
3,095 6,340 9,435
Transformer MVA
Transformers (no. of) 8 14 22
Capacitors (no. of) 8 0 8
Reactors (no. of) 0 0 0
Table 6.2: New transmission assets for the Central Grid
© Eskom 2011 156.1.1 JOHANNESBURG CLN
Especially in the Lulamisa and Lepini supply areas, in the area, including many national and regional
Johannesburg North and Midrand respectively, the company head offices. There is also considerable
energy growth has been increasing for the past five residential development for all income groups, as well as
years at 5.7% per annum with an associated increase of new shopping centres and office parks.The main growth
6% per annum in the demand. The Lepini 3rd and 4th in business activity is in the services industries and head
275/88kV 315MVA transformer and Lulamisa 400/88kV or regional offices.
315MVA were commissioned in 2009. The City Power
substations Delta, Fordsburg and Prospect will also The main projects in the Johannesburg CLN are
be experiencing considerable load growth. The Kelvin described below. Almost all of the projects are the
power station is still assumed to be in service as City same as those in the previous ten-year plan but most
Power have not formally notified Eskom of any change of the dates have changed. This is due to a number
in status. of reasons such as increased certainty where projects
are done in collaboration with customers, delays in
The type of load supplied by the Johannesburg CLN is servitude acquisitions and reprioritisation of projects. A
very important in terms of the profile of the businesses similar trend is noticeable for all other grids and CLNs.
Croydon Transformation strengthening
• Third 275/132kV 250MVA transformer at Croydon MTS 2010
Johannesburg North – Phase 2 Network Strengthening
• Apollo-Lepini 275kV line 2013
• Lepini Ext 275kV 2x 150MVar capacitors 2012
Johannesburg Reactive Power Project
• Eiger and Jupiter 88kV 48MVAr shunt capacitor bank 2012
• Croydon and Benburg 132kV 72MVAr shunt capacitor 2012
Decommissioning of the Apollo 400kV fault limiting reactors
• Decommissioning of the Apollo 400kV fault limiting reactors 2012
Johannesburg East Strengthening
• Phase 1A: Esselen MTS Strengthening 2010
o 2nd 275/88kV 315MVA transformer
• Phase 1B: Esselen MTS Strengthening 2015
o Operate Esselen-North Rand No.1 132kV line (16km) at 275kV and line bank 1x 275/132kV
500MVA transformer at Northrand MTS from Esselen MTS.
• Phase 2: North Rand MTS Strengthening 2016
o Construct 400kV Busbar operated at 275kV
o Operate Esselen-North Rand No.2 132kV line (16km) at 275kV and connect 1st and 2nd
275/132kV 500MVA transformers to Northrand MTS 275kV busbar.
16 Transmission Ten-Year Plan 2011-2020Johannesburg East Strengthening continued
• Phase 3 A-D: Jupiter B MTS Integration 2014
o Matla- Jupiter B 1&2 400kV (150km) operated at 275kV.
o New Jupiter B MTS with 10x 275kV line bays and 275kV busbar (New 400/275kV MTS site
required to contain 4x 400/275kV transformers)
o Turn the Matla - Esselen 275kV line and Matla – Benburg 275kV line into Nevis MTS and
disconnect section of Matla Nevis section of the Matla - Benburg and Matla - Esselen 275kV Line
o Apollo - Esselen 3 400kV (12km) operated at 275kV.
• Phase 3 E-F: Sebenza Integration 2017
o New 400kV Sebenza MTS operated at 275kV.
o Loop-in the Sebneza -Prospect 1 and 2 275kV line (loop-in built at 400kV) and Jupiter - Fordsburg
275kV and Jupiter – Prospect 275kV line into Jupiter B MTS.
o Construct 2x 400kV lines from North Rand to Sebenza MTS.
Soweto Strengthening Phase 1 (built at 400kV, operated at 275kV)
• Establish new Quattro MTS 275kV *busbar 2014
• Build 2x 275kV Quattro-Etna 15km *lines 2014
Soweto Strengthening Phase 2 (built at 400kV, operated at 275kV)
• Establish Quattro 132kV yard with 2x500MVA 275/132kV transformers 2016
Simmerpan MTS Strengthening – Phase 1(built at 400kV, operated at 275kV)
• Construct 400kV Busbar operated at 275kV at new Simmerpan MTS 2015
• Operate Jupiter –Simmerpan 1&2 88kV line at 275kV and connect 1st and
2nd 275/88kV 160MVA 2015
Simmerpan Strengthening – Phase 2 (built at 400kV, operated at 275kV)
• Establish Simmerpan 132kV yard with 2x250MVA 275/132kV transformers 2016
Kyalami 400kV Strengthening
• Construct Kyalami 400/132kV GIS MTS 2014
• Loop Kusile - Lulamisa 400kV line into Kyalami MTS 2014
(This is dependent on Kusile Integration)
HVDC Terminal B
• Establish an HVDC converter station close to Jupiter B MTS 2017
• Build an 800kV HVDC line from Terminal B to Coal 3 via Selemo (Epsilon) 2017
© Eskom 2011 176.1.2 WEST RAND CLN
This CLN consists of six transmission substations supplying both residential and industrial loads. The load growth in
this CLN is stable; no new large loads are expected. The main projects in the West Rand CLN are as follows:
Establishment and Integration of Demeter 400 kV Substation
• Install new Demeter 400/88kV MTS 2x 315MVA transformers.
• Loopin the Proposed Verwoerdburg – Pluto 400kV 400kV line into Demeter 400kV(30km) 2015
West Rand Reinforcement
• Westgate B 400/132kV substation (1st 500MVA transformer) 2017
• Hera-Westgate B 1st 400kV line 2017
• Taunus-Westgate B 1st 400kV line 2017
• Taunus Ext 400/132kV transformation (1 x 500MVA) 2017
• Etna-Taunus 1st 400kV line (energised @ 400kV) 2017
• Glockner-Hera 1st 400kV line 2017
• Glockner-Enta 1&2 400kV lines operated at 400kV 2017
• 400kV Busbar at Etna S/S 2017
• Construct Etna 2x800MVA 400/275kV 2017
6.1.3 NIGEL CLN
This CLN consists of six substations which are supplied from Lethabo power station (via Brenner), Matla power station
(via Nevis and Benburg) and Kriel (via Zeus-Grootvlei). Grootvlei and Benburg show considerable load increases.
In 2013, load will be moved from Snowdon to Kookfontein, thus reducing the loading on Snowdon.
The main projects in the Nigel CLN are as follows:
Snowdon Transformation Upgrade
• Replace 4x 275/88kV 90MVA with 3x 160MVA transformers 2012
Benburg Transformation Strengthening
• Install a third 275/132kV 250MVA transformer at the Benburg MTS 2016
Nevis Transformation Strengthening
• Install a third 275/132kV 500MVA transformer at the Nevis MTS 2017
Siluma 275/88kV MTS Establishment
• Establish new Siluma MTS 2017
• Loop the Lethabo–Eiger, Snowdon–Brenner into Siluma 2017
• Loop the Brenner–Eiger 275kV line into Siluma 2017
• Install 2x 275/88kV 315MVA transformers 2017
18 Transmission Ten-Year Plan 2011-20206.1.4 VAAL CN
This CLN consists of seven transmission substations and one power station supplying both residential and heavy
industrial loads. The anticipated high load growth nodes are at Makalu and at Kookfontein MTS. The main projects in
the Vaal CLN are as follows:
Vaal Strengthening Phase 1 (Closing of the Hera-Bernina 275kV link)
• Uprating of terminal equipment at Hera, Bernina, Taunus, Princess, Westgate, Glockner, Kookfontein, Verdun and
Scafell S/S
• Bernina S/S refurbishment
• Glockner 3rd 400/275kV 800MVA transformer
• Glockner 275kV Busbar replacement to tubular 2011
Vaal Strengthening Phase 2 (Glockner-Etna 2x400kV lines operated at 275kV)
• Glockner-Etna 1&2 400kV lines operated at 275kV
• 2x 275kV lines bays at Glockner S/S
• 2x 275kV lines bays at Etna S/S 2011
Kookfontein Transformation Phase 1 strengthening involves the addition of 2 x 88kV 48 MVAR
capacitor banks at Kookfontein substation. 2011
Kookfontein Transformation Phase 2 strengthening involves the 3rd 275/88kV 315MVA transformer and
3rd Glockner Kookfontein 275kV line (Customer dependent) 2015
A network diagram showing the major projects in the Central Grid is shown in Figure 6.2 below:
Figure 6.2: Central Grid network diagram
© Eskom 2011 196.2 EAST GRID
The East Grid consists of four CLNs namely, Ladysmith, Newcastle, Empangeni and Pinetown. The current transmission
network and CLNs are shown in Figure 6.3 below.
Figure 6.3: Current East Grid network and CLNs
The expected area peak demands by 2011, 2015 and 2020 and the average percentage load increase for the period
for each CLN are given in Table 6 3 below.
Forecasted Load (MW) Ave. Annual %
CLN
2011 2016 2020 Load Increase
Ladysmith and Newcastle 1292 1390 1590 2.3 %
Empangeni 2227 2308 2638 2.7%
Pinetown 3515 3777 4490 3%
Table 6.3: East Grid CLN load forecast and percentage load increase
The TDP scheme projects for the East Grid consist primarily of the strengthening of the 400kV networks that
transmits power into Empangeni and Pinetown CLNs and the introduction of 765kV. In addition to the above
TDP scheme projects, there are other projects that are listed in the project summary list which are required to
strengthen the network.
20 Transmission Ten-Year Plan 2011-2020The increase in transmission assets by end-2015 and end-2020 and the cumulative total are shown in Table 6 4.
Transmission Assets New Assets expected New Assets expected Total New
for Eastern Grid in 2011 - 2015 in 2016 - 2020 Assets expected
Total kms of line 1,310 392 1,702
765kV Lines (km) 580 280 860
400kV Lines (km) 730 107 837
275kV Lines (km) 0 5 5
Total installed
9,295 7,710 17,005
Transformer MVA
Transformers (no. of) 10 10 20
Capacitors (no. of) 0 0 0
Reactors (no. of) 6 2 8
Table 6.4: East Grid new transmission assets
6.2.1 LADYSMITH and NEWCASTLE CLNs
The Ladysmith and Newcastle CLNs are agricultural, with coal mining and associated industries in the Newcastle CLN.
The Tugela third transformer project in the previous ten-year plan has been cancelled as load can be shifted to other
stations during contingencies. The following projects are planned:
Strengthening in these CLNs entails addressing N-1 transformer contingencies and they are as follows:
• Looping into Bloukrans, the Venus – Tugela 275kV Line 2013
• Normandie 2nd 250MVA - 400/132kV transformer 2013
• Incandu 3rd 315MVA - 400/132kV transformer 2014
• Normandie 3rd 160MVA - 400/88kV transformer 2016
As part of the Generation plans, there is a project to integrate Ingula Power station in 2012 as follows:
• Loop in Majuba - Venus 400kV Line
• Construct new Ingula - Venus 400kV Line
© Eskom 2011 216.2.2 EMPANGENI CLN
The Empangeni CLN consists mainly of industrial load. The load profile for this area is fairly flat. There are four 400kV
lines that supply power into this network, with 275kV lines linking this CLN to the Pinetown CLN via Impala substation.
The following strengthening is proposed:
Empangeni Strengthening Phase 1 (under construction)
• Completion of the Majuba-Umfolozi 765kV line operated at 400kV 2010
Empangeni Strengthening Phase 2
• Establish Theta 400kV switching station 2013
• Construct Umfolozi-Theta 765kV line to be operated at 400kV 2013
• Loop Umfolozi-Athene 400kV line into Theta 2013
• Loop Umfolozi-Invubu 400kV line into Theta 2013
• Construct Theta-Invubu 400kV line 2013
Empangeni Strengthening Phase 3 2015
• Establish Lambda 400/765kV substation next to Majuba Power Station
• Establish 765/400kV at Mbewu (Theta)
• Convert Majuba - Umfolozi – Mbewu (Theta) line to Lamda – Mbewu (Theta) and operate at 765kV
Pinetown-Empangeni Interconnection (previously Pinetown Phase 3)
• Construct Sigma–Theta 400kV first and second Lines (double circuit) 2015
Empangeni Strengthening Phase 4 2016
• Establish 400/765kV at Camden
• Construct Camden – Mbewu (Theta) 765kV line to be operated at 765kV
• Install 2nd 765/400kV Transformer at Mbewu (Theta)
6.2.3 PINETOWN CLN
The Pinetown load is mostly residential and commercial in nature. There are four 400kV and two 275kV lines that
supply power into this network. As mentioned under Empangeni CLN, the Pinetown and Empangeni CLNs are linked
with a 275kV line via Avon substation. The following major projects are planned:
Pinetown Strengthening Phase 1
• Establish Sigma 400kV switching station 2013
• Construct Majuba-Sigma 765kV (via Venus) line operated at 400kV 2013
• Construct new Sigma-Hector 2x 400kV lines. 2013
Pinetown Strengthening Phase 1B
• Recycle Venus –Georgedale line into second Venus–Ariadne 400kV line
Pinetown Strengthening Phase 2 2015
• Establish 765/400kV at Sigma 2015
• Convert Majuba-Sigma line to Zeus-Sigma and operate at 765kV 2015
A geographical network diagram indicating the major projects in the East Grid for the ten-year period is shown
in Figure 6.4.
22 Transmission Ten-Year Plan 2011-2020Figure 6.4: East Grid geographical network diagram
© Eskom 2011 236.3 NORTH GRID
The North Grid consists of five CLNs namely, Waterberg, Rustenburg, Lowveld (northern part), Warmbad and
Polokwane. The current transmission network and CLNs are shown in Figure 6.5 below.
Figure 6.5: Current North Grid network and CLNs
The expected peak demands by 2016 and 2020 and the average percentage load increase for the period for each
CLN are given in Table 6 5 below.
Peak Load Forecasted Load (MW) Ave. Annual %
CLN
(MW) 2009 2016 2020 Load Increase
Waterberg 544 1107 1443 9.78
Rustenburg 1704 2438 2732 4.43
Lowveld North 1456 2099 2315 4.39
Warmbad 271 243 261 -0.23
Polokwane 1177 1712 1808 4.16
Table 6.5: North Grid CLN load forecast and percentage load increases
24 Transmission Ten-Year Plan 2011-2020The Northern Grid load growth is mainly due to platinum group metals (PGM) and ferrochrome mining and processing
activities located in the Rustenburg, Polokwane and Steelpoort areas. The load demand for the years from 2009 to
2020 is expected to reflect the average annual percentage load increases shown in Table 7-3-1 above.
The TDP Scheme Projects for the Northern Grid consist of extending the 400kV and 275kV networks as well as
establishing the 765kV network, the integration of two power stations (Medupi and Coal 3) and the installation of
additional transformers at existing and new substations.
These main schemes are as follows:
• Tabor and Spencer in the Polokwane area consists of 275kV and 400kV reinforcements.
• Rustenburg 400kV reinforcement.
• Medupi and Coal 3 power stations 400kV and 765kV integration.
• Brits 400kV reinforcement.
The TDP scheme projects for the North Grid consist of extending the 400kV and 275kV networks as well establishing
the 765kV network, the integration of two power stations (Medupi and Coal 3), and the installation of additional
transformers at existing and new substations. The increase in transmission assets by end-2015 and end-2020 and the
cumulative total are shown in Table 6.6.
Transmission Assets New Assets expected New Assets expected Total New
for Northern Grid in 2011 - 2015 in 2016 - 2020 Assets expected
Total kms of line 2,816 820 3,636
765kV Lines (km) 700 0 700
400kV Lines (km) 2,116 670 2,786
275kV Lines (km) 0 150 150
Total installed
3,820 9,500 13,320
Transformer MVA
Transformers (no. of) 10 8 18
Capacitors (no. of) 0 0 0
Reactors (no. of) 6 2 8
Table 6.6 North Grid new transmission assets
© Eskom 2011 25You can also read