Fire & Emergency Services - 2020-2023 Business Plan & 2020 Budget - City of Mississauga
←
→
Page content transcription
If your browser does not render page correctly, please read the page content below
Fire & Emergency
Services

2020–2023 Business Plan
& 2020 Budget
Foreword

        Our Vision for the Future
        Mississauga will inspire the world as a dynamic and beautiful global city for creativity and
        innovation, with vibrant, safe and connected communities; where we celebrate the rich
        diversity of our cultures, historic villages, Lake Ontario and the Credit River Valley. A place
        where people choose to be.

Mississauga City Council approved Our Future Mississauga; a Strategic Plan to achieve this vision over a 40-year timeframe. The City
engaged over 100,000 people to develop this Vision Statement. To achieve this vision the City has identified five Strategic Pillars for
Change: move, belong, connect, prosper and green. Each year the City proposes various initiatives that are aligned with the Strategic
Pillars and are intended to bring us closer to fulfilling our vision for the future. The City has over 300 lines of business which are
consolidated into the 16 Services Areas (including the Stormwater Program) that are outlined in this Plan. The 2020-2023 Business Plan &
2020 Budget document details how and where the City plans to allocate resources to deliver programs and services.

The City is committed to providing programs and services cost effectively. In this Plan we have outlined measures that will help us assess
the quality, efficiency and customer satisfaction that our services achieve. The results help inform decisions on resource allocation and
direct program offerings, and improve service delivery to ensure our vision is efficiently realized.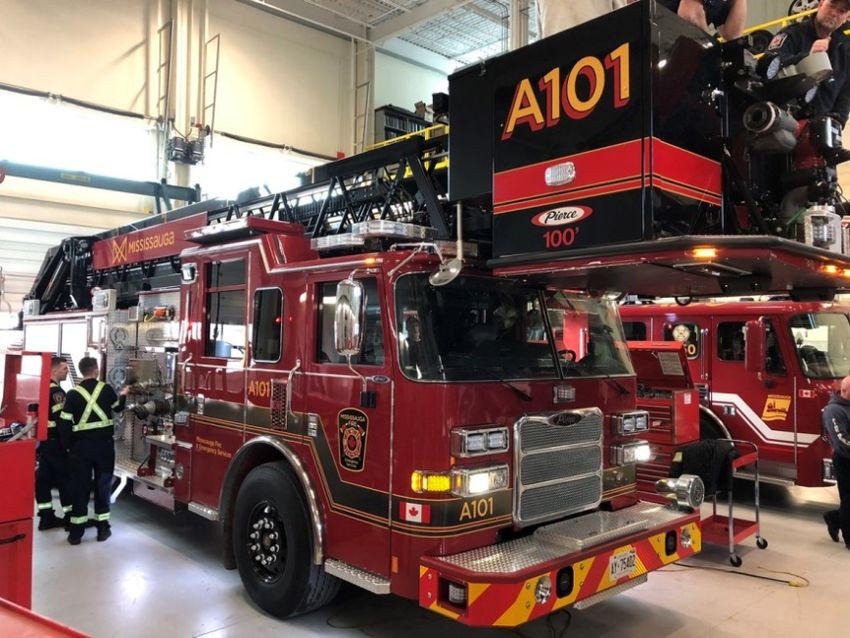
Table of Contents
Executive Summary of Fire & Emergency Services.................................................................................................................................... 3
Core Services .................................................................................................................................................................................................. 4
   Vision, Mission, Goals of Service and Service Delivery Model..................................................................................................................... 4
   Current Service Levels and Trends............................................................................................................................................................... 5
   Performance Measures and Results........................................................................................................................................................... 11
   Balanced Scorecard .................................................................................................................................................................................... 13
   Awards and Achievements.......................................................................................................................................................................... 14
The 2020-2023 Business Plan Outlook ....................................................................................................................................................... 15
   Planning for the Future................................................................................................................................................................................ 15
   Finding Efficiencies ..................................................................................................................................................................................... 20
   Advancing the City’s Strategic Plan ............................................................................................................................................................ 21
   Transforming our Business with Technology .............................................................................................................................................. 22
   Maintaining Our Infrastructure..................................................................................................................................................................... 23
   Managing Our Human Resources............................................................................................................................................................... 25
Proposed Operating Budget ........................................................................................................................................................................ 29
   Operating Budget Details ............................................................................................................................................................................ 30
       Proposed Budget by Program................................................................................................................................................................. 30
       Summary of Proposed Budget ................................................................................................................................................................ 31
       Proposed Cost Increase Required to Maintain Current Service Levels.................................................................................................. 32
       Proposed New Initiatives and New Revenues ........................................................................................................................................ 33
Proposed Capital Budget ............................................................................................................................................................................. 54
       Proposed 2020-2029 Capital Budget by Program .................................................................................................................................. 54
       Proposed 2020-2029 Capital Budget by Funding Source ...................................................................................................................... 55
       Proposed 2020 Capital Budget Detail ..................................................................................................................................................... 56
       Proposed 2020-2029 Capital Budget by Sub-Program .......................................................................................................................... 57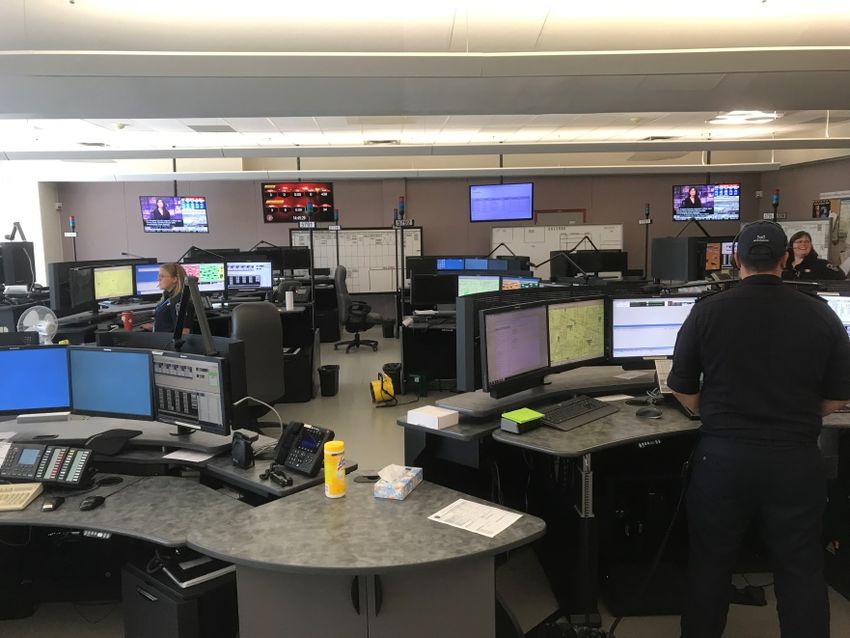
Executive Summary of Fire & Emergency Services
                                          Mission: To protect life, property, and the environment in Mississauga from all risks through
                                          education, enforcement, engineering, emergency response and economic incentive.

Services we provide:                                                       Highlights of the Business Plan include:

•   Public Education                                                       •      Implementation of targeted public education programs
                                                                                  based on risk
•   Code Enforcement
                                                                           •      Implementation of proactive fire and life safety inspection
•   Fire Plans Examination
                                                                                  programs based on risk
•   Emergency Dispatch
                                                                           •      Execution of long-term fire station infrastructure plan that
•   Emergency Response                                                            considers the building condition along with the health and
                                                                                  safety requirements of existing fire stations
•   Fire Cause Determination
                                                                           •      Implementation of the Infrastructure Renewal Strategy
                                                                           •      Development and delivery of staff certification based on
Interesting facts about this service:
                                                                                  National Fire Protection Association (NFPA) standards
•   Responds to an average of 30,000 incidents each year
                                                                           •      Contribution to the Public Safety Fire Reserve Fund
•   Forty-five per cent of fire calls do not have a working smoke                 equivalent to one per cent of the tax levy ($5.1 million) to
    alarm on the fire floor                                                       provide funding for six additional fire stations over the next
                                                                                  12 years, enhance Fire’s public education programming and
•   Seventy-four per cent of structure fires are in residential
                                                                                  enhance the development of the proactive fire inspection
    occupancies
                                                                                  program
•   Between 2014 and 2018 there were 52 civilian injuries and
    10 civilian fatalities due to fire in the city of Mississauga; 90
    per cent of the fatalities and 87 per cent of the injuries were            Net Investment ($000s)     2020      2021       2022      2023
    in residential occupancies                                                 Operating                121,072   130,435    140,242   143,281
                                                                               Capital                   13,047    10,771     10,898    13,218

                                                                               Full Time Equivalents      769.0     784.0      811.0     832.0

2020-2023 Business Plan & 2020 Budget                                                                                                        C-3
Core Services
Vision, Mission, Goals of Service and                                Service Delivery Model
Service Delivery Model
The service delivery model is built to support the programming
and deployment of resources required to reduce, mitigate or             Fire & Emergency
                                                                             Services
eliminate community risk as it relates to fire and emergency
services.

                                                                            Fire Prevention &
Vision                                                                          Life Safety
To be a global leader in Fire Service and Life Safety excellence.

Mission
                                                                             Administration
To protect life, property and the environment in the City of
Mississauga from all risks, through education, enforcement,
engineering, emergency response and economic incentive.

                                                                             Operations &
Goals of Service
                                                                            Communications
•     Reduce community risk
•     Improve targeted fire and life safety public education
      programming
                                                                              Professional
•     Enhance the delivery of proactive fire safety inspections              Development &
                                                                              Accreditation
•     Implement long-term infrastructure renewal strategy
•     Align all training programs with recognized industry
      professional standards
                                                                              Capital Assets
•     Continue to use and develop practices that provide financial
      and business sustainability

C-4                                                                        2020-2023 Business Plan & 2020 Budget
Current Service Levels and Trends
The most effective way to identify and address trends and
service level challenges within the industry is to assess overall
community risk as it pertains to fire and life safety.
The process of assessing community risk is receiving increased
attention. Risk assessment has become fundamental to the
planning and delivery of fire and emergency services to match
the “needs and circumstances” of the community as defined by
the Fire Protection and Prevention Act, 1997, (FPPA) and the
Council-approved Establishing and Regulating By-law. The
quantification of risks has assisted Mississauga Fire &
Emergency Services to integrate risk mitigation strategies into
the planning and delivery of fire protection services.
Demographics
Population and Age
                                                                                         Movie Night, Celebration Square
Specific age groups are at a higher risk from fire related
incidents. For example, Canada’s aging population has been
recognized as one of the most significant demographic trends in         Provincial Fire Fatalities by Age Group
the nation. Based on preliminary post-census estimates from                                             % of Provincial          % of fire
                                                                          Category          Age
Statistics Canada there were more Canadians over the age of 65                                           Population              fatalities
(16.1 per cent of the population) than there were children aged         Children/Youth    =65        15                    33
table, seniors account for a much higher percentage of fire             Source: Ontario Office of the Fire Marshal and Emergency Management
fatalities than their proportion of the population.                                (OFMEM) Fire Statistics and 2011 census data

                                                                        People aged 65 and over represent approximately 13.6 per cent
                                                                        of Mississauga’s population, yet represent 33 per cent of the fire
                                                                        fatalities. Consideration must also be given to people aged 50-64
                                                                        as they make up 21 per cent of Mississauga’s population, and
                                                                        represent a future risk.

2020-2023 Business Plan & 2020 Budget                                                                                                    C-5
The population within a community can shift at various times         Summary of Key Demographic Trends
during the day or week and throughout the year. Population shift
                                                                     •   13.6 per cent of the population in Mississauga is aged 65
can be the result of a number of factors, including employment,
                                                                         and over and at an increased risk of experiencing a fatality in
tourism and education. One way to measure this population shift
                                                                         a residential fire
is based on traffic counts. Within the Greater Toronto and
Hamilton Area, there is a transportation census conducted that       •   Twenty-one per cent of the population in Mississauga is
provides insight into the travel habits of residents in the region       aged 50-64, representing a future risk
called the Transportation Tomorrow Survey (TTS). The most
                                                                     •   Nearly 500,000 people visit Mississauga in a typical day,
recent TTS reporting year (2016) indicates that, in one 24-hour
                                                                         creating an increased risk of motor vehicle collisions
period, 1,480,100 trips were made to Mississauga. Of those
trips, approximately 83 per cent were in a personal vehicle (as      Building Stock
driver or passenger) and 33 per cent (488,000 trips) were for the
                                                                     Residential
purposes of going to work or school. These metrics suggest that
at a minimum 488,000 people are coming to Mississauga during         The overall number of structure fires within both the City of
a typical weekday. The survey results indicate that the number of    Mississauga and the Province of Ontario is declining even as the
users on Mississauga’s road network can be greatly affected by       population continues to grow. The decrease can be linked to a
these daily population shifts. A higher risk may be present during   stronger focus on fire prevention and public education, and
peak commuting times. This has an impact on the number and           revised legislative standards. While the overall number of
complexity of motor vehicle collisions on both city streets and      structure fires has decreased, the proportion of structure fires
highways. In 2018, Fire & Emergency Services responded to            occurring in residential occupancies has increased.
over 3,200 motor vehicle collisions.
Language
Fire & Emergency Services continuously looks for ways to get
fire safety messages out to residents whose first language or
language of choice is not English. English is the primary
language spoken in 62.7 per cent of households in Mississauga.
The city has a greater proportion of households that speak
multiple languages at home (9.8 per cent) compared to the
province as a whole (4.5 per cent). There are over 211,000
households (or 27 per cent) that speak a single language at
home that is neither English nor French. After English, the top
three languages spoken are Urdu, Arabic, and Polish.

                                                                                                Garage Fire

C-6                                                                                         2020-2023 Business Plan & 2020 Budget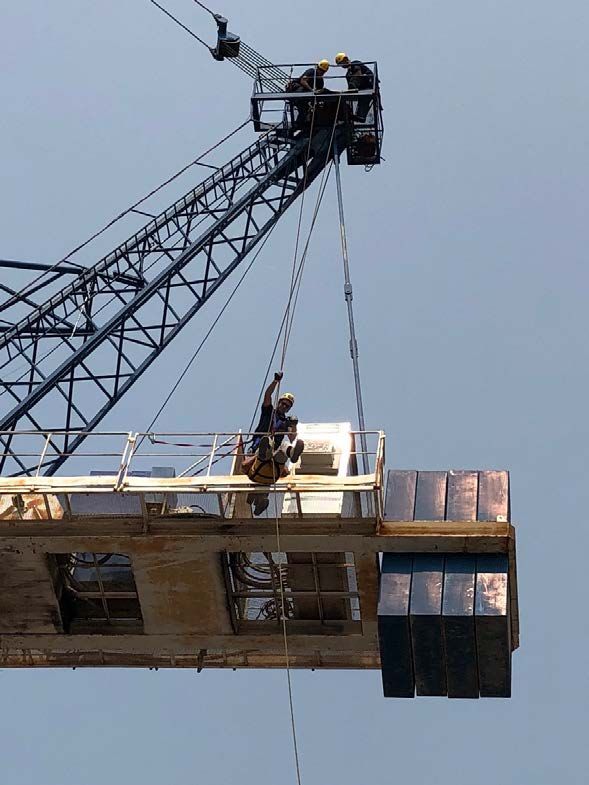
In the City of Mississauga 95.8 per cent of the city’s buildings are   It is also much higher than the provincial average of 7.3 per cent.
residential occupancies. This includes single-family dwellings,        Industrial occupancies have been identified as a key fire risk for
multi-unit residential, and hotels/motels. To put this in              the city.
perspective, for the period from 2014 to 2018, residential fires in
                                                                       Many of these occupancies are large buildings, such as
the city accounted for 77 per cent of all structure fires.
                                                                       industrial plants and warehouses that contain combustible
Fires in high-rise buildings can place significantly higher            materials. The combination of the size and contents can result in
demands on fire suppression activities. In other words, more           extended response times and challenging conditions for
resources are necessary. This is referred to as “vertical              firefighters.
response”. It is the initial deployment of firefighters and
                                                                       Summary of Key Building Stock Trends
equipment to upper level storeys for suppression, medical or
other types of incidents.                                              •   Structure fires are decreasing: however, the proportion of
                                                                           structure fires occurring in residential occupancies is
                                                                           increasing
                                                                       •   Ninety per cent of all fatalities and 87 per cent of all injuries
                                                                           are in residential occupancies
                                                                       •   Industrial fires account for 11.6 per cent of fire loss in
                                                                           Mississauga, whereas the provincial average is 7.3 per cent

                                                                       Fire Loss
                                                                       Civilian Fire Injuries and Fatalities
                                                                       Between 2014 and 2018 there were 52 civilian injuries and 10
                                                                       civilian fatalities in the city of Mississauga. The majority were in
                                                                       residential occupancies.
                                                                       Fire Cause
                                                                       In 2018, as indicated in the table that follows, more than half of
                      Mississauga Cityscape                            the fires in the city were unintentional. The “unintentional”
                                                                       category recognizes such things as playing with matches,
                                                                       smoking, unattended cooking and equipment failures.
Industrial
Industrial occupancies represent 1.9 per cent of the city’s
property stock and almost 12 per cent of the city’s fire loss over a
12-year period. The fire loss trend across the city is much higher
than expected given the actual number of industrial occupancies.

2020-2023 Business Plan & 2020 Budget                                                                                                    C-7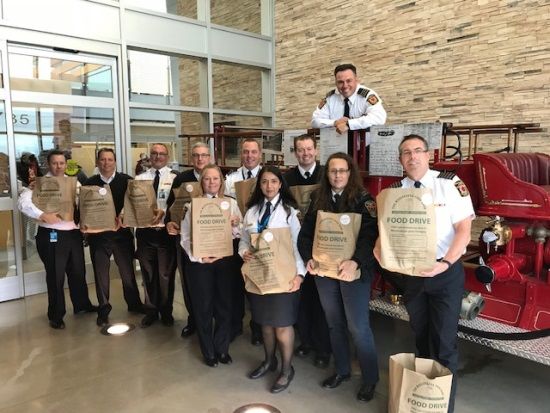
Fire Cause                                                                                          Summary of Key Fire Loss Trends, 2014-2018:
Intentional                                                                                         •   Sixty-two per cent of 2018 fires were caused unintentionally
                                                                     # of Fires % of Fires
Vandalism                                                                       20            7%
                                                                                                    •   Fifteen per cent of fires were caused by electrical or
Arson                                                                            2            1%        mechanical failure
TOTAL Intentional                                                               22            8%    •   Thirty per cent were caused by unattended cooking/candles
Unintentional
                                                                                                        and/or discarded smoking materials
Design/Construction/Installation Deficiency                                      2            1%
Routine Maintenance Deficiency (ie lint, grease buildup)                         6            2%    •   Forty-five per cent of fire calls did not have a working smoke
Unattended Cooking/Candles                                                      46           15%        alarm on the fire floor
Improperly Discarded Smoking/Other Materials                                    46           15%
Used or Placed too Close to Combustibles                                         9            3%
Mechanical/Electrical Failure                                                   47           15%
Other                                                                           35           11%
TOTAL Unintentional                                                        191               62%
Undetermined
Undetermined Cause                                                              84           27%
Other
Natural Cause                                                                    3            1%
Exposure                                                                         6            2%
TOTAL Other                                                                      9            3%

Smoke Alarms
Data over the past four years indicates that 45 per cent of fire
calls analyzed do not have a working smoke alarm on the fire
floor. The law says that all residential occupancies must have a
working smoke alarm on every floor.
The table that follows illustrates the number of times a smoke
alarm was present and operating on the floor or in the suite of
fire origin over the past four years.
                                                                                                                      Maintain Your Smoke Alarms
SA Operation                                  2014   2015   2016   2017   2018   TOTAL        %
No smoke alarm                                 89     99     96     88    102        474     33%
Smoke alarm present and operated               92     92    128     74    120        506     35%
Smoke alarm present, did not operate           46     40     31     35     22        174     12%
Smoke alarm present, operation undetermined    7      9      8      6      8          38     3%
Smoke alarm presence undetermined              48     55     48     46     54        251     17%
Grand Total                                   282    295    311    249    306        1,443   100%

C-8                                                                                                                         2020-2023 Business Plan & 2020 Budget
Fire Response                                                             warranted, Fire & Emergency Services responds in support of
                                                                          Peel Regional Paramedic Service (PRPS). The decision as to
Analysis of historical fire loss and fire call data provides valuable
                                                                          whether Fire responds or not is based on a tiered response
insight into understanding the specific trends within a community.
                                                                          agreement between Fire & Emergency Services and PRPS. In
Call Volume                                                               the vast majority of situations, Fire & Emergency Services can
A summary of the total number of calls within the city from 2014-         provide quicker initial contact with the patient as a result of the
2018 indicates a steady increase in the number of incidents.              geographical disbursement of fire stations across the city.
Overall, the number of calls responded to by Fire & Emergency
Services has increased by 11 per cent from 2014 to 2018.
                                                                          2014-2018 Average Call Volume by Response Type

Call Volume by Year

                                                                           16000                                        15120
                                                                           14000
                                                                           12000
       32000                                    31715                      10000
       31500                            31124                               8000
       31000                                                                6000                           3978                    3622
       30500                   30106                                        4000                                                               2423
       30000                                                                2000     765       606
       29500                                             # of Incidents        0
                       28949
       29000   28655                                                                Fires    Pre Fire  False Alarms    Medical    Rescues      Public
       28500                                                                                Conditions                                      Hazard/Other
       28000
                                                                                                         Average # of Incidents
       27500
       27000
               2014    2015     2016    2017     2018
                                Year

                                                                          Response Time
                                                                          Total response time captures the time interval from the receipt of
Response Type
                                                                          the emergency call to when the first emergency response unit
Understanding the historical call volume and the risks associated         arrives on scene. The major components are:
with each type of call requires a detailed analysis of call type.         Call processing time – The time interval from when the call is
The average annual call volume by response type is illustrated in         acknowledged at the communications centre until response
the following chart.                                                      information begins to be transmitted to the emergency response
Medical calls are 53 per cent of Fire & Emergency Services call           units.
volume. Eighty-nine per cent of those are related to asphyxia (or         Turnout time – The time interval from when the transmission
other respiratory condition) or chest pains/suspected heart               from the call centre begins and the truck leaves the station.
attack. Medical response is provided by the closest available
unit. Calls to 9-1-1 are evaluated by dispatchers and, if

2020-2023 Business Plan & 2020 Budget                                                                                                                 C-9
Travel time – The time interval from when the truck leaves the Summary of Key Fire Response Trends:
station until it arrives on scene.
• Call volume has increased 11 per cent from 2014 to 2018
The National Fire Protection Association (NFPA) total response
• Eighty-nine per cent of medical calls are related to asphyxia,
time target is 384 seconds 90 per cent of the time for first
respiratory conditions, chest pains or suspected heart
arriving vehicle on scene.
attacks
The chart that follows illustrates Fire & Emergency Services’
• Total response time increased to 536 seconds in 2018,
actual city-wide total response time.
which is a 1.3 per cent increase over 2017
Total Response Time Performance
600 536
523 529
500
423 425 428 Total Response
400 Time Performance
Excluding Medical
300 Calls (sec)
Total Response
200
Time Performance
for Medical Calls
100
Only (sec)
0
2016 2017 2018
Auto Extrication Training
C-10 2020-2023 Business Plan & 2020 Budgetfloor or the presence could not be determined. The goal is to
Performance Measures and Results improve public fire safety education and decrease this measure
The City of Mississauga is committed to delivering services to zero.
economically and efficiently. The City’s performance measures Number of Fire Safety Inspections Completed is a measure that
are used to help assess how well we are doing at achieving our captures the number of times Fire Prevention Inspectors conduct
goals and where we need to improve operations. The results inspections on properties in Mississauga. In 2018, 9,256
also inform decision making and strengthen accountability. inspections were completed. Fire & Emergency Services is
Balanced Scorecard working towards establishing a robust, proactive fire and life
safety inspection program. This program will include an
A Balanced Scorecard groups measures in four key areas of an appropriate inspection cycle for all occupancy types depending
organization’s performance: Financial, Customer, Employee, and on the risk level.
Business Process. By paying attention to all four areas, an
organization can retain balance in its performance and ensure Employee Measures
that it is moving toward the attainment of its goals. Strategic Leadership – This measurement identifies how Fire &
Below are descriptions of the measures tracked in this Service Emergency Services employees rate and/or are satisfied with
Area’s Balanced Scorecard. The Balanced Scorecard that the strategic leadership of the division. It is measured via a
follows shows trends since 2016 and expected outcomes up to corporate employee survey administered every three years. The
2023. goal is to increase the percentage over time through employee
engagement.
Financial Measures
Innovation – Also measured via the corporate employee survey,
Cost Per Capita for Emergency Services is a measure that this measurement identifies how satisfied employees feel about
indicates how efficiently we are using our resources and is a being empowered to try new business processes and their
particularly useful measure when comparing with other similar perceptions of management’s acceptance of change. The goal is
municipalities to gauge effectiveness. The goal is to balance to increase the percentage satisfaction over time.
operational effectiveness, community safety and fiscal
responsibility. Internal Business Process Measures
th
Dollar Loss related to Fires is a measure that indicates the First Unit Total Response Time (all calls excluding medical – 90
estimated dollar loss related to fire damage. The goal is to Percentile) captures the time interval from the receipt of the
decrease the dollar loss annually. emergency call to when the first emergency response unit
arrives on scene. The major components are: call processing
Customer Measures time, turnout time and travel time.
% Incidence of No Working Smoke Alarm on Fire Floor – This The NFPA total response time target is 384 seconds 90 per
measure helps illustrate how effective Fire & Emergency cent of the time for first arriving vehicle on scene.
Services public education programming is with respect to fire
safety. Based on data collected over the past five years, 45 per
cent of fire calls do not have a working smoke alarm on the fire
2020-2023 Business Plan & 2020 Budget C-11th
First Unit Total Response Time (medical calls only – 90 Number of Fire Code Decisions Resulting in Prosecutions – Fire
Percentile) captures the time interval from the receipt of a & Emergency Services will prosecute for non-compliance with
medical call to when the first emergency response unit arrives on the Ontario Fire Code. These are instances where an inspection
scene. The major components are: call processing time, turnout order was issued for non-compliance and no action was initiated
time and travel time. to rectify the infraction or there was a blatant disregard of the
Fire Code. The goal is to ensure business/building owners
The NFPA total response time target is 364 seconds 90 per
understand their responsibilities and obligations under the
cent of the time for first arriving vehicle on scene.
Ontario Fire Code and reduce the number of prosecutions
Number of Fire Safety Inspection Orders Issued – this measure annually. To do this, buildings will be inspected at a frequency
is a way of determining how effective the fire safety inspection that reflects the risk.
program is and how well Fire Code compliance issues are
understood and addressed. An inspection order can be issued
when a fire safety inspector deems there is a compliance issue
where a property has not been maintained to an acceptable fire
safety level. If the property owner does not comply with the
order, charges will be levied. The goal is to educate the public on
the importance of compliance and reduce the number of
inspection orders issued annually. A proactive inspection
program and robust public education program are expected to
contribute to a reduction in issued inspection orders.
C-12 2020-2023 Business Plan & 2020 BudgetBalanced Scorecard
Measures for Fire & Emergency 2016 2017 2018 2019 2020 2021 2022 2023
Services (Actual) (Actual) (Actual) (Plan) (Plan) (Plan) (Plan) (Plan)
Financial:
Cost per Capita for Emergency
132.89 137.17 137.42 147.50 155.04 166.20 177.81 180.76
Services ($)
Dollar Loss Related to Fires
101.3 38.7 60.9 10.0 5.0 5.0 5.0 5.0
($Millions)
Customer:
% Incidents of No Working Smoke
Alarm on Fire Floor (or presence 56% 68% 58% 58% 55% 30% 25% 20%
could not be determined)
Number of Fire Safety Inspections
9,757 8,212 9,256 9,719 10,205 10,715 11,251 11,813
Completed
Employee:
Employee Survey Scores:
N/A N/A 66.2 N/A N/A 80.0 N/A N/A
Division Leadership (%)
Employee Survey Scores:
N/A N/A 59.9 N/A N/A 75.0 N/A N/A
Innovation (%)
Internal Business Process:
First Unit Total Response Time for
all calls excluding medical (sec at 523 529 536 540 538 536 534 532
th
the 90 percentile)
First Unit Total Response Time for
th
medical calls (sec at 90 423 425 428 432 430 428 426 424
percentile)
Number of Fire Safety Inspection
218 283 219 200 180 160 140 120
Orders Issued
Number of Fire Code Decisions
4 33 40 45 40 35 25 20
resulting in Prosecutions
2020-2023 Business Plan & 2020 Budget C-13Awards and Achievements
D Shift Crew, Station 101 receive Recruit Class Fundraiser for Big
Mayor's One Bag Challenge in support
Mississauga Real Estate Board Brothers Big Sisters Peel
of Mississauga Food Bank
Firefighter of the Year
Eden Food Bank Christmas Food MFES Benevolent Fund Donation to
Camp Ignite - Young Women learning
Drive Family affected by house fire
about a career in firefighting
C-14 2020-2023 Business Plan & 2020 BudgetThe 2020-2023 Business Plan Enforcement
It is the responsibility of a property owner/building manager to
Outlook ensure they comply with all applicable regulations and statutes.
To support a robust, proactive fire and life safety inspection
Planning for the Future program, Fire & Emergency Services is developing an inspection
program that establishes appropriate inspection cycles for all
Key Areas of Focus occupancy types based on key risks. This program will also
include the use of operations staff to assist with the delivery of
Education
fire safety inspections in collaboration with Fire and Life Safety
A priority for the 2020-2023 Business Plan is to establish a staff.
dedicated fire and life safety education section within Fire
The table below illustrates the inspection frequency and required
Prevention and Life Safety with a mandate to develop,
resourcing by property classification. This model meets the
implement and measure fire and life safety education
minimum requirements relating to the organization and
programming. The programming is to be based on risk and
deployment of fire prevention inspections outlined in the NFPA
activities will be prioritized based on highest risk. The risks
Standard 1730, 2016.
identified in the 2019 Fire and Emergency Services Master Plan
document will be used to inform and develop new public
education initiatives. This will include a proactive smoke alarm
and home escape planning program. It will also enhance the fire Inspection
Occupancy Type
safety education delivered by operations staff in the field. Frequency
Operations staff comprise the largest number of front-line Assembly occupancy Biennial
personnel. Therefore on-duty staff can reach a large number of Institutional occupancy (currently legislated to
residents effectively and can support public education efforts. Annual
conduct proactive inspections annually)
To meet the requirements of the Fire Protection and Prevention Residential occupancy - Midrise is 6-12
Annual
Act as well as community needs, additional public education storeys
officers will be required: two in 2020 to work proactively with the Residential building over 12 storeys Annual
fire safety inspectors and front-line fire crews on midrise fire Business and personal services occupancy Biennial
safety, and two in 2021 to develop educational programming Industrial occupancy - High hazard Annual
directed at Industrial High Hazard occupancies. This initiative will Factory industrial uses - Moderate hazard Biennial
be funded through the Public Safety Fire Program Reserve Warehousing and storage facilities - Moderate
Biennial
Fund. to Low hazard
Teaching people to be the stewards of their own fire safety has
proven to have a positive impact on the number and severity of
fire related injuries and deaths.
2020-2023 Business Plan & 2020 Budget C-15A total of 29 Fire Safety Inspectors will be required over the next information during emergency exercises or during an actual
four years to complete the proactive fire safety inspection event.
program: 10 in 2020 to complete midrise occupancies and
Emergency Response
continue annual inspections; seven in 2021 to address high
hazard industrial occupancies; six in 2022 to complete medium There are two major components identified in this business
hazard factory industrial, assembly and business occupancies; planning cycle that will significantly impact emergency response
and six in 2023 to complete the factory industrial occupancies. capabilities.
Engineering 1. Construction and location of new fire stations
The way that buildings are constructed has a major impact on 2. Optimization of response deployment model
the safety of their occupants. Plans examiners are required to The primary goal is to have stations located so that the travel
ensure that all assigned fire and life safety requirements of the time for the first arriving vehicle from a station to the location of
Ontario Building Code and the Ontario Fire Code are addressed an incident can be four minutes or less, 75 per cent of the time.
prior to the issuance of a building permit. The application of Travel time is one component of total response time and is the
building code requirements during the plans examination most difficult to control. To combat growth and congestion
process is a critical component to reduce risk. As new challenges, the plan is to construct six new fire stations over 12
construction is expected to increase, a fire safety engineer is years. This does not include fire station 120 at Hurontario and
being requested in 2021 to improve the turnaround time for those Fairwind Drive which is currently funded and under construction.
permit applications that are complex and require alternative This station is expected to be open before year end 2019.
solutions.
The use of new and emerging technologies to mitigate risk is an
ongoing trend in the industry. When supported by appropriate
resourcing and good policy, technology can be extremely
effective in improving service. One of the examples of
technology that is being requested to improve service is software
that will improve disaster response. The Office of Emergency
Management has been working on the development of a
business continuity strategy for the City of Mississauga. This
includes the development of business continuity plans for all
major areas of service delivery. These plans are intended to
guide the City’s response to a major disaster or disruption and
ensure that city services can be restored quickly. Once the
business continuity program is completed there will be 150
individual business continuity plans. A software/database-driven
application is being considered to store, process, update and
manage this data. It will also effectively deliver and report critical New Fire Station 120 Construction
C-16 2020-2023 Business Plan & 2020 BudgetFactors to consider: Construction and Location of Fire Stations
• More than 95 per cent of the city’s total building stock is As part of the master planning process, priority areas across the
residential occupancies, which are classified as moderate city were identified where some or all of the following conditions
risk existed:
• There are more than 300 identified vulnerable occupancies • High volume of calls
classified as high risk • Historically deficient response times
• There are over 500 high-hazard industrial properties • Future growth implications
classified as high risk
• Higher risk occupancies/population
• There are more than 300 buildings with a height in excess of
18 metres, which are defined as high-rise buildings and are
classified as high risk
• The City and provincial planning policies have identified
intensification as a primary objective of community growth
that will include a significant component of additional high-
rise buildings in the future
Fire Ground Training
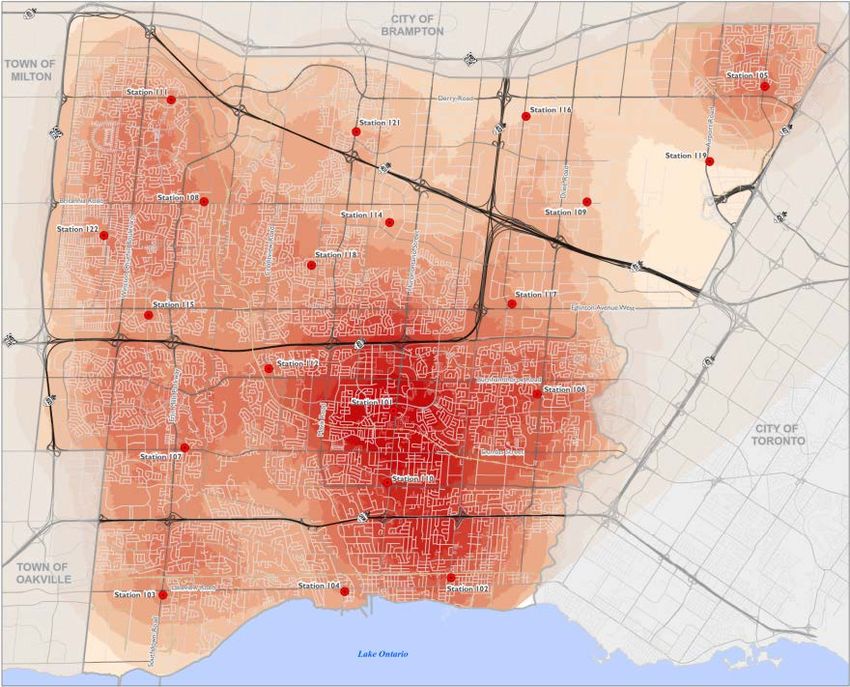
2020-2023 Business Plan & 2020 Budget C-17The following geographic areas were identified in the Fire and
Emergency Services Master Plan as priorities and as
recommended locations for new fire stations. (Sequence to be
based on land availability and risk.)
1. Dundas and Cawthra: Historical call data indicates a high
number of calls that do not meet the response time targets.
There are a large number of high and moderate risk
occupancies in this response area
2. Collegeway and Winston Churchill: This response area is
primarily residential and consists of a mix of single family
dwellings and low to medium rise multi-unit buildings.
Historical call data indicates a high number of calls that do
not meet the response time targets
3. Tenth Line and Aquitaine: This area has a substantial
number of high and moderate risk occupancies. It is an area
identified for future growth
Historical Fire Risk in the City
4. Southdown and Truscott (Lorne Park): This area is
identified as a priority based largely historical response
deficiencies. This is a large geographic area where access
can often be challenging for emergency response vehicles
5. Mavis and Dundas: Historical call data indicates a high
number of calls that do not meet the response time targets.
There are also a substantial number of high-rise/high risk
occupancies that are either directly in this response area or
would be serviced by this station in an adjacent response
area
The optimization of the deployment model addresses the number
and design of facilities, types of vehicles and associated
equipment required to address the risks of the communities they
serve.
C-18 2020-2023 Business Plan & 2020 BudgetSince Fire & Emergency Services provides response to many
different types of incidents, the importance of locating firefighters
with those specialized disciplines and equipment in the right
place is critical to positive outcomes. Location and deployment of
those resources depends on community risk.
High Angle Rescue Training
2020-2023 Business Plan & 2020 Budget C-19Finding Efficiencies
Lean Program Some highlights of the many projects and small improvements
completed include:
The City’s Lean Program focuses on strengthening the
organization’s culture of continuous improvement and instills • Standardizing the tasks, workflows and business processes
Lean concepts and principles as a way of work in every Service related to the Fire component of Building Plans Review and
Area. The program focuses on maximizing customer value and improve customer and stakeholder experience
minimizing waste along with empowering staff at all levels to
• Improving the ordering/delivery of the fire station inventory
problem-solve on a daily basis.
and personal protective equipment
Since becoming permanent in 2016, the Lean program has
• Optimizing the Fire Ministry of Transportation (MTO) Fleet
delivered significant results. Over 219 staff have received
Mandatory Inspection process
introductory White Belt Training; four staff have received
intermediate Yellow Belt Training, and three staff have received • Improving the turnaround time for Fire Safety Inspections
advanced Green Belt Training. Six projects (including rapid
• Creating tools to improve the transparency of procurements
improvements) and 54 small improvements have produced such
and the quality of front-line equipment purchased
enhancements as improved customer experience, faster
processing times, higher quality and lower costs. (For definitions
of classifications, see the Glossary.)
Completed Initiatives Total Benefits
2014- Sept
Improvement Type 2018 Total Type Total
2017 2019
Small Improvement 27 7 20 54 Cost Savings and Avoidance $515,831
Rapid Improvement - 2 - 2 Customer Service Improvements 37
Project 3 1 - 4 Safety Improvements 15
Total 30 10 20 60 Environmental Improvements 17
In-Progress Initiative Goals of the Initiative
Fire Inspection Process –
Implement a process to improve the way fire inspections are arranged, scheduled and attended.
From Assignment to Arrival
Personal Protective
Improve the in-house cleaning process of firefighter personal protective equipment.
Equipment Cleaning
C-20 2020-2023 Business Plan & 2020 BudgetAdvancing the City’s Strategic Plan
The City’s Vision and Strategic Plan are the starting points for
prosper - cultivating creative and
our annual business planning and budgeting cycle. The 40-year
Strategic Plan, Our Future Mississauga, is built on five pillars – innovative businesses
move, belong, connect, prosper, and green. Business plans
are designed to strengthen aspects of these pillars to support the • Combining both operations and fire prevention staff to
attainment of Mississauga’s Vision. conduct fire safety inspections on all mercantile, commercial
and industrial occupancies
Below are examples of how the initiatives of Mississauga Fire &
Emergency Services relate to the Strategic Plan pillars.
green - living green
• Considering Leadership in Energy and Environmental
belong – ensuring youth, older adults Design (LEED) principles when building new and retrofitting
and new immigrants thrive existing buildings
• Developing targeted fire safety education programming
based on risk
• Enhance smoke alarm program
• Community outreach
connect - completing our
neighbourhoods
• Expanding the Proactive Fire Safety Inspection Program
and identifying appropriate inspection cycles to ensure
compliance with the Ontario Fire Code
• Expanding public education programming to target higher-
risk demographics based on results of the Comprehensive
Risk Assessment
Check the Batteries in your Smoke Alarms Regularly
2020-2023 Business Plan & 2020 Budget C-21Transforming our Business with
Technology
The Mississauga Fire and Emergency Services Fire Master Plan
discusses the benefits of leveraging new and innovative
technologies to enhance the delivery of fire and life safety
services. When supported by appropriate resourcing and good
policy, technology can be extremely effective in improving
services.
• Response time – An upgrade to the existing Computer
Aided Dispatch (CAD) and record management system will
enhance the call handling and dispatching, intelligent
mapping, field communications and data reporting and
analysis. This project is funded and is currently underway.
Cost of this project is shared with Brampton and Caledon
fire and emergency services
• Fire Safety Inspections/Code Compliance – Mobile field
technology will increase the number and improve the
delivery of fire safety inspections. Inspection staff will be
provided with mobile technology that will allow them to Joint Fire Communications Centre
access and update files, maps and building data remotely.
This project is funded and is currently underway
• Business Continuity – Business continuity includes the
creation of plans to recover business processes in the event
of a disruption. The requested software would capture key
data about the City of Mississauga’s corporate recovery
needs. It will be instrumental in getting the key internal and
external city business processes up and running as quickly
as possible (BR# 5952)
C-22 2020-2023 Business Plan & 2020 BudgetThe study identified three high priority areas to be included in
Maintaining Our Infrastructure rehabilitation/renovation plans.
Facilities 1. Health and Safety – NFPA standards make reference to the
By the end of 2019 the City of Mississauga will have 21 active need to prevent exposure from exhaust contaminants within
fire stations. Regular maintenance is required to mitigate the the dormitory and living areas as well as the appropriate
wear and tear resulting from operating 24 hours per day, 365 storage and separation of contaminated personal protective
days per year. equipment
2. Accessibility – The City of Mississauga 2015 Facility
Accessibility Design Standards define the specifications for
accessible/barrier-free design for municipal Fire Stations
3. Gender Neutral Washrooms – Many older stations do not
have female washroom facilities. The station audit includes
recommendations for gender neutral washroom/changeroom
facilities
The final report includes recommendations for each station. The
scope varies for each station depending on its assessment
against specific design principles. The audit used City of
Mississauga Accessibility Standards and National Fire Protection
Association facility standards as well as operational
requirements to determine building condition.
This study along with a deployment model review has resulted in
a long-term infrastructure plan. This plan includes the
rehabilitation/renovation of three existing fire stations in the 10-
Fire Station 101 year capital plan.
Fourteen of the 21 stations were built more than 20 years ago.
To address major rehabilitation/renovation concerns, a Building
Condition Audit was conducted to assess the condition of 14 of
the existing fire stations. The primary goals of this study were to:
• Determine the current condition of each station
• Recommend a scope of work required for each station to
meet health and safety standards, comply with building and
fire code standards, meet accessibility requirements and
consider operational requirements
2020-2023 Business Plan & 2020 Budget C-23Equipment Fire & Emergency Services has an inventory of equipment valued at more than $10 million. As an all-hazards fire department, Fire & Emergency Services responds to many different types of calls. These include fires, medical emergencies, motor vehicle accidents, public hazard situations, hazardous material, and technical rescues. All equipment must be tested and evaluated regularly to ensure reliability, and confirm compliance with legislative requirements and manufacturer recommendations. Within the 10-year capital budget there is funding for the purchase of new and replacement equipment to support front- line operations. Vehicles Mississauga Fire & Emergency Services fire trucks provide front- Fire Truck in for Service in Mechanical Bay line service for 12 years, and for an additional three years they serve as reserve vehicles. The 10-year capital budget has funding for the replacement and refurbishment of all fire vehicles in order to maintain the reliability of the fleet. Mississauga Fire & Emergency Services mechanical staff provide fleet services to 45 fire trucks and 55 small and speciality vehicles. They are also responsible for the inspection, repair and testing and/or certification of all firefighting equipment. About 80 per cent of the repairs and services are performed in house at the Garry W. Morden Centre facility. Currently the six Emergency Vehicle Technicians (EVTs) are assigned duties related to heavy fleet (fire truck) annual inspections and demand repairs. A small fleet mechanic is being requested as part of the Proposed 2020 Business Plan & Budget to meet obligations related to small and specialty vehicles as well as the testing and certification of front-line equipment. C-24 2020-2023 Business Plan & 2020 Budget
Managing Our Human Resources
Workforce Analytics                                                        administration staff. Eighty-seven per cent of the labour is related
                                                                           to front-line firefighting operations. Suppression staff are hired for
Of the total staff complement in Fire & Emergency Services, 97
                                                                           spring or fall recruit classes each year to fill vacancies resulting
per cent are unionized. This includes all front-line operations
                                                                           from retirements. Succession planning will be critical as nearly
staff, Fire and Life Safety inspectors, public educators and plans
                                                                           20 per cent of staff are eligible for retirement in the next four
examiners, training, mechanical and the majority of the
                                                                           years.

Our Structure

    Reduce Community Risk                                            Infrastructure Renewal

  Fire Prevention &              Operations &
      Life Safety               Communications                                     Capital Assets

                               Crew Fire                           Facility           New Fire         Fleet Repair &
   Public      Fire Safety                       Emergency
                                Safety
  Education    Inspections
                              Assessment
                                                 Response        Renovations          Stations          Maintenance

          Alignment of Training                                            Financial/Business
               Programs                                                       Sustainability
     Professional
                                    Operations &                                     Administration
    Development &
                                   Communcations
     Accreditation

                                                                     Review &
                                                                                      Application of      Data Update
  Align with      Meet                     Deliver                    Update
   Industry     Operational                On-Shift                                     Corporate             and
                                                                     Strategic
  Sandards     Requirements                Training                                   Lean Program        Maintenance
                                                                     Initiatives

2020-2023 Business Plan & 2020 Budget                                                                                                      C-25
Critical Roles/Functions to Achieve Business Goals Fire & Emergency Services uses the Ontario Fire Administration
Inc. (OFAI) Candidate Testing Services to test potential recruits.
Risk reduction is the primary goal of Fire & Emergency Services.
Through the OFAI, potential candidates complete a three-stage
Functions including public education and enforcement are key to
testing program that includes written testing, psychological
mitigating community risk.
profiling, medical and physical testing, and a skills evaluation.
Education – A robust, targeted public education program is The skills evaluation tests candidates to ensure they have the
proven effective in the prevention of fires by providing people basic skills.
with the tools to help prevent fires as well as the knowledge of
In operations there are over 650 staff at various levels that
what to do in the event that a fire occurs.
require ongoing skills development and upgrade. Staff in the
Enforcement – Proactive fire inspections and code enforcement Professional Development and Accreditation section, in
are critical functions for risk reduction. Existing buildings must be conjunction with on-shift training instructors, develop and deliver
inspected at a frequency that corresponds with the risk (i.e., training programs that ensure the development of new skills
higher risk, higher frequency). along with the maintenance of existing skills. These include such
Engineering – Fire plans examination functions ensure new programs as:
structures are built in compliance with Ontario Building Code and • Fire Ground Operations
the Ontario Fire Code.
• Medical
Emergency Response – To affect outcomes positively and
reduce fire injuries and deaths, front-line operations staff must be • Auto Extrication
able to respond quickly. The number of front-line firefighters and • Specialty Rescue (Confined Space/Trench/Hazmat)
facility placement are significant factors in the ability to meet
appropriate response targets. • Apparatus Operation
Our Talent • IT and Communications
Fire Prevention and Life Safety staff consists of public educators, Staff are encouraged to apply for other related courses to
plans examiners and fire safety inspectors. Specialty training to improve their skills in each area as well as upgrade to react to
NFPA standards consists of: changing codes, building stock and new technologies.
• Fire Inspector (levels 1-3) Fleet mechanics for front-line emergency vehicles require
ongoing training to ensure they maintain their existing skills and
• Public Educator (levels 1 and 2) upgrade to adapt to emerging technologies. Fire fleet mechanics
• Building Code and Fire Protection have Emergency Vehicle Technician (EVT) training and specialty
manufacturer training.
• Fire Investigator
C-26 2020-2023 Business Plan & 2020 BudgetTalent Needs
Emergency Operations staff are hired through a recruiting
process once or twice a year depending on the number of
existing vacancies. In 2020 there are no new firefighters
required. Recent new recruits will fill vacancies resulting from
retirements, resignations and/or long-term absences.
There is high demand for these jobs, so there is no difficulty
attracting qualified candidates. Firefighters and Captains are
promoted based on an internal competitive examination process.
As detailed in the Fire and Emergency Services Master Plan
requirements for 2020 are:
• Two Public Education Officers (BR# 5370) to deliver targeted
public education programming based on risk
• Ten Fire Safety Inspectors (BR# 5371) to support a proactive
fire safety inspection program. Focus in 2020 will be on
midrise occupancies
• Two Training Officers (BR# 5454) to support the ongoing
development and delivery of specialized training programs to
meet National Fire Protection Association certifications
• One small fleet mechanic (BR# 5527) to meet mandated
safety certifications for small fleet and front-line equipment
Live Trench Rescue Training at testing
Garry W. Morden Centre
2020-2023 Business Plan & 2020 Budget C-27Proposed Full Time Equivalent Staffing Distribution by Program
Program 2019 2020 2021 2022 2023
Fire Building Maintenance 3.0 3.0 3.0 3.0 3.0
Fire Support Services 49.0 52.0 56.0 57.0 58.0
Fire Vehicle Maintenance 11.0 13.0 14.0 14.0 14.0
Prevention 55.0 67.0 77.0 83.0 83.0
Suppression 634.0 634.0 634.0 654.0 674.0
Total Service Distribution 752.0 769.0 784.0 811.0 832.0
Note: Numbers may not balance due to rounding.
C-28 2020-2023 Business Plan & 2020 BudgetProposed Operating Budget
This part of the Business Plan sets out the financial resources Proposed Changes for 2020 Net Operating Budget by
required to deliver the proposed 2020-2023 Business Plan. Category ($000s)
Information is provided by major expenditure and revenue
category as well as by program. The costs to maintain existing
service levels and operationalize prior decisions are identified
separately from proposed changes. The budget for 2019 was
$114.6 million and the proposed budget for 2020 is $121.1
million.
Total Changes to Maintain Current Service Levels
The $6.4 million to maintain current service levels includes:
• Labour adjustments of $2.6 million (including annualization
of prior year BRs)
• $3.6 million net transfer to Public Safety Fire Reserve Fund
($5.1 million transfer to reserve, $1.5 million transfer from
reserve for annualization of prior year BRs)
• $150,000 increased fuel costs
• $80,000 equipment repairs and maintenance
New Initiatives
The $71,900 for New Initiatives includes:
• Small Fleet Mechanic
• Continuation of Public Education Programming, Proactive
Fire Inspection Program, and Professional Standards &
Evaluation Program. These are funded by the Public Safety
Fire Reserve Fund
2020-2023 Business Plan & 2020 Budget C-29Operating Budget Details
The following table identifies the budgeted and forecasted operating expenditures and revenues for 2020-2023, as well as the 2019
Budget and 2018 Actuals by major program within the Service Area.
Proposed Budget by Program ($000s)
2020
2018 2019 2021 2022 2023
Description Proposed
Actuals Budget Forecast Forecast Forecast
Budget
Expenditures to Deliver Current Services
Fire Building Maintenance 1,256 1,283 1,328 1,359 1,387 1,409
Fire Support Services 8,439 8,943 9,389 9,569 9,772 9,923
Fire Vehicle Maintenance 4,064 3,747 4,247 4,391 4,449 4,500
Prevention 6,724 7,346 7,598 7,990 8,387 8,712
Suppression 88,257 96,569 103,470 111,782 120,749 123,146
Total Expenditures 108,741 117,886 126,032 135,092 144,744 147,689
Revenues (2,454) (1,957) (2,206) (2,206) (2,206) (2,206)
Transfers From Reserves and Reserve Funds 0 (1,318) (2,826) (2,826) (2,826) (2,826)
New Initiatives and New Revenues 72 375 531 624
Proposed Net Budget Including New Initiatives 106,287 114,611 121,072 130,435 140,242 143,281
& New Revenues
Expenditures Budget - Changes by Year 7% 7% 7% 2%
Proposed Net Budget - Changes by Year 6% 8% 8% 2%
Note: Numbers may not balance due to rounding.
C-30 2020-2023 Business Plan & 2020 BudgetSummary of Proposed Budget
The following table shows the proposed budget changes by description and category. Costs (labour; operational costs; and facility, IT and
support) and revenues are shown by category with the approved 2019 budget for comparison. The three columns to the far right of the
table show the totals proposed for 2020 and their dollar and percentage changes over 2019.
Summary of Proposed 2020 Budget ($000s)
Operating Proposed
Maintain Annualized
2019 Efficiencies Impact of New Special Proposed
Current Prior Year's $ Change % Change
Description Approved and Cost New Initiatives Purpose 2020
Service Budget Over 2019 Over 2019
Budget Savings Capital And Levies Budget
Levels Decisions
Projects Revenues
Labour and Benefits 107,256 774 0 1,869 0 1,053 0 110,953 3,697 3%
Operational Costs 4,676 426 0 0 0 86 0 5,188 512 11%
Facility, IT and Support Costs 1,052 (32) 0 0 0 0 0 1,020 (32) -3%
Transfer To Reserves & Reserve Funds 4,902 5,109 0 0 0 0 0 10,011 5,109 104%
Total Gross Expenditures 117,886 6,277 0 1,869 0 1,139 0 127,172 9,286 8%
Total Revenues (1,957) (250) 0 0 0 0 0 (2,206) (250) 13%
Transfer From Reserves & Reserve Funds (1,318) 0 0 (1,508) 0 (1,067) 0 (3,894) (2,576) 195%
Total Net Expenditures 114,611 6,028 0 361 0 72 0 121,072 6,461 6%
Summary of Proposed 2020 Budget and 2021 - 2023 Forecasts ($000s)
2019 2020
2021 2022 2023
Description Approved Proposed
Forecast Forecast Forecast
Budget Budget
Labour & Benefits 107,256 110,953 116,187 122,676 127,750
Operational Costs 4,676 5,188 5,427 5,466 5,502
Facility, IT and Support Costs 1,052 1,020 1,029 1,048 1,069
Transfer To Reserves & Reserve Funds 4,902 10,011 15,352 21,015 21,015
Total Gross Expenditures 117,886 127,172 137,995 150,205 155,337
Total Revenues (1,957) (2,206) (2,206) (2,206) (2,206)
Transfer From Reserves & Reserve Funds (1,318) (3,894) (5,355) (7,757) (9,850)
Total Net Expenditures 114,611 121,072 130,435 140,242 143,281
Note: Numbers may not balance due to rounding.
2020-2023 Business Plan & 2020 Budget C-31You can also read