ANTIGUA & BARBUDA RENEWABLE ENERGY ROADMAP - IRENA
←
→
Page content transcription
If your browser does not render page correctly, please read the page content below
ANTIGUA & BARBUDA RENEWABLE ENERGY ROADMAP
© IRENA 2021

Unless otherwise stated, material in this publication may be freely used, shared, copied, reproduced, printed and/or stored, provided that
appropriate acknowledgement is given of IRENA as the source and copyright holder. Material in this publication that is attributed to third parties
may be subject to separate terms of use and restrictions, and appropriate permissions from these third parties may need to be secured before
any use of such material.

ISBN 978-92-9260-332-8

CITATION: IRENA (2021), Antigua and Barbuda: Renewable energy roadmap, International Renewable Energy
Agency, Abu Dhabi.

About IRENA

The International Renewable Energy Agency (IRENA) is an intergovernmental organisation that supports countries
in their transition to a sustainable energy future and serves as the principal platform for international co-operation, a
centre of excellence, and a repository of policy, technology, resource and financial knowledge on renewable energy.
IRENA promotes the widespread adoption and sustainable use of all forms of renewable energy, including bioenergy,
geothermal, hydropower, ocean, solar and wind energy, in the pursuit of sustainable development, energy access,
energy security and low-carbon economic growth and prosperity. www.irena.org

Acknowledgements

The roadmap has been developed at the request of the Government of Antigua and Barbuda by the International
Renewable Energy Agency (IRENA). This report has been made possible by funding from the government of Denmark.

This report benefited from the reviews and comments of numerous experts, including Diann Black-Layne, Ezra
Christopher, Melissa Le Blanc (Ministry of Health, Wellness and the Environment), and by Simon Benmarraze, Paula
Nardone, Paul Komor and Arieta Gonelevu Rakai (IRENA).

This work was done under supervision of Roland Roesch and Dolf Gielen.

Available for download: www.irena.org/publications

For further information or to provide feedback: publications@irena.org

Roadmap Development Team

This report was authored by Aakarshan Vaid and Emanuele Taibi (IRENA).

Disclaimer
This publication and the material herein are provided “as is”. All reasonable precautions have been taken by IRENA to verify the reliability of the

material in this publication. However, neither IRENA nor any of its officials, agents, data or other third-party content providers provides a warranty of

any kind, either expressed or implied, and they accept no responsibility or liability for any consequence of use of the publication or material herein.

The information contained herein does not necessarily represent the views of all Members of IRENA, nor is it an endorsement of any project,

product or service provider. The designations employed and the presentation of material herein do not imply the expression of any opinion on

the part of IRENA concerning the legal status of any region, country, territory, city or area or of its authorities, or concerning the delimitation of

frontiers or boundaries.

FOREWORD

              Hon. Sir Molwyn M. Joseph
    Minister of Health, Wellness & The Environment
                 Antigua and Barbuda

Antigua and Barbuda is a small island state with no         system that is based on the utilisation of abundant
known indigenous fossil resources for energy supply;        natural energy resources such as solar and wind.
the country imports 100% of petroleum products to
meet its energy demands. This dependence on fossil          The Government chose to partner with the International
fuels exposes our nation to external shocks and the         Renewable Energy Agency (IRENA) to understand
volatility of the petroleum fuel market. Rising energy      how to set and achieve ambitious climate and energy
costs have impacted communities, households and             goals. Working along with our local team, IRENA has
businesses. The nation’s vulnerability and exposure         provided this report with technical, financial and socially
to risk necessitates the transformation of its energy       feasible pathways for Antigua and Barbuda to utilise our
system to better adapt to the impacts of climate            abundant natural energy resources.
change.
                                                            On behalf of my Government and the People of Antigua
The Government of Antigua and Barbuda, led by Prime         and Barbuda, I want to thank IRENA for the invaluable
Minister Hon. Gaston Browne, has made a commitment          technical support provided to Antigua and Barbuda with
to contribute to keeping global temperature rise well       the production of the Renewable Energy Roadmap, and
below two degrees Celsius. The Government has made a        our national team of professionals for their contribution
written commitment to carbon neutrality by 2050, with       towards this report. We look forward to continued
the aim to not only contribute to emission reductions but   collaboration with IRENA and extend the warmest
more importantly to develop a robust national energy        regards to the staff as we continue our work together.

                                                                                              ANTIGUA & BARBUDA           3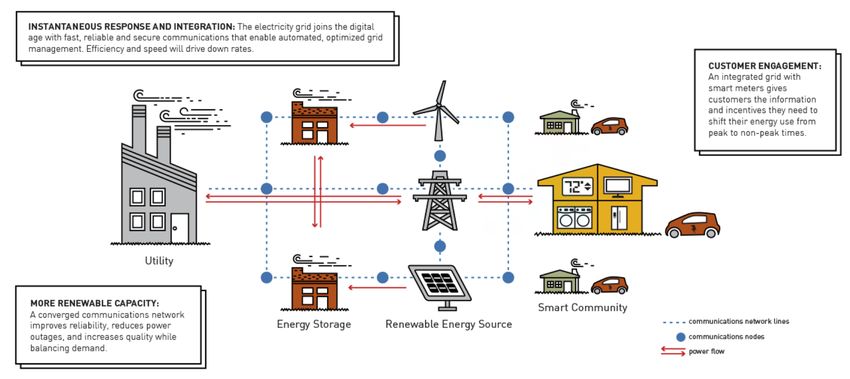
CONTENTS

    FIGURES........................................................................................................................................ 6
    TABLES .......................................................................................................................................... 8
    BOXES .......................................................................................................................................... 9
    ABBREVIATIONS............................................................................................................................ 9
    EXECUTIVE SUMMARY................................................................................................................ 10

    1. INTRODUCTION TO THE ANTIGUA AND BARBUDA ROADMAP.............................................. 14

        1.1		 Roadmap objective...................................................................................................... 14

        1.2 Roadmap analysis overview......................................................................................... 14

    2. SCENARIOS.............................................................................................................................17

    3. KEY ASSUMPTIONS................................................................................................................. 20

        3.1 Demand analysis........................................................................................................... 20

        3.2 Power sector assumptions............................................................................................ 21

        3.3 General techno-economic assumptions.................................................................... 25

        3.4 Transport sector assumptions....................................................................................... 26

    4. RESULTS.................................................................................................................................. 29

        4.1 Current power system................................................................................................... 31

        4.2 Existing plans as of 2020............................................................................................... 33

        4.3 Optimal system.............................................................................................................. 35

        4.4 Optimal system plus EVs............................................................................................... 38

4   RENEWABLE ENERGY ROADMAP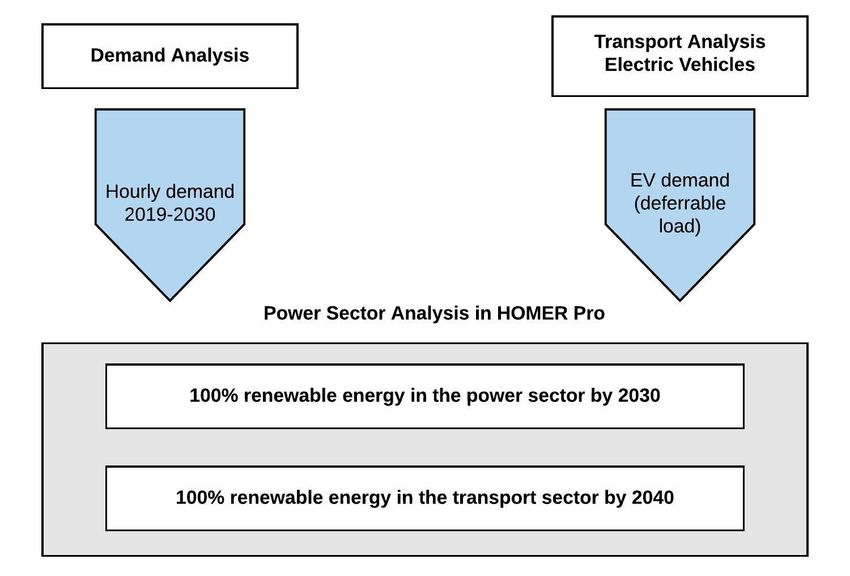
4.5 100% RE (no hydrogen)................................................................................................. 40

    4.6 100% RE (with hydrogen)............................................................................................... 42

    4.7 100% RE (with hydrogen plus EVs)................................................................................ 47

5. BARBUDA .............................................................................................................................. 49

    5.1 Background................................................................................................................... 49

    5.2 Results............................................................................................................................ 50

6. POLICY RECOMMENDATIONS AND CONCLUSIONS ........................................................... 53

    6.1 Recommendations........................................................................................................ 53

    6.2 Conclusions................................................................................................................... 58

REFERENCES............................................................................................................................... 60
ANNEX........................................................................................................................................ 61

                                                                                                                   ANTIGUA & BARBUDA               5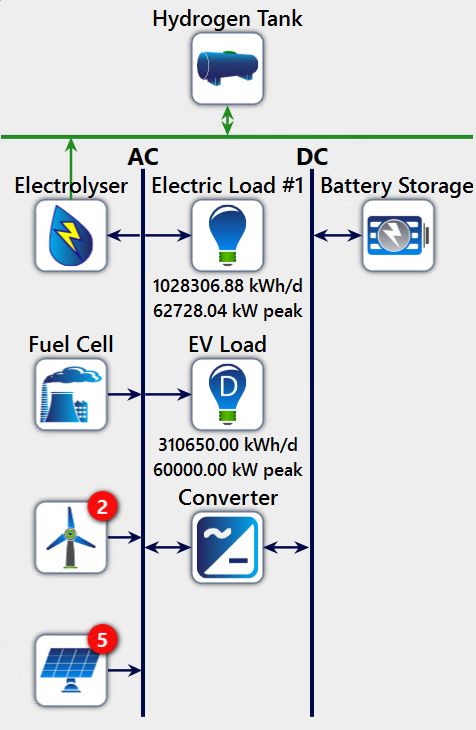
FIGURES
      Figure ES 1: Roadmap overview - renewable energy share and cost of electricity
      					in different scenarios........................................................................................12

      Figure 1:     Roadmap analysis flow chart............................................................................15

      Figure 2: Monthly electricity generation for 2019.............................................................20

      Figure 3:     2019 seasonal load profile..................................................................................21

      Figure 4: HOMER schematic for the .100% RE scenario inclusive of
      			       hydrogen and EVs...............................................................................................22

      Figure 5: EV deployment pathways..................................................................................28

      Figure 6: Roadmap (levelised cost of electricity vs. renewable energy share).............31

      Figure 7:     Share of generation - 2019 system.....................................................................32

      Figure 8: Installed capacity by technology - 2019 system...............................................32

      Figure 9: Hourly dispatch – current power system............................................................33

      Figure 10: Share of generation –. existing plans as of 2020...............................................34

      Figure 11: Installed capacity by technology – existing plans as of 2020.........................34

      Figure 12: Hourly dispatch – existing plans as of 2020......................................................35

      Figure 13: Share of generation –. optimal system...............................................................36

      Figure 14: Installed capacity by technology – optimal system.........................................36

      Figure 15: Hourly dispatch – optimal system......................................................................37

      Figure 16: Hourly dispatch – optimal system minus residential demand
      			        and rooftop PV generation................................................................................38

      Figure 17: Share of generation –. optimal system plus EVs................................................39

      Figure 18: Installed capacity by technology – optimal system plus EVs..........................39

6   RENEWABLE ENERGY ROADMAP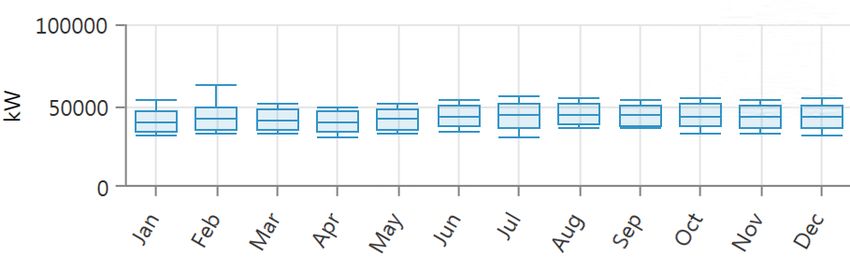
Figure 19: Hourly dispatch – optimal system plus EVs........................................................40
Figure 20: Share of generation .– 100% RE (no hydrogen).................................................41
Figure 21: Installed capacity by technology – 100% RE (no hydrogen)...........................41
Figure 22: Hourly dispatch – 100% RE (no hydrogen).........................................................42
Figure 23: Share of generation –. 100% RE (with hydrogen)...............................................43
Figure 24: Installed capacity by technology – 100% RE (with hydrogen).........................43
Figure 25: Hourly dispatch – 100% RE (with hydrogen)..................................................... 44
Figure 26: Net present costs by component – optimal scenario......................................45
Figure 27: Net present costs by component – 100% RE (with hydrogen) scenario .........46
Figure 28: Share of generation – 100% RE.(with hydrogen plus EVs).................................47
Figure 29: Installed capacity by technology – 100% RE (with hydrogen plus EVs)..........47
Figure 30: Hourly dispatch – 100% RE (with hydrogen plus EVs)........................................48
Figure 31: Share of generation – B
. arbuda optimal system...............................................51
Figure 32: Installed capacity by technology – Barbuda optimal system.........................51
Figure 33: Hourly dispatch – Barbuda optimal system......................................................52
Figure 34: Grid modernisation schematic for Hawaii....................................................... 55
Figure 35: Hawaiian Electric January 2019 Request for Proposals –
capacity vs. prices..............................................................................................56
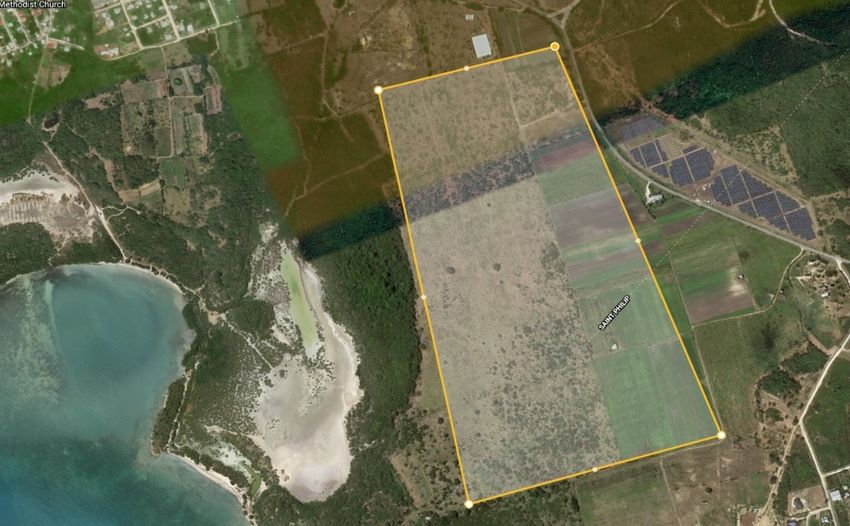
Figure 36: Estimated space required for PV at Parham Ridge Wind Farm site................62
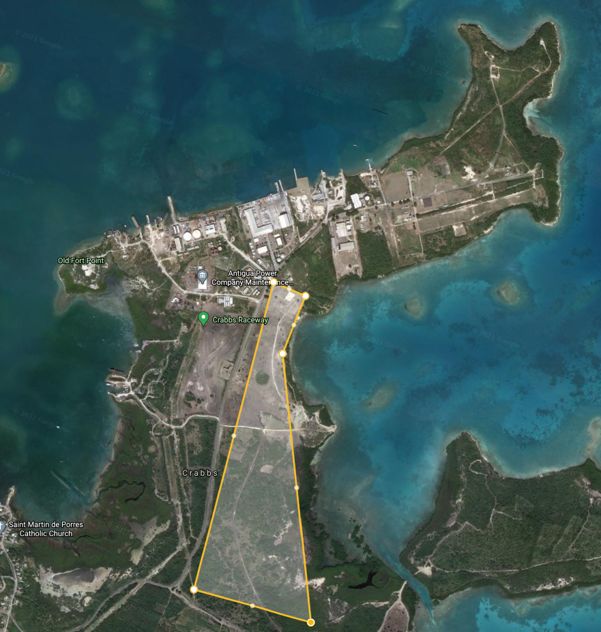
Figure 37: Estimated space required for PV adjacent to the Bethesda array..................62
ANTIGUA & BARBUDA 7TABLES
Table ES 1: Investment requirements for each scenario....................................................12
Table ES 2: EV charger
deployment costs..............................................................................................13
Table 1: Scenarios considered for the roadmap..............................................................18
Table 2: Power plant generation capacity........................................................................21
Table 3: Renewable energy
generation capacity............................................................................................22
Table 4: Summary of key assumptions..............................................................................24
Table 5: Current fleet of vehicles, 2020..............................................................................26
Table 6: Total road vehicles by fuel type, 2020.................................................................26
Table 7: Deployed EVs and assumed daily driving demand ..........................................27
Table 8: Assumed EV charging characteristics and EV load calculation......................27
Table 9: HOMER deferrable load inputs............................................................................28
Table 10: Results of the roadmap........................................................................................30
Table 11: Green Barbuda Study –
results overview.....................................................................................................49
Table 12: Results of the Barbuda roadmap........................................................................50
Table 13: Current power system overall results...................................................................61
8 RENEWABLE ENERGY ROADMAPBOXES
Box 1: How green hydrogen production contributes to achieving a
100% renewable energy share.................................................................................45
Box 2: Successful procurement of solar PV and storage in islands –
the Hawaii example................................................................................................. 54
ABBREVIATIONS
APUA Antigua Public Utilities Authority MW Megawatt
BTM Behind the meter MWh Megawatt-hour
EPC Engineering, procurement and NDC Nationally Determined Contribution
construction
NPC Net present cost
EV Electric vehicle
O&M Operation and maintenance
GWh Gigawatt-hour
RE Renewable energy
IPP Independent power producer
SUV Sport utility vehicle
IRENA International Renewable Energy
Agency PPA Power purchase agreement
kW Kilowatt PV Photovoltaic
kWh Kilowatt-hour USD United States dollar
LCOE Levelised cost of electricity
ANTIGUA & BARBUDA 9EXECUTIVE SUMMARY
In 2019, to support the revision process for the Nationally and voltage stability, required grid investments and
Determined Contributions (NDCs) elaborated under identification of specific projects in precise sites for
the Paris Agreement, the Government of Antigua and solar, wind, storage and hydrogen. IRENA conducted
Barbuda requested assistance from the International a grid integration study in 2016 for Antigua and
Renewable Energy Agency (IRENA) to evaluate potential Barbuda as part of an initiative to analyse the impact
pathways to achieve a 100% renewable energy share of increasing penetration of renewable energy into
by 2030 in both the power and transport sectors. The different island network systems (IRENA, 2015). This
renewable energy roadmap will support the NDC revision existing grid integration study lays the foundation for the
process by looking into least-cost, high-impact pathways aforementioned studies necessary for deploying further
for fully decarbonising Antigua and Barbuda’s power and renewable energy in Antigua and Barbuda.
transport sectors by 2030 and 2040 respectively.
The optimisation and analysis of the roadmap was
This roadmap charts the way forward for decarbonising performed with HOMER Pro software, an optimisation
Antigua and Barbuda’s power and transport sectors tool used to design and technically and financially
within the targeted time frames. It looks in detail at evaluate options for off-grid and on-grid power systems
the power sector and outlines the path to a resilient, for remote, stand-alone and distributed generation
decarbonised, least-cost power system, which can applications. The current power system of Antigua and
be leveraged to decarbonise road transport through Barbuda was used to calibrate the model in HOMER,
electromobility. To achieve the ambitious target proposed and subsequently various scenarios were considered to
by the Government of Antigua and Barbuda, several provide the Government with the least-cost pathway for
renewable energy technologies have been analysed. The a 100% renewable energy power system by 2030. The
current power system of the country is widely dominated study has considered the following five main scenarios:
by conventional fossil fuel generation. Hence, multiple
renewable energy options were explored. These include 1. Optimal system1
utility-scale solar photovoltaics (PV), distributed solar PV 2. Optimal system + EVs
(including PV for the residential sector), utility-scale wind 3. 100% RE (no hydrogen)
and green hydrogen production. Furthermore, electric 4. 100% RE (with hydrogen)2
vehicles (EVs) were considered for achieving a 100% 5. 100% RE (with hydrogen + EVs)
renewable energy share in the transport sector by 2040.
Figure ES 1 shows the overall results of the renewable
It must be noted however, that in order to implement energy share and levelised cost of electricity
the findings of the roadmap, several technical studies obtained through the optimisation analysis for
would be required. These include: load flow, frequency the various scenarios considered in the roadmap.
1 Least-cost based on net present cost. This is considering solar, wind, and storage, and not considering hydrogen.
2 Includes hydrogen electrolyser, storage and fuel cell for power-to-hydrogen and hydrogen-to-power.
10 RENEWABLE ENERGY ROADMAPFigure ES 1: Roadmap overview – renewable energy share and cost of electricity
in different scenarios
100 0.20
0.18
80 0.16
0.14
LCOE (USD/kWh)
RE Share (%)
60 0.12
0.10
40 0.08
0.06
20 0.04
0.02
0 0.00
al al RE RE ith
p tim m p tim Vs 0 % n) 0 % n) (w s)
O ste O +E 10 oge 10 oge R E EV
Sy m yd
r d r 0 % n+
se
t h hy 10 oge
Sy (n
o ith dr
(w hy
The current power system of Antigua and Barbuda can be achieved cost-efficiently. For the last scenario,
is highly dominated by fossil fuel generation, with the levelised cost of electricity (LCOE) decreases to
only a 3.55% renewable energy share. The results of USD 0.09 per kilowatt-hour (kWh) and is the cheapest
the optimisation have shown that by increasing the option from the five scenarios considered.
renewable energy capacity based on the current plans
of the Government in place as of 2020, Antigua and Table ES 1 shows the overall investment requirements for
Barbuda will increase its renewable energy share to each scenario analysed in the roadmap.
around 9% in the next few years. The figure, however,
shows that the optimal system would increase the share The results show that with the optimal system
of renewables for Antigua and Barbuda from the current scenario, the Government of Antigua and Barbuda
3.55% to a potential 90%. For the remaining 10%, the would need to potentially invest an initial capital cost
roadmap explored three specific 100% scenarios, namely, of USD 388 million. When deploying electric vehicles
100% RE (no hydrogen), 100% RE (with hydrogen) together with the optimal system, the initial investment
and 100% RE (with hydrogen plus EVs). By 2040, full will increase to USD 498 million due to the additional
deployment of electric vehicles to further increase battery storage required. The results also show that
the renewable energy share in the transport sector the scenario that would require the highest upfront
Table ES 1: Investment requirements for each scenario
OPTIMAL OPTIMAL 100% RE (NO 100% RE (WITH 100% RE (WITH
MODEL/SCENARIO
SYSTEM SYSTEM + EVs HYDROGEN) HYDROGEN) HYDROGEN + EVs)
Initial capital cost
388 498 783 403 440
(million USD)
ANTIGUA & BARBUDA 11investment (USD 783 million) is the 100% RE scenario Without putting in place the necessary policies and
without green hydrogen production. The reason for such regulations, however, the implementation of the
a large initial capital cost is the significant amount of scenarios identified is unlikely to be achieved. The
storage, solar PV and wind turbines required to achieve following recommendations should be considered
the 100% target without investing in hydrogen. by the Department of Environment for successful
accomplishment of the proposed target:
When green hydrogen production is added to the system,
the initial capital cost decreases to USD 403 million, while 1. Follow international best practices
with hydrogen plus EVs it reaches USD 440 million. It is for procurement
important to note that hydrogen is produced exclusively 2. Move forward with a renewable
for use in power generation, to replace the remaining oil independent power producer (IPP)
products. Once hydrogen production is considered, it 3. Make residential solar PV beneficial
replaces part of the battery storage, as hydrogen is de for the system.
facto being stored for the long term to be used in power
generation when solar and wind generation is low for A key recommendation for the Government of Antigua
multiple days. Although hydrogen is a very inefficient3 and Barbuda is to follow international best practices
way to store electricity, especially compared to batteries, for engineering, procurement and construction (EPC)
its storage in large volumes plays a significant role in of the proposed renewable solutions. This will bring
contributing to system adequacy. down the overall costs of the project, in addition to
making projects more attractive to international EPC
In all EV scenarios, the assumption from the Government companies, developers and suppliers. Partnership
is that all cars and other road vehicles will be 100% between the international suppliers and local
battery electric vehicles by 2040, increasing gradually companies will also be essential in helping the local
from near-zero in 2020. This allows decarbonisation of economy and creating jobs.
road transport, without any hydrogen being used outside
of the power sector. It is important to note that the initial Another recommendation outlined from the roadmap
investment estimated for the scenarios, shown in Table is for new power purchase agreements (PPAs) with
ES 1, inclusive of EVs, does not include the cost of the independent power producers, to exclusively purchase
EVs and the charging infrastructure. Table ES 2 shows the renewable electricity rather than generic electricity or
estimate for the total EV charger deployment costs for electricity based on oil products. It is also recommended
both private and public charging. The total deployment for the Government of Antigua and Barbuda to explore
cost for all the EV charging infrastructure would be ways to make residential solar PV beneficial for the
USD 75 million, out of which USD 43 million would be system and not problematic. This can be done by
paid by the private customers who purchase the EVs for ensuring that technologies complementary to solar
home installation, and the remaining USD 32 million is PV are installed, and by creating incentive tariffs for
part of public infrastructure. charging batteries during peak hours rather than selling
electricity to the grid. Furthermore, time-of-use tariffs
should be designed to incentivise customers to use more
Table ES 2: EV charger deployment costs electricity during times when demand is low.
EV CHARGER INVESTMENT COST (MILLION USD)
In conclusion, implementing the recommendations
outlined in the roadmap will put Antigua and Barbuda
Private home charging Public charging on a pathway shifting from a power system widely
dominated by fossil fuel generation towards one with
43 32
higher shares of renewable energy.
3 Hydrogen efficiency is less than 45%, compared to the more than 90% efficiency of batteries.
12 RENEWABLE ENERGY ROADMAP1. INTRODUCTION TO
THE ANTIGUA AND
BARBUDA ROADMAP
1.1 Roadmap objective at the energy sector as a whole and identify a resilient
least-cost pathway for the development of Antigua and
Located between the Caribbean Sea and the Atlantic Barbuda’s power sector until 2030. Furthermore, it will
Ocean, Antigua and Barbuda is an island nation consisting explore renewable energy options for the transport
of two land masses with a total area of 443 square sector such as EVs by 2040.
kilometres. Apart from the two inhabited islands that
are separated by a distance of 43 kilometres, Antigua
and Barbuda also includes many smaller islands that 1.2 Roadmap analysis overview
are uninhabited (CIA, 2015). According to the World
Bank, in 2018 Antigua and Barbuda had a population of IRENA has been actively supporting islands with their
96 286 inhabitants. energy transition to a renewable energy future, through
the development of detailed renewable energy roadmaps
The Government of Antigua and Barbuda has proposed (IRENA, 2017a). Such roadmaps provide clear pathways
a target of achieving 100% of its electricity generation including technical, economic and policy aspects that
from renewable energy sources by 2030. This target was can allow large-scale adoption of renewable energy.
proposed during the revision process for the Nationally
Determined Contributions (NDCs) elaborated under the From the various techno-economic modelling tools
Paris Agreement. As the energy sector of the country is available in the market, HOMER Pro was used to develop
currently highly dependent on fossil fuels, a transition to the roadmap for both the electricity and transport
100% renewable power will reduce emissions by more than sectors. HOMER is an optimisation tool used to design
90% and will create the necessary environment for 100% and technically and financially evaluate options for off-
adoption of electric vehicles (EVs) in the transport sector. grid and on-grid power systems for remote, stand-alone
and distributed generation applications. It allows the
To this extent, the Government of Antigua and Barbuda user to consider numerous types of technology options
requested the International Renewable Energy Agency to account for energy resource availability and other
(IRENA) to undertake a study to outline a roadmap for variables. The model’s ultimate goal is that of simulating
transitioning to 100% renewable energy in both the and providing the user with the most inexpensive and
power and transport sectors, to inform the revision of viable solution for all possible combinations according
its NDCs. The roadmap will serve as a least-cost pathway to the initial system inputs. Depending on the inputs,
for the power and passenger car sectors, which will feed HOMER can simulate hundreds or even thousands of
into Antigua and Barbuda’s NDC submission for 2021. viable systems.
The main objective of this study is to assist Antigua and This chapter summarises the analysis methods and the
Barbuda in developing a roadmap to transition its energy various renewable energy sources and technologies
and transport sectors to 100% renewable energy by 2030 considered for the study. Figure 1 provides an overview
and 2040 respectively. The roadmap will look in detail of the roadmap methodology and models used.
14 RENEWABLE ENERGY ROADMAPFigure 1: Roadmap analysis flow chart
The roadmap study consisted of analysing the Section 3.1 (Demand analysis) describes in more depth
deployment of renewable energy options for Antigua the methodology for developing the baseline demand.
and Barbuda in the following two sectors/applications:
In order to achieve 100% renewable electricity
1. Electricity generation generation, various renewable energy technologies
2. Road transport will need to be considered for future deployment.
The power sector of Antigua and Barbuda is highly
The following sections describe the details of both dependent on conventional fossil fuels and import of
applications including the various options considered for heavy fuel oil, hence various renewable energy options
each sector to achieve the 100% renewable energy target. must be considered to achieve the ambitious target of
100%. From the several technologies available, the ones
considered for this study include the following:
Electricity generation
• Distributed solar PV: including rooftop PV for the
The analysis for Antigua and Barbuda’s electricity residential sector
sector was done to perform a detailed optimisation of
the current situation as well as for 2030. The first step • Utility-scale solar PV: ground-mounted PV arrays
was to prepare a baseline demand forecast and then to
add the planned renewable energy systems for 2030 • Utility-scale wind: onshore wind farms
including additional suggested technologies to achieve
100% renewable electricity. The baseline forecast was • Hydrogen: production of green hydrogen from
prepared using data on the existing generators provided solar and wind.
by the Antigua Public Utilities Authority (APUA).
The baseline demand forecast is important as it is used Together with the deployment of the above-mentioned
for determining the required generation resources. renewable energy technologies, battery storage systems
ANTIGUA & BARBUDA 15will be essential to achieve 100% renewable energy in electrical load that requires a certain amount of energy
both sectors. Batteries provide many services to increase within a given time period). The EV load was added to
the reliability of the electricity system and support the power sector analysis and was performed together.
renewable energy integration. Furthermore, stored
electricity can meet peak demand without the need to Antigua and Barbuda’s transport sector is dominated by
commit additional generation units, it can support the fossil fuels, mainly gasoline and diesel-powered vehicles,
electricity system’s voltage and frequency, and it can and only a few EVs are currently available in the country.
meet demand when renewable energy is not available. Hence, the analysis for the potential of renewable energy
in the transport sector focused on the following topic and
added to the electricity sector analysis discussed above:
Road transport
• EVs powered by renewable energy: the potential
For the transport sector of Antigua and Barbuda, the reduction in fuel imports for transport and the
analysis was also done using HOMER Pro by adding increased level of renewable electricity generation
the electric vehicle load as a deferrable load (that is, an required to power EVs.
16 RENEWABLE ENERGY ROADMAP2. SCENARIOS
The roadmap analysis performed for Antigua and are no battery storage system and converter. Once all
Barbuda’s power system evaluated several scenarios these inputs were added to the model, an optimisation
based on the information provided by the Ministry of of capacity and dispatch was performed using HOMER.
Health, Wellness and the Environment. In order to simulate
the scenarios in HOMER Pro, the model had to first be After preparing the calibration model, a secondary
calibrated. The calibration was done by simulating the model was prepared representing the existing plans of
current power system of Antigua and Barbuda. the Government as of 2020. This model was selected
to show what share of renewable energy can be
The current power system model served as the basis achieved based on the existing plans of the Ministry
for the other scenarios considered in the study. As of Health, Wellness and the Environment, and how far
the name suggests, this model represents the current along this share would be to reaching the 100% target.
power system of the island, which is highly dominated by The electricity demand for this model remained the
generation from heavy fuel oil together with a minimal same as 2019 with 375 gigawatt-hours (GWh) per
percentage of renewable generation, solely from solar year. According to the plans of the Government, 5 MW
PV. The reason for considering this was to show the of distributed solar PV will be added to the existing
existing power system of Antigua and Barbuda and to 9 MW of solar PV capacity, in addition to 4.13 MW of
estimate the current renewable share. wind power (15 turbines of 275 kilowatt (kW) capacity
each). In this model, the six 6 MW generators of the
To model the current power system in HOMER Pro Wadadli power plant were removed as the plant
software, the baseline electricity demand for 2019, was decommissioned. The remaining heavy fuel oil
estimated from the hourly load data of 2012, was used. generators of the Blackpine and APC power plants
The demand analysis and calculations performed to remained the same. The storage and battery inverter
estimate the baseline load are discussed in more detail were optimised using the HOMER optimiser.
in chapter 3. The power generation for the current power
system comes mostly from 3 main power plants, which Once the calibration model and the plans of the
use a total of 14 generators running on heavy fuel oil. Government were simulated in HOMER, the various
The three power plants are the APC, Blackpine and scenarios considered in this study were prepared.
Wadadli power plants, with the latter decommissioned The roadmap for Antigua and Barbuda analysed the
on 15 September 2020. following five scenarios:
The calibration model considered all the generators • Optimal system
currently present in the three power plants in Antigua • Optimal system + EVs
and Barbuda, which are three 14.4 megawatt (MW), • 100% RE (no hydrogen)
one 17.1 MW, two 8.6 MW, two 6.6 MW and six 6 MW • 100% RE (with hydrogen)
generators. It also considered the current renewable • 100% RE (with hydrogen + EVs)
energy capacity, which includes 7 MW of centralised
solar PV and 2 MW of distributed solar PV. It was Table 1 shows the various scenarios along with the
assumed that for the current solar PV systems there different technologies considered for the study.
ANTIGUA & BARBUDA 17Table 1: Scenarios considered for the roadmap
SCENARIOS TECHNOLOGY CONSIDERED
Optimal system PV + wind + diesel
Optimal system + EVs PV + wind + diesel + EVs
100% RE (no hydrogen) PV + wind
100% RE (with hydrogen) PV + wind + hydrogen
100% RE (hydrogen + EVs) PV + wind + hydrogen + EVs
Optimal system make it possible to increase the renewable energy share.
The optimiser was further used for sizing the battery
The first scenario analysed in this study was the storage system and the converter for the various
optimal system scenario. This scenario considers the renewable energy systems.
current plans of the Government along with additional
renewable energy capacity based on land availability and
extra capacity based on the HOMER optimiser, which Optimal system + EVs
minimises the system’s net present cost. The reason
for selecting this scenario was to show the maximum The second scenario analysed in this study was the
renewable energy share that can be achieved based on optimal plus EVs scenario. This scenario was considered
the plans and based on land availability for installing to show how the renewable energy share, electricity
further renewable capacity. The electricity demand for demand and levelised cost of electricity (LCOE) of the
this scenario remained the same as the previous ones optimal system scenario would be affected by adding
at 375 GWh/year. As with the existing plans model, electric vehicles. Hence, a deferrable load was added
the generators of the Wadadli power plant were not to the optimal scenario to represent the EV demand.
considered in this scenario. A deferrable load can be defined as an electrical load
that requires a certain amount of energy within a given
Based on the information provided by the Government of time period. The deferrable load was calculated based
Antigua and Barbuda, the average household consumes on the data received from the Antigua and Barbuda
just over 3 000 kilowatt-hours per year (kWh/year) or Transport Board and is discussed in detail in chapter
8.25 kWh/day. Based on this, it was estimated that a 3 kW 3. The HOMER optimiser was used in this scenario to
solar PV system with battery storage would be added on optimise the ideal additional capacity of renewables
the rooftop of each household. Hence, with an assumption needed to meet the increased electricity demand due
of 30 000 households in Antigua and Barbuda, this to the EV load. The optimiser was also used to size the
scenario evaluated a total capacity of 90 MW for the appropriate converter and battery storage needed.
residential sector. A secondary model was also analysed
showing the optimal system without the residential load
and is discussed more in detail in section 4.3. 100% RE (no hydrogen)
Furthermore, based on the land availability provided The third scenario considered was the 100% RE without
by the Government, with a total of around 80 hectares, hydrogen scenario. As the name suggests, this scenario
the model considered a future ground-mounted PV represents a 100% renewable energy power system but
capacity of 100 MW. For the wind power capacity, the without considering green hydrogen production. This
scenario considered adding another 13.5 MW to the scenario was selected to show that there is a possibility
original 4.13 MW. The HOMER optimiser also was used to to achieve the ambitious target set by the Government
evaluate any additional wind power capacity that would of Antigua and Barbuda with just solar and wind energy.
18 RENEWABLE ENERGY ROADMAPIn addition to the original plans of the Government demand to 562 GWh/year. As for all the other scenarios,
(including 100 MW of ground-mounted systems and the ideal size for the storage and converter were also
90 MW of rooftop systems), an additional capacity of optimised.
PV and wind was estimated using the HOMER optimiser.
The optimiser also estimated the ideal battery storage
capacity required for such a system. 100% RE (hydrogen + EVs)
The last scenario considered in the analysis was the
100% RE (with hydrogen) 100% RE scenario with hydrogen plus EVs. This scenario
was considered in order to show how much additional
The fourth scenario considered for the roadmap analysis renewable energy capacity will be needed to cover the
was the 100% RE scenario with hydrogen. This scenario demand for hydrogen as well as the demand for charging
estimated the ideal renewable energy capacity needed electric vehicles. For this scenario, the demand for the
to achieve the target of the Government to cover all EVs was added as a deferrable load in HOMER Pro.
the electricity demand from solely renewables by This load was added together with the current electric
2030. In order to achieve the 100% share of renewable demand of 375 GWh/year, hence increasing the demand
energy, any fossil fuel generation had to be removed and concurrently the renewable energy capacity. Similar
from the model, hence this scenario did not consider to the previous scenario, a hydrogen tank, electrolyser
any of the current power plants that run on heavy fuel and fuel cell were added into HOMER to perform an
oil. Together with the solar and wind capacity of the optimisation for their ideal size. The HOMER optimiser
previous scenario, additional capacity for both solar was also used to estimate the size of the storage and
and wind was estimated using the HOMER optimiser. converter, and any additional PV and wind capacity
Furthermore, in order to achieve the 100% share, green needed to meet the new electric demand.
hydrogen production from renewables was considered.
In HOMER, a hydrogen tank, an electrolyser and a fuel The results of the various optimisations performed on
cell were added and optimally sized using the optimiser. HOMER Pro for both the power and transport sectors
Adding these components increased the electricity are discussed in more detail in chapter 4.
ANTIGUA & BARBUDA 193. KEY ASSUMPTIONS
This chapter discusses the various assumptions that were 2019 baseline electricity demand
considered when performing the HOMER modelling. It
covers the key assumptions considered when estimating To estimate the load for Antigua and Barbuda, data
the baseline electricity demand for 2019 and the were needed on the energy production from the existing
assumptions for the main components and the project generators. APUA provided IRENA with data on the
economics in the HOMER model. It also encompasses the generation of each power plant for four consecutive
assumptions considered for the power sector, and for the years: 2016, 2017, 2018 and 2019. However, the data
transport sector when estimating the EV deferrable load. provided for 2019 (the most recent year) were monthly
values and not hourly. Hence, hourly values for electricity
generation in 2019 had to be estimated using hourly
3.1 Demand analysis values of a previous year. Data on energy produced for
2012 were the most detailed ones available for IRENA to
The 2019 annual load profile for Antigua and Barbuda estimate hourly values for 2019. Each hourly value for
was estimated using the hourly load demand for 2012. 2012 was first converted into a percentage representing
The following section details the data provided by APUA the share of the total monthly demand; subsequently,
on the electricity generation and the methodology used the hourly demand for 2019 was estimated using this
to estimate the hourly load for 2019, which served as the percentage. Figure 2 shows the monthly and total energy
baseline year for the roadmap analysis. production/load for 2019.
Figure 2: Monthly electricity generation for 2019
35 000
30 000
Energy Production (MWh)
25 000
20 000
15 000
10 000
5000
0
Jan Feb Mar Apr May Jun Jul Aug Sep Oct Nov Dec
20 RENEWABLE ENERGY ROADMAPFigure 3: 2019 seasonal load profile
From the data provided on the energy produced by of all of the days in the month, and the bottom of the
each generator of each power plant for 2019, the total box is the average daily minimum. The middle line is the
energy produced or load for 2019 was estimated as overall average for the whole month (HOMER, n.d.).
375 332 megawatt-hours (MWh). Once the hourly values
for the electricity generation in 2019 were estimated, the
data were inputted into HOMER Pro in order to create 3.2 Power sector assumptions
the demand profile that would serve as the baseline
electricity demand. Figure 3 shows the 2019 seasonal Antigua and Barbuda’s power sector relies heavily on
load profile created for the analysis. conventional fossil fuel generation to supply electricity.
Currently, the country has a total of three main power
The seasonal load profile is a plot representing the plants consisting of heavy fuel oil generators of various
monthly minimums, maximums and averages. For capacities. The APC Power Plant is the largest on the
every month, the top line corresponds to that particular island with three generators of 14.4 MW and one of
month’s overall maximum load, while the bottom line 17.1 MW. The Blackpine Power Plant consists of a total of
represents the overall minimum load for that month. The four generators, two of them with 6.6 MW of capacity,
top of the blue box is the average of the daily maximums and the other two with 8.6 MW. The third power plant,
Table 2: Power plant generation capacity
POWER PLANT NO. OF GENERATORS FUEL CAPACITY (MW) TOTAL CAPACITY (MW)
3 Heavy fuel oil 14.4
APC 60.3
1 Heavy fuel oil 17.1
2 Heavy fuel oil 6.6
BLACKPINE 30.4
2 Heavy fuel oil 8.6
WADADLI 6 Heavy fuel oil 6 36
TOTAL 126.7
ANTIGUA & BARBUDA 21which was decommissioned on 15 September 2020, is an additional 13.5 MW of wind turbines, based on a
the Wadadli Power Plant, with six generators of 6 MW technical feasibility study conducted by the Department
each all powered by heavy fuel oil. Table 2 details the of Environment of Antigua and Barbuda.
generation capacity for each power plant presently in
Antigua and Barbuda. To perform the detailed modelling of Antigua and
Barbuda’s power sector in HOMER Pro, several key
Together with the high fossil fuel generation, Antigua and assumptions had to be made and were used for each
Barbuda also has some renewable energy generation scenario modelled. Assumptions had to be made not only
capacity. The current renewable energy capacity consists for the main components such as the solar PV panels,
of a 3 MW solar PV system installed at the airport, the wind turbines, converter, battery and diesel generators,
4 MW Bethesda solar PV array and 2 MW of distributed but also for the economics of the project. These key
solar PV. The currently installed renewable energy assumptions are discussed in more detail below.
capacity in Antigua and Barbuda is shown in Table 3.
Figure 4 shows a schematic diagram from HOMER of the
According to the information provided by Antigua 100% RE power system inclusive of hydrogen and EVs,
and Barbuda’s Ministry of Health, Wellness and the of Antigua and Barbuda.
Environment, the Government is planning to deploy
further renewable energy in the near future including
5 MW of additional distributed solar PV and 4.13 MW
of wind power (15 turbines of 275 kW each). Moreover, Figure 4: HOMER schematic for the
100% RE scenario inclusive
based on studies conducted by the Government, around
of hydrogen and EVs
40 hectares of land is estimated to be available at the
Parham Ridge wind farm site and 40 hectares adjacent
to the 4 MW Bethesda solar system for possible future
deployment of renewables. These two sites can be used
for future solar PV installations, and hence the roadmap
analysis considered the possibility of a future ground-
mounted PV system of around 100 MW capacity.
For the residential sector, the roadmap analysis considered
a total of 30 000 households with the average household
electrical consumption of 8.25 kWh/day or just above
3 000 kWh/year. Based on this, it was estimated that a
3 kW PV system would be added on the rooftop of each
household thereby contributing to a total capacity for the
future residential sector of 90 MW. For future scenarios,
the roadmap also considered the possibility of installing
Table 3: Renewable energy
generation capacity
RENEWABLE
ENERGY CAPACITY (MW)
TECHNOLOGY
AIRPORT Solar PV 3
BETHESDA Solar PV 4
DISTRIBUTED Solar PV 2
22 RENEWABLE ENERGY ROADMAPSolar PV Battery inverter/rectifier
For all the scenarios considered, various assumptions The various costs for the battery inverter/rectifier were
were made on the capital cost, operating cost, also based on IRENA’s latest cost analysis. The capital
replacement cost and lifetime of the solar PV panels. cost for the converter was inputted into HOMER as
The assumptions were based on the latest IRENA cost USD 105/kW. For this component, the replacement cost
analysis (IRENA, 2020a) and on further cost reduction was assumed to be the same as the capital cost. Other
expected over the next ten years. The capital cost, assumptions include the relative capacity of 100%, a
which is the total installed cost of the solar PV array rectifier and inverter efficiency of 95% and a total lifetime
at the beginning of the project, was assumed to be of 15 years.
zero for the current existing PV capacity in Antigua
and Barbuda, as the system has already been installed.
For future planned projects, the capital cost was Diesel genset
assumed to be USD 600/kW for ground-mounted PV
and USD 1 000/kW for rooftop PV. The operation and Based on the information received from the Government
maintenance (O&M) cost for the current centralised PV and APUA on the current generators of Antigua and
was assumed to be USD 4/kW per year, while for the Barbuda, each specific generator of the three power
current distributed PV capacity it was assumed to be plants in the country was represented in HOMER. This
zero. For future PV systems, both ground-mounted and was done by preparing detailed fuel curves based on
residential, the O&M was assumed to be USD 10/kW per the data received. With regard to the cost assumptions
year. For all PV systems considered in this study, the of the generators, the capital cost was assumed to
lifetime of the panels was considered to be 25 years and be zero since the generators are already running. The
the derating factor to be 80%. replacement cost was assumed to be USD 500/kW
and the O&M to be USD 0.03/hour of operation. Since
all the generators run on heavy fuel oil, the fuel price
Wind turbine was assumed to be around USD 0.50/litre. The lifetime
of the generators was inputted as 15 000 hours with a
For future wind capacity in Antigua and Barbuda, the minimum load ratio of 25%.
275 kW Vergnet wind turbine with a hub height of
55 metres was selected in HOMER. The capital and
replacement costs for one turbine were assumed to be Electrolyser
USD 411 675, while the O&M cost for one turbine was
assumed to be USD 4 116.75/year. The estimated lifetime To model green hydrogen production in HOMER, an
for all the wind turbines considered in the roadmap was electrolyser was selected. Assumptions made for the
assumed to be 20 years. electrolyser include a capital cost of USD 450/kW, a
replacement cost of USD 250/kW and an O&M cost of
USD 25/kW/year. The costs are based on an expected
Battery storage rapid reduction (IRENA, 2020b) compared to today’s
prices (IRENA, 2019a) over the next ten years. Other
For the battery storage system considered in all future assumptions include a minimum load ratio of 0%, an
scenarios, a generic lithium-ion battery was selected in efficiency of 70% and a lifetime of 15 years.
HOMER. The cost assumptions were based on IRENA’s
latest report on electricity storage and renewables (IRENA,
2017b). The capital and replacement costs were assumed
to be USD 250/kWh and USD 150/kWh respectively. The
battery was also assumed to have an initial state of charge
of 100% and a minimum state of charge of 20%, with a
degradation limit of 30% before replacement.
ANTIGUA & BARBUDA 23Hydrogen tank Fuel cell
One of the main components needed when modelling The third component needed for simulating green
green hydrogen production is the hydrogen tank to store hydrogen production in HOMER was the hydrogen fuel
the hydrogen produced from renewable energy. For cell. With a capital cost of USD 600, a replacement
every 1 000 kilograms, the capital cost of the tank was cost of USD 400 and an O&M cost of USD 0.01/hour of
assumed to be USD 100, while the replacement and O&M operation, the fuel cell was assumed to have a lifetime
costs were inputted as USD 100/year and USD 1/year of around 50 000 hours.
respectively. The hydrogen tank was assumed to have a
total lifetime of around 25 years.
Table 4: Summary of key assumptions
COMPONENTS ASSUMPTION (UNIT) VALUE
600 (ground-mounted)
Capital cost (USD/kW)
1 000 (rooftop)
SOLAR PV 500 (ground-mounted)
(INCLUDING Replacement cost (USD/kW)
INVERTER) 600 (rooftop)
O&M cost (USD/kW/year) 10
Lifetime (years) 25
Capital cost (USD/unit) 411 675
Replacement cost (USD/unit) 411 675
WIND TURBINE
(275 KW PER UNIT)
O&M cost (USD/unit/year) 4 116.75
Lifetime (years) 20
Capital cost (USD/kWh) 250
BATTERY STORAGE Replacement cost (USD/kWh) 150
O&M cost (USD/kWh/year) 0
Capital cost (USD/kW) 105
Replacement cost (USD/kW) 105
BATTERY INVERTER/
CHARGER
O&M cost (USD/kW/year) 0
Lifetime (years) 15
24 RENEWABLE ENERGY ROADMAPCapital cost (USD/kW) 0
Replacement cost (USD/kW) 500
DIESEL GENSET O&M cost (USD/kW/operating hour) 0.03
Fuel price (USD/litre) 0.50
Lifetime (hours) 15 000
Capital cost (USD/kW) 450
Replacement cost (USD/kW) 250
ELECTROLYSER
O&M cost (USD/kW/year) 25
Lifetime (years) 15
Capital cost (USD/tonne) 100
Replacement cost (USD/tonne) 100
HYDROGEN TANK
O&M cost (USD/tonne/year) 1
Lifetime (years) 25
Capital cost (USD/kW) 600
Replacement cost (USD/kW) 400
FUEL CELL
O&M cost (USD/kW/operating hour) 0.01
Lifetime (hours) 50 000
3.3 General techno-economic renewable fraction was set to be 0%. In terms of operating
reserves, the load in current time-step was assumed to be
assumptions
10%, and the annual peak load to be 0%. The solar power
Together with the main components in the HOMER output was set as 20% and the wind power output as 30%.
model, assumptions were also made for the economic
and financial parameters. These assumptions were Once all of the above assumptions were inputted into
essential in order to achieve more detailed and precise HOMER, an optimisation was performed for the various
results for the financial part of the project. The key scenarios considered in this analysis. Chapter 4 covers
assumptions include a nominal discount rate of 7%, an in more detail the different results obtained for each
expected inflation rate of 1.9%, a real discount rate of 5%, scenario. The results include hourly dispatch results
a value of lost load of USD 20/kWh and a project lifetime for the whole year. In the report, for readability and
of 25 years. The system fixed capital cost and system exemplification, only the chart for two specific days of
fixed O&M cost were both assumed to be zero. the year is plotted, while full results with hourly data for
the full year are provided to the Government of Antigua
With regard to the project constraints, further assumptions and Barbuda for reference. All annual data in the report
had to be made to run the models. The maximum annual are not based on the two specific days in the charts but
capacity shortage was inputted as 1%, while the minimum on hourly data for the full year.
ANTIGUA & BARBUDA 25The days selected were the first two days of the year, the Table 5: Current fleet of vehicles, 2020
1st and 2nd of January. These two days were selected
because the month of January typically has constant TOTAL % OF TOTAL
VEHICLE TYPE
and steady winds as opposed to irregular winds during VEHICLES VEHICLES
the dry season, making it possible to visualise some of
the higher solar and wind penetration days, as well as the ATVs 124Due to the high preference for gasoline as the principal fuel With regard to the EV charging characteristics, it was
for most vehicles in Antigua and Barbuda, the calculations assumed that the cars, wagons and vans had a nominal
were performed based on only vehicles running on battery capacity of 40 kWh/vehicle, while the pickup
gasoline. To estimate the total deferrable load, the vehicles trucks, SUVs and jeeps had a battery capacity of
were first aggregated based on their type. For example, 60 kWh/vehicle, and the scooters and motorcycles had a
cars, wagons and vans were considered to be similar, as capacity of 5 kWh/vehicle. For the buses and mini-buses,
well as pickup trucks together with SUVs and jeeps. Large the assumed battery capacity per vehicle was 240 kWh
buses were those considered to have a capacity of more and 100 kWh respectively. These assumptions were
than 15 persons, while mini-buses were buses considered based on the newest EV models currently available in the
to have a seating capacity of between 7 to 15 passengers. market for each type. The EV efficiency was also assumed
Scooters and motorcycles were calculated separately. based on the datasheets of the currently available EVs.
A daily driving demand of 25 kilometres was assumed for The assumed EV characteristics along with the EV load
all EVs deployed except the buses and mini-buses, which calculation are shown in Table 8.
were assumed to have a daily demand of 200 kilometres.
Table 7 shows the EVs considered per vehicle type along
with the assumed daily driving demand.
Table 7: Deployed EVs and assumed daily driving demand
NUMBER OF ELECTRIC
VEHICLE TYPE FUEL TYPE km/DAY
VEHICLES
Cars + wagons + vans Electricity 34 000 25
Pickup trucks + SUVs + jeeps Electricity 18 000 25
Large buses Electricity 100 200
Scooters + motorcycles Electricity 1 000 25
Mini-buses (7-15 passengers) Electricity 1 000 200
Note: SUV = sport utility vehicle
Table 8: Assumed EV charging characteristics and EV load calculation
BATTERY NOMINAL EV DAILY INTERNAL CHARGER
VEHICLE TYPE CAPACITY EFFICIENCY DEMAND PER CAPACITY kWh/DAY
(kWh/VEHICLE) (kWh/km) EV (kWh) (kW/VEHICLE)
Cars + wagons
40 0.164 4.1 3.6 139 400
+ vans
Pickup trucks +
60 0.2 5.0 3.6 90 000
SUVs + jeeps
Large buses 240 1 200.0 36 20 000
Scooters +
5 0.05 1.3 1.8 1 250
motorcycles
Mini-buses (7-15
100 0.3 60.0 10.8 60 000
passengers)
Note: SUV = sport utility vehicle
ANTIGUA & BARBUDA 27You can also read