Development and Real-Time Performance Evaluation of Energy Management Strategy for a Dynamic Positioning Hybrid Electric Marine Vessel - MDPI
←
→
Page content transcription
If your browser does not render page correctly, please read the page content below
electronics
Article
Development and Real-Time Performance Evaluation of Energy
Management Strategy for a Dynamic Positioning Hybrid
Electric Marine Vessel
Truong M. N. Bui 1, * , Truong Q. Dinh 1 , James Marco 1 and Chris Watts 2

                                          1   Energy Innovation Centre, WMG, University of Warwick, Coventry CV4 7AL, UK;
                                              t.dinh@warwick.ac.uk (T.Q.D.); james.marco@warwick.ac.uk (J.M.)
                                          2   Babcock International Group, Leicester LE3 1UF, UK; chris.watts@babcockinternational.com
                                          *   Correspondence: truong.bui@warwick.ac.uk; Tel.: +44-24-765-75855

                                          Abstract: Hybridisation of energy sources in marine vessels has been recognized as one of the
                                          feasible solutions to improve fuel economy and achieve global emission reduction targets in the
                                          maritime sector. However, the overall performance of a hybrid vessel system is strongly dependent
                                          on the efficiency of the energy management system (EMS) that regulates the power-flow amongst
                                          the propulsion sources and the energy storage system (ESS). This study develops a simple but
                                          production-feasible and efficient EMS for a dynamic positioning (DP) hybrid electric marine vessel
                                          (HEMV) and real-time experimental evaluation within a hardware-in-the-loop (HIL) simulation
                                          environment. To support the development and evaluation, map-based performance models of
                                HEMVs’ key components are developed. Control logics that underpin the EMS are then designed

                                          and verified. Real-time performance evaluation to assess the performance and applicability of
Citation: Bui, T.M.N.; Dinh, T.Q.;
                                          the proposed EMS is conducted, showing the improvement over those of the conventional control
Marco, J.; Watts, C. Development and
                                          strategies. The comparison using key performance indicators (KPIs) demonstrates that the proposed
Real-Time Performance Evaluation of
                                          EMS could achieve up to 4.8% fuel saving per voyage, while the overall system performance remains
Energy Management Strategy for a
                                          unchanged as compared to that of the conventional vessel.
Dynamic Positioning Hybrid Electric
Marine Vessel. Electronics 2021, 10,
1280. https://doi.org/10.3390/
                                          Keywords: hybrid electric propulsion system; energy management strategy; dynamic positioning
electronics10111280                       marine vessel; map-based performance model; real-time verification

Academic Editors: Cheng Siong Chin
and Hamid Reza Karimi
                                          1. Introduction
Received: 19 April 2021                         In the maritime transport sector, ships are identified as the most efficient transport
Accepted: 25 May 2021
                                          means for heavy freight and cargo transportation. Conventional marine vessels, which
Published: 27 May 2021
                                          utilise a traditional internal combustion engine (ICE) as a main propulsion system, are very
                                          noticeable with high fuel consumption, low fuel economy, and large exhaust emissions,
Publisher’s Note: MDPI stays neutral
                                          comprising carbon dioxide (CO2 ) and particulate matter, that produce harmful impacts to
with regard to jurisdictional claims in
                                          the environment [1–4]. Since recent regulations [5] agreed upon by the International Mar-
published maps and institutional affil-
                                          itime Organization (IMO) and the European Union (EU) have required significant reduction
iations.
                                          of exhaust emissions to prevent air pollution of ships, many ship-building manufacturers
                                          have been forced to reduce the operating speed as an immediate measure of reducing fuel
                                          consumption, hence lowering gas emissions [6]. Other approaches have focused on devel-
                                          oping new propulsion technologies and suggested feasible energy management solutions
Copyright: © 2021 by the authors.         to cut down environmental pollution, reduce CO2 emissions, and maximise fuel efficiency
Licensee MDPI, Basel, Switzerland.
                                          for many kinds of shipping transportation [7].
This article is an open access article
                                                One practical and feasible solution to address these concerns is the hybridisation
distributed under the terms and
                                          of the vessel’s propulsion systems. The hybridisation is based on the combination of
conditions of the Creative Commons
                                          diesel-generator-powered (DG) electric propulsion systems and optimal energy storage sys-
Attribution (CC BY) license (https://
                                          tems (ESSs), accompanied by advanced control strategies of energy management systems
creativecommons.org/licenses/by/
                                          (EMSs) to regulate the power-flow between DG and ESSs. Although the electrical-powered
4.0/).

Electronics 2021, 10, 1280. https://doi.org/10.3390/electronics10111280                                  https://www.mdpi.com/journal/electronics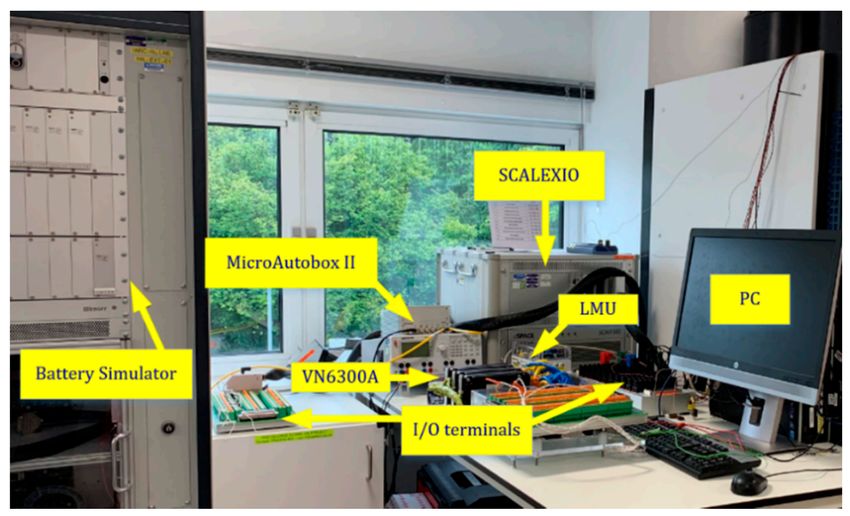
Electronics 2021, 10, 1280                                                                                            2 of 28

                             propulsion systems have been introduced throughout the world in the early 1990s, offering
                             benefits over mechanical propulsion systems in terms of fuel economy, emissions, and
                             maintenance loads, hybrid electric propulsion systems (HEPSs) have just been introduced
                             to numerous applications of automotive industry sector recently [8–10]. However, in the
                             maritime industry sector, the development of HEPSs for vessels is just at the commence-
                             ment of its exploration [4,11–13]. They are attracting research intention in both academia
                             and industry, especially with regard to the integration of battery storage systems (BSSs)
                             into the system as well as the development of achievable EMS to lower fuel consumption
                             and gas emissions. Recently, extensive studies have been reported on high power efficiency
                             ships using new hybrid propulsion technologies and competency EMS [14–16]. Jaurola
                             et al. [14] suggested an optimising design tool for the power management system of a
                             marine vessel based on a literature review. The article presented a key idea focusing
                             on the EMS development, which allows individual power sources to run closer to their
                             optimal output power. However, the study is a purely theoretical investigation, and there
                             is no simulation or experimental result carried out. Kanellopoulos et al. [17] investigated
                             the application of a HEPS in an offshore construction support vessel. An electromotive
                             force control approach was designed based on the IF-ELSE logics and look-up tables to
                             determine suitable actions for the system. From the load flow analysis, it is shown that
                             the hybrid system is more flexible in providing the necessary loads under certain opera-
                             tional conditions. The simulation results illustrated the improvement in reducing pollutant
                             exhaust gas emissions and noise levels on board. Practical comparison of the system is
                             necessary to evaluate the system performance in real-time. Diju et al. [18] studied HEPS for
                             inland waterway vessels and developed a three-layer logic threshold control method for the
                             system to reduce the fuel consumption and gas emission. The simulation results show the
                             improvement of the fuel economy as compared to that of the fuzzy logic strategy. In general,
                             the main control objective of the control strategies for hybrid ships is to allow the engines to
                             operate near to their highest working efficiency point or lowest emission point for a given
                             operating speed within a particular load profile. This limits the operational capacity of
                             the system within a specific profile while there is considerable diversity in the operational
                             capability. Furthermore, the control performance of the discussed hybrid systems was
                             evaluated via simulation methods based on limited load profiles and operating conditions,
                             and real-time validation is necessary to evaluate the performance of those approaches. In
                             fact, the implementation of HEPS is mostly restricted to certain types of vessels, as it is
                             particularly applicable in cases where the mean propulsion power demand is significantly
                             lower than the installed capacity [17]. The performance of a HEPS is also limited to its
                             operating load profile where the influence of load changes can be addressed by the optimal
                             EMS. However, due to the diversity of working conditions and the complexity of control
                             systems, efficient EMS design and verification concerns for the HEPS still draw significant
                             attention from researchers.
                                   Notwithstanding, real-time verification of a complete HEPS with EMS remains chal-
                             lenging due to the high capital cost of prototype development, time consumption, and
                             safety concerns, etc. The hardware-in-the-loop (HIL) simulation technique, which has been
                             intensively used in many fields such as control development and verification, product
                             and component assessment, and system performance validation [19–22], seems to be the
                             most favourable method for real-time testing and evaluating the system. It enables the
                             testing of actual components in conjunction with a virtual computer-based simulation
                             model to represent parts of the system. This testing method avoids complex processes in
                             hardware setup and time constraints and helps lower the risks to people and equipment.
                             The novelties and contributions of this study are summarized as follows. First, the ap-
                             proach establishes an applicable methodology to conduct simulation and verification of
                             the EMS on a prototype of dynamic positioning (DP) hybrid electric marine vessel (HEMV)
                             application in a real-time environment. The method provides the ability to apply HIL
                             techniques in constructing a real-time HEMV system and to transfer the advantages of HIL
                             technology, which are very well documented and researched within the automotive and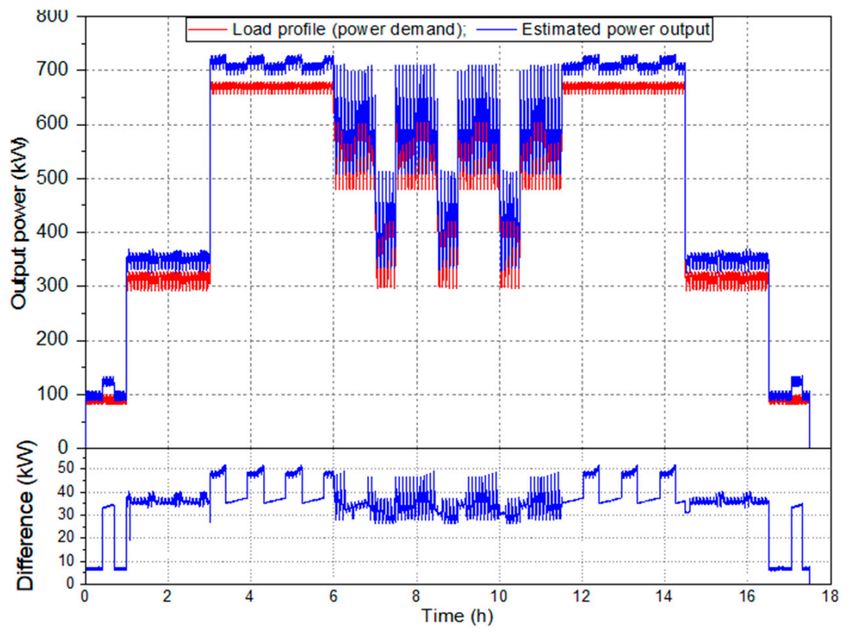
Electronics 2021, 10, 1280                                                                                          3 of 28

                             aerospace domains, to the marine sector for real-time validation, evaluation, and verifica-
                             tion. Thus, it can be the premise for the development, verification, and deployment of the
                             next generation of hybridization and electrification of marine vessels. Second, a simple but
                             production-feasible and efficient EMS, which is able to deal with different operating modes
                             of HEMV application enhancing the fuel economy and reducing environmental emissions,
                             is developed to overcome the drawbacks of traditional control approaches in terms of effi-
                             ciency and performance. Third, the successful deployment of a real-time battery simulator
                             (BAT-S), which represents the complete BSS, extends the applicability of the traditional HIL
                             testing method for testing and evaluating the performance of the EMS. The BAT-S has been
                             completely integrated into the system to evaluate the control strategies instead of using a
                             physical BSS that has obviously high costs, testing time, and safety concerns. Finally, as a
                             technical transfer method from the automotive to maritime sector, a HIL-based DP HEMV
                             platform is built for the experimental evaluation of EMS in a real-time testing environment.
                             The achievable HIL simulator platform can potentially provide the capability of evaluating
                             the EMS under any drive cycles with different operational modes of DP marine vessels.
                                   The remainder of the paper is organised as follows. The system architecture and
                             representative plant model are introduced in Section 2. The modelling of key components
                             of the DP HEMV system is presented in Section 3. In Section 4, an extended rule-based
                             control (ERBC) scheme is developed as a feasible control logic based on the principle of
                             load levelling to control the power flow amongst the energy sources of the system. In
                             this section, other rule-based control schemes, e.g., conventional DG control (DGC) and
                             standard rule-based control (RBC), are also developed for comparison purposes. Then, a
                             real-time HIL simulation platform is built in Section 5 to enable real-time simulation and
                             evaluation of the control system. In Section 6, experimental comparison of the system with
                             different control strategies is carried out to access the control performance of the employed
                             HEMV system and the operational ability of the EMS in a real-time environment. Finally,
                             the conclusion and future works are presented in Section 7.

                             2. DP HEMV System Description
                                  Dynamic positioning in the maritime industry is known as a control procedure that
                             automatically maintains the vessel and ship position and heading direction by using its
                             own propellers and thrusters [23]. A ship equipped with this kind of automatic control
                             system offers a capability of holding itself stationary while retaining performance for other
                             tasks. This is therefore relevant for the vessel when mooring or anchoring at sea or in a
                             deep-water area or wherever a DP operation is needed. Since the DP system has recently
                             been increased in the maritime industry, different types of shipping vessels are being fitted
                             with a DP system to enhance the control performance and handling characteristics of the
                             vessels [24]. However, similar to the hybrid propulsion ships, DP vessels require effective
                             EMS due to the complexity and diversity in the control system in order to manage the
                             operational sequence of various power sources in the vessel so that they can perform well
                             while maintaining DP operation.
                                  In fact, the operation of DP vessels generally consists of seven modes: harbour, harbour
                             loading, transit (or cruising), DP loading, DP standby, emergency, and black start [25,26].
                             To guarantee the vessel performance within its operation modes as well as to maintain
                             the capability to respond quickly to peak loads, the traditional propulsion system needs
                             to have a power capacity much higher than the average power required to operate the
                             vessel. This leads to the fact that the vessel would be equipped with large size engine-
                             generators while normally operating in low power modes or at low efficiency regions,
                             therefore resulting in high fuel consumption and thus gas emissions [26]. Hence, a hybrid
                             propulsion system should be employed, replacing the traditional one, to overcome these
                             restrictions. Subsequently, an efficient EMS for hybrid propulsion systems should be
                             developed as an urgent demand to improve the environmental impacts and performance
                             of DP vessels.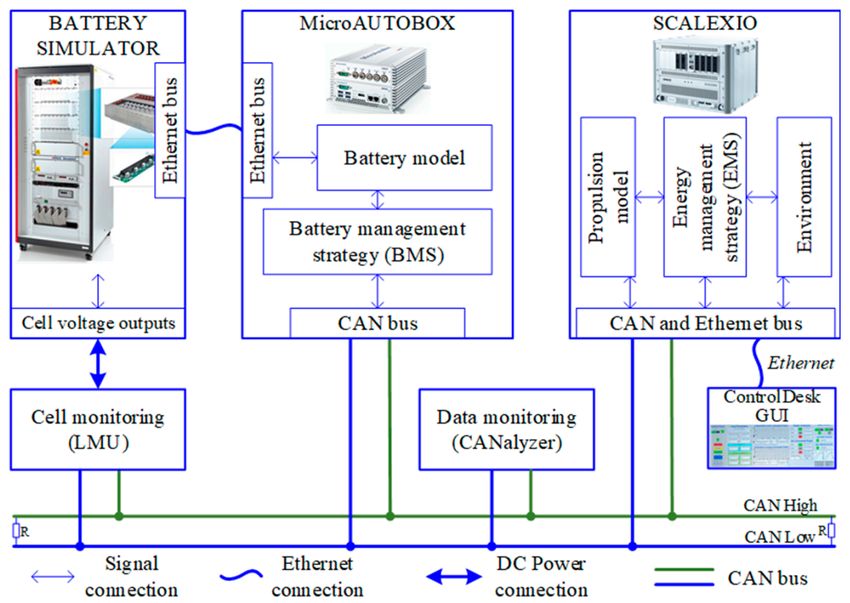
Electronics 2021, 10, 1280                                                                                           4 of 28

                                  In this study, a series alternating current (AC) DP HEMV is chosen as the target system
                             for the verification and evaluation of the developed EMS. The architecture diagram of the
                             employed HEMV is illustrated in Figure 1. The system principally consists of two DG
                             units, a battery pack representing the ESS, two AC propulsion motors, power converters,
                             transformers, and auxiliary and hotel loads. In each DG, a diesel ICE is engaged to drive
                             the AC generator that acts as the main power source to produce electric power for the
                             common AC grid. In this system, the AC generator is a synchronous machine, which means
                             the output frequency of the generator is dependent upon its rotation speed; the operating
                             frequency of each DG is therefore required to be constant to maintain the grid operating
                             frequency. Consequently, the diesel ICE must be maintained at a constant speed as well. The
                             operation parameters of the DG used in this study are listed in Table 1 [25]. The lithium-ion
                             battery-based ESS is utilised to store the excess electric energy from the grid when available
                             and release that to the grid when requested. By using the transformers and converters,
                             the energy in the common AC bus provided by the DGs and ESS is then converted and
                             distributed to consumers such as propulsion motors and all other system loads.

                             Figure 1. Structure of the employed HEMV system.

                             Table 1. DG’s parameters.

                                                Parameter                             Value                  Unit
                                              Number of DG                              2                      -
                                   Maximum output power (@2200 rpm)                    533                   kW
                                    AC generator’s working frequency                   60                     Hz
                                     Number of poles of the generator                   4                      -
                                              Working speed                           1800                   rpm

                             3. DP HEMV System Modelling
                                  In this section, the DP HEMV is built as the combination of key components’ sub-
                             models, comprising the DG, battery ESS system, and power electronics, while other supple-
                             ment components are ignored or assumed unaffected. To cut down the complexity of the
                             system model as well as to support the EMS development and verification, the following
                             key assumptions are applied: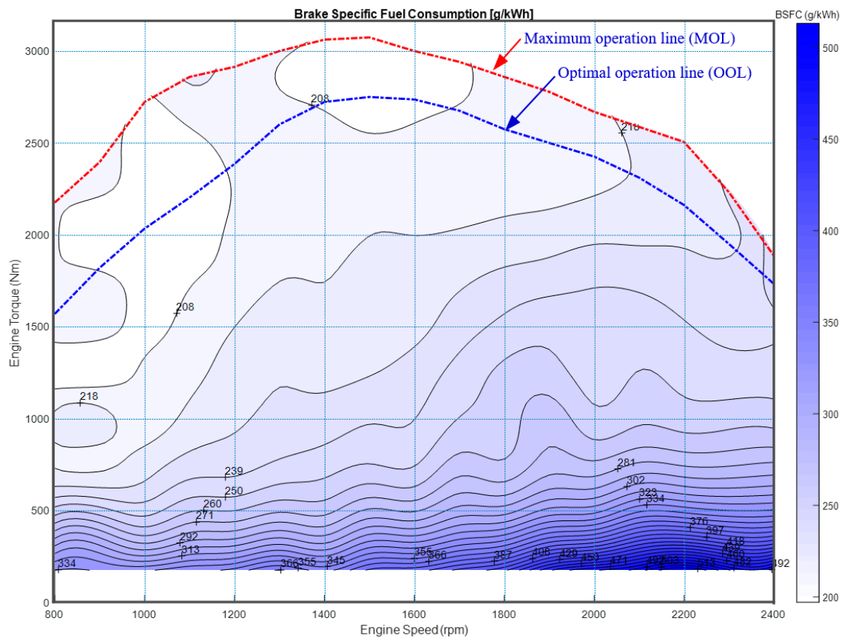
Electronics 2021, 10, 1280                                                                                            5 of 28

                             (1)   The speed, torque, and output power of the ICE are properly defined as in Table 1 to
                                   fit the laboratory testing condition. The pre-defined ICE parameters are based on the
                                   proper selection and combination of commercial Tier 4 marine engines from JCB ltd.
                                   and Caterpillar ltd. marine engine manufacturers, which are detailed in [27,28].
                             (2)   The efficiency and variation sensitivity of the propellers are unchanged. Hence,
                                   the efficiency is expected to be ideal and set to 100% (there is no deficit of power
                                   or performance).
                             (3)   Depending on the actual torque and total power request, the fuel consumption of each
                                   diesel ICE is calculated based on a fuel consumption map; likewise, the performance
                                   of each AC generator is interpolated based on an efficiency map.
                             (4)   Total measurement accuracy and power loss through power electronic equipment
                                   within the AC grid is assumed constant and expressed by an efficiency coefficient.
                             (5)   The transient behaviours of the battery-based ESS during dynamic cycling are ne-
                                   glected. Thus, a simple battery empirical model is feasible for the control verification.
                             (6)   Negative influence of temperature on the performance of the ESS and overall HEMV
                                   system are not considered in this study.
                             (7)   The influences of battery degradation on the control performances are ignored; hence,
                                   the battery performance remains unchanged during the operation.
                             (8)   The propulsion and auxiliary and hotel loads are represented by total operation power
                                   request, which is already merged into the load profile.

                             3.1. Diesel Engine-Generator Modelling
                                  The steady-state output power of the selected ICE is easily calculated via a two-
                             dimensional function look-up table to map the inputs of engine speed and torque to its
                             output power. Figure 2 illustrates the relationship of the ICE output power and torque
                             versus its operational speed, which demonstrates the performance of the selected diesel
                             ICE. Depending on the actual operational speed and the torque request, the output power
                             of the ICE can be obtained. The output power of the generator can be therefore calculated
                             based on an efficiency factor of the generator.

                                                                      Pgen = Peng ηgen                                   (1)

                             where Peng is the output power of the ICE (kW); Pgen is the output power of the generator
                             (kW); η gen is the efficiency factor, which is calculated based on the efficiency map of the
                             AC generator.

                             Figure 2. ICE output power and torque versus speed.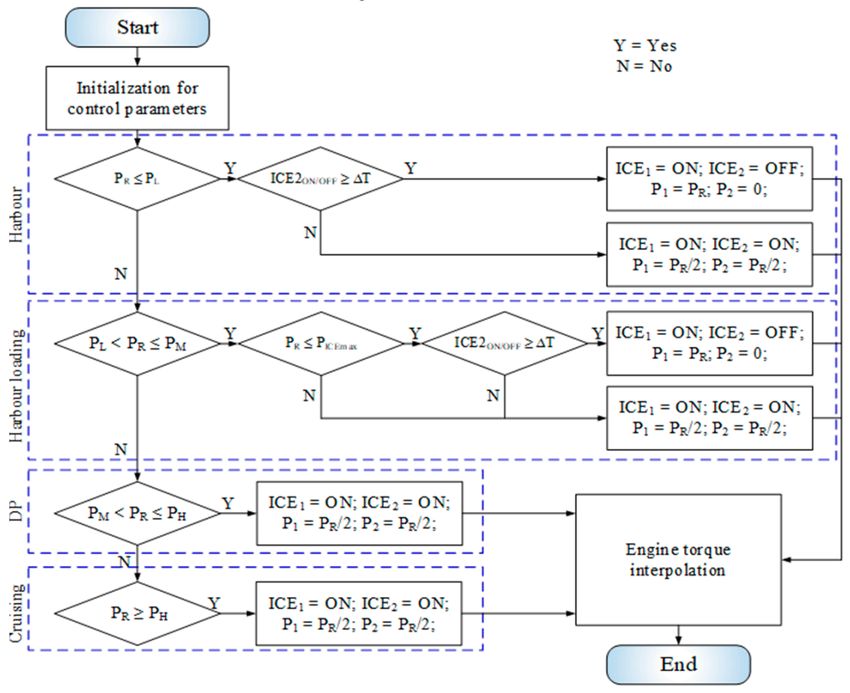
Electronics 2021, 10, 1280 6 of 28
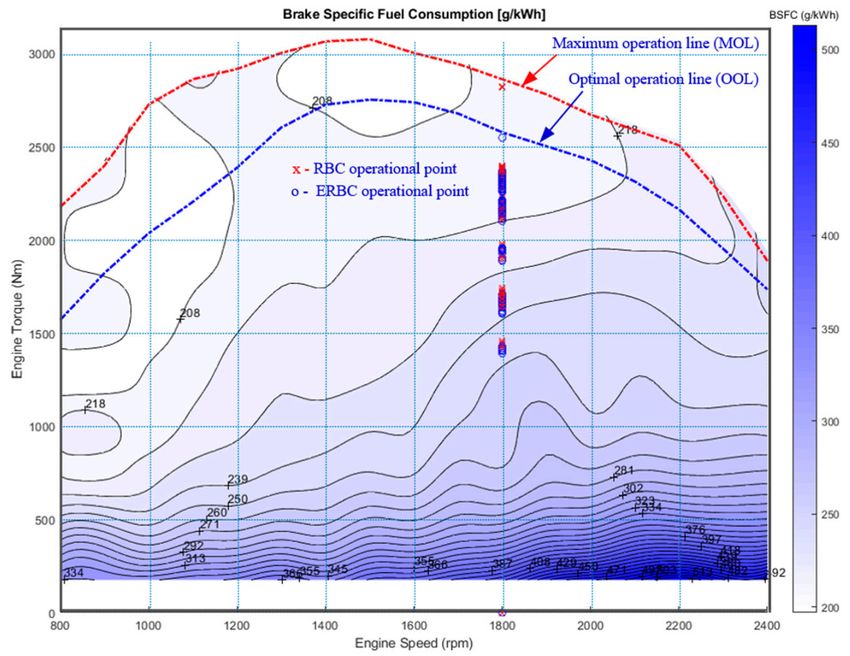
Likewise, the ICE fuel consumption is derived from a brake-specific fuel consumption
(BSFC) map versus engine torque and speed, as shown in Figure 3. This figure depicts an
optimal operating line (OOL) and maximum operating line (MOL) of the ICE that represent
the output power limit of the ICE when running at the optimum and maximum operational
curves, respectively. They are calculated based on the power maps of the reference engines
in the assumptions. Here, the OOL (blue dash-line) indicates the best energy efficiency of
the ICE, while the MOL (red dash-line) offers the maximum output power of the engine.
In any type of engine, OOL is a set of optimal operational points (OOP), based on engine
speed and torque, at which the highest energy efficiency can be delivered. Similarly, MOL
is a set of maximum operating points (MOP) where the engine provides maximum output
power according to actual engine speed and torque. The instantaneous fuel consumption
rate can be calculated as follows:
Peng 10−3
Meng = BSFC (2)
ρ
where Meng is the instantaneous fuel consumption rate (L/h); BSFC is the brake-specific fuel
consumption (g/kWh); Peng is the output power of the ICE (kW); ρ is the diesel fuel density
(ρ = 0.84 kg/L).
Figure 3. BSFC map of the selected diesel ICE.
Consequently, the fuel consumption is determined by the integration of the instanta-
neous fuel consumption rate over time as follows:
Zt
f f uel (t) = Meng (t)dt (3)
0
3.2. Battery Modelling
The battery pack plays an important role in a HEMV. It acts as the ESS of the vessel
system, providing the capability of storing excess electrical energy when the total power
generated by the DGs exceeds the load demand. The battery is also able to release electrical
energy to the grid when the load demand is greater than the total power provided by the
internal DGs. In this circumstance, the battery pack acts as a second power source that
supplies extra energy to fulfil the system power. In the literature, different types of battery
chemicals are used as a dominant energy source, such as lithium-ion, nickel–cadmium,
lead-acid, and alkaline. Amongst them, lithium-ion batteries are the most competitive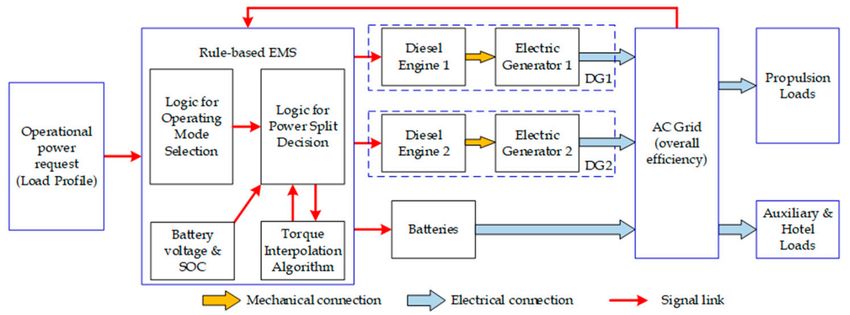
Electronics 2021, 10, 1280                                                                                              7 of 28

                             candidate because of their unique features such as their high energy density, long life cycle,
                             high efficiency, and environmental-friendly performance [29]. Recent studies also show that
                             advanced lithium-ion battery models such as the equivalent circuit model (ECM) [30,31]
                             and electrochemical-based battery models [32,33] have been employed in the control design
                             and energy management systems. However, a drawback that remains in such studies is
                             the calculation effort, which has a negative impact on the control performance, especially
                             for real-time feedback control and verification. Hence, depending on the complexity of
                             the battery model and the size of the whole system model, a suitable battery model can be
                             selected to satisfy the calculation constraint of real-time applications.
                                   In this study, a lithium-ion battery type is therefore equipped to regulate any excess or
                             deficit electric power of the employed HEMV. The battery pack is formed by a series of
                             eight identical battery modules, while each module is created by connecting, in series and
                             parallel, Sony lithium-ion cells—US18650VTC6 as of 16S167P configuration, which are 16
                             cells in series and 167 cells in parallel connected. The employed Sony cell can provide 3.63
                             V of nominal voltage and 3 Ah of maximum capacity. The key parameters of the employed
                             battery pack are shown in Table 2.

                             Table 2. Battery parameters.

                                          Battery Parameters                     Symbol          Value           Unit
                                         Cell nominal voltage                       Vc           3.63             V
                                             Cell capacity                          Cc            3               Ah
                               Battery module (16S167P) nominal voltage             Vm            60              V
                                  Battery module (16S167P) capacity                 Cm           500              Ah
                                  Number of battery module in series                    -         8               -
                                     Battery pack nominal voltage                   Vp           480              V
                                         Battery pack capacity                     Cmax          500              Ah
                                         Peak charging current                    Ich   max      500              A
                                           Charge efficiency                        η ch          90              %
                                       Peak discharging current                   Idis   max     1000             A
                                          Discharge efficiency                     η dis         100              %

                                  The battery model used in this study is inherited from our previous studies [25,26].
                             The following discussion summarises the essential battery information of an ECM as
                             depicted in Figure 4. The open circuit voltage (OCV) and internal resistance of the battery
                             are the function of battery state of charge (SOC) and temperature that are easy to measure
                             and estimate using experimental characterisation. The battery OCV can be calculated by
                             using the following equation:
                                                                   VOC = Ibat Rbat + Vt                              (4)
                             where VOC is the OCV of the battery (V); Ibat is the battery current (A); Rbat is the battery
                             internal resistance (Ω). Vt is the terminal voltage (V).
                                  The output power of the battery can be calculated as follows:

                                                                 Pbat = VOC Ibat − Ibat 2 Rbat                             (5)

                             where Pbat is the output power of the battery (W); Ibat 2 Rbat is the power lost factor of the
                             battery and can be approximated by a Coulomb efficiency term: ηbat .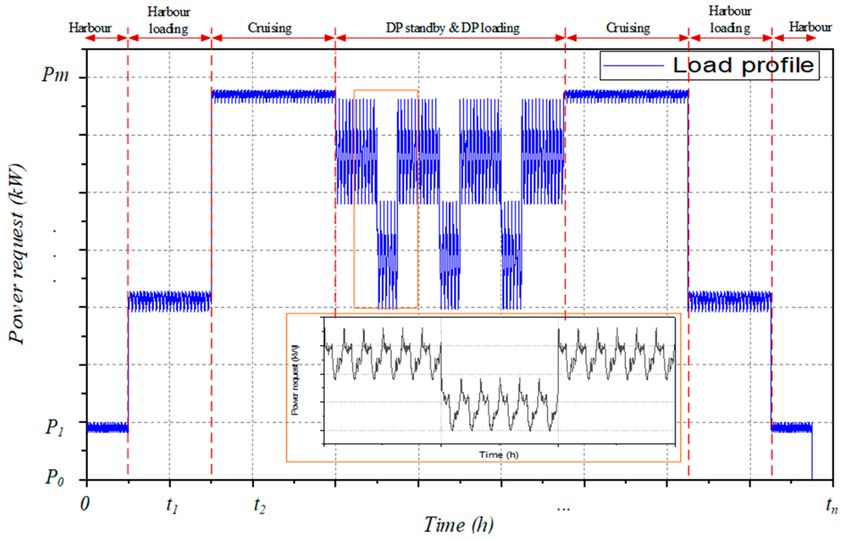
Electronics 2021, 10, 1280                                                                                                 8 of 28

                             Figure 4. Battery equivalent circuit model.

                                  The battery current and the variation of SOC in the battery can be defined as follows:
                                                                               p
                                                                      VOC −        VOC 2 − 4Rbat Pbat
                                                             Ibat =                                                           (6)
                                                                                    2Rbat
                                                                           •           Ibat
                                                                       SOC = −                                                (7)
                                                                                      Cmax
                                      •
                             where SOC is the variation of the battery SOC (%); Cmax is the maximum battery capacity (Ah).
                                The SOC then can be updated for step tth using the Coulomb counting method as follows:

                                                                                        Zt I
                                                                                            bat (t)
                                                              SOC(t) = SOC(0) +                       dt                      (8)
                                                                                              Cmax
                                                                                        0

                             where t is the time taken, SOC(t) is the SOC at time t, and SOC(0) is the initial SOC of the battery.
                                   The OCV–SOC curve and the internal resistance variation versus SOC depicted in
                             Figure 5 are derived based on the characterisation data of three pristine battery cells. The
                             experimental works were carried out at the Energy Innovation Centre (EIC) laboratory,
                             WMG, the University of Warwick, United Kingdom. Before the characterisation was per-
                             formed, the cells were rested within a thermal chamber at 25 ◦ C, allowing a stabilisation for
                             12 h. The characterisation test was then conducted through four tests including the capacity
                             measurement, OCV–SOC relationship, and internal resistance measurement through both
                             a pulse power test and electro-chemical impedance spectroscopy (EIS) measurement [34].
                             The characterisation data describing electrical behaviours of the cells are used to derive the
                             parameters of the battery model.
                                   In fact, for safety purposes, the variation of the battery SOC is limited within its safety
                             operational range. This is to avoid over-charge or over-discharge during the operation
                             and prolong the lifetime of the battery. Additionally, for testing the system within the
                             laboratory environment and reducing the simulation time effort and capital cost, it is noted
                             that the whole battery pack is simulated by the BAT-S. The battery pack is represented
                             by a battery sub-module, which consists of a single string of 16 cells connected in series
                             as of the 16S1P configuration. This representative battery sub-module can produce 60 V
                             nominal voltage and 3 Ah capacity. It is then scaled-up to represent the complete battery
                             pack of the system, as depicted in Table 2. Table 3 proposes the normal working modes
                             of the battery pack, where SOC stands for the actual state-of-charge level of the battery;
                             SOCL , SOCM , and SOCH represent the low, medium, and high operating thresholds of the
                             battery pack, respectively.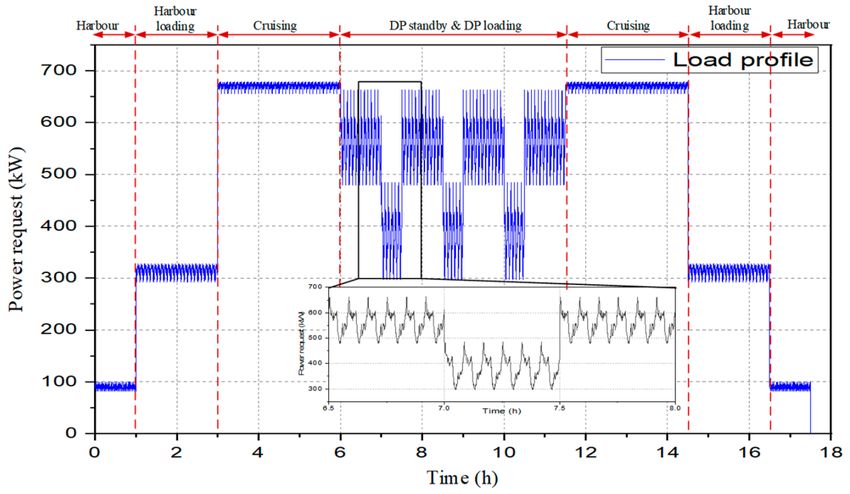
Electronics 2021, 10, 1280                                                                                                 9 of 28

                             Figure 5. (a) Battery OCV–SOC curve; (b) internal resistance curve.

                             Table 3. Battery working modes.

                                      SOC Level                Battery Power Level                      Definition
                                     SOC ≤ SOCL              Very low battery power                Charge priority mode
                                SOCL < SOC ≤ SOCM              Low battery power                Charge sustaining mode
                                SOCM < SOC ≤ SOCH            Medium battery power         Charge sustaining or depleting mode
                                     SOCH < SOC                High battery power                  Charge depleting mode

                             3.3. Power Electronics and Other Components Modelling
                                    The performance of the hybrid system is also affected by the efficiency of the power
                             electronic equipment. To reduce the complexity of the system modelling progress, the
                             model of power electronic components of the AC grid such as transformers, DC/AC
                             converter, AC/AC converters, and other devices are represented by an efficiency factor,
                             η pe . As a result, the actual output power of the AC grid is therefore defined as follows:

                                                                       Pact = Pout η pe                                       (9)

                             where Pact and Pout are, in turn, the output power of the grid after and before considering
                             the efficiency of the power electronic components η pe , respectively.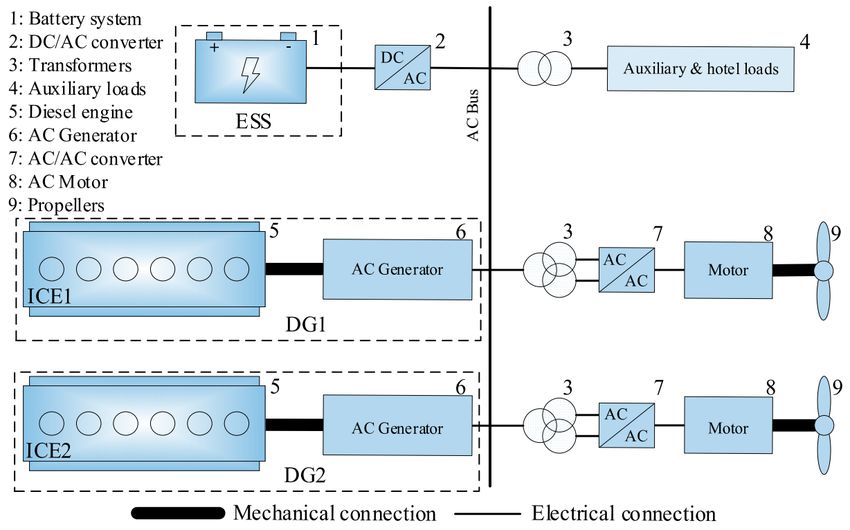
Electronics 2021, 10, 1280                                                                                          10 of 28

                             4. Energy Management Strategy Development
                                  In this section, the EMS control strategies of the hybrid system are developed to control
                             and supervise the power flows amongst the two DGs and the battery pack according to
                             the variation of load command, power level, and operating constraints between the DG
                             and the battery. The objectives of the EMS are to minimize the fuel consumption and thus
                             exhaust gas emissions while maintaining the performance of the system and to maximize
                             the utilisation of the battery within the hybrid system while continuing to prevent it from
                             exceeding the safety pre-set SOC range. In these strategies, the output power of the DG
                             and battery is the control variable, while the power split defining the power distribution
                             between two DGs and the battery pack is the control input of the system.
                                  Rule-based control systems have been widely developed for the automotive sector
                             and other smart grids in the literature [35–37]. They possess several advantages, such as
                             being simple in structure, steady response, and fast switching amongst various operation
                             modes according to different load demands and control scenarios. Theoretically, the
                             algorithm of the rule-based control strategy is easy to implement and suitable for real-time
                             management. However, the transition amongst operation modes in the hybrid system
                             is mostly dependent on the pre-designed switching condition or control criteria such as
                             total power request, constraints of engine start/stop duration, actual battery SOC, and
                             remaining energy in the battery pack. Additionally, the decision of the power split in each
                             mode is mostly dependent on the designer’s experiences in understanding the operational
                             behaviour of the vessel and the way to construct the switching rules for the EMS [26].
                                  In this study, the control diagram of the proposed rule-based EMS is depicted in
                             Figure 6. The EMS is established based on two rule sets: the logic for operating mode
                             selection and the logic for power split decision. The first rule set is utilised to select
                             a proper working mode of the vessel according to load demand. Next, the resulting
                             mode and the status of the DGs and battery are fed into the second rule set to define the
                             power split between the DGs and battery. In this figure, the EMS receives the driving
                             command from the load profile, which represents the total operational power request and
                             generates the power request for the two DGs and the battery. The power requests for
                             the DGs are then sent through a procedure to interpolate the torque commands based
                             on their desired operational speed. The power requests for the battery are converted
                             to the current commands based on the actual SOC of the battery. The resulting torque
                             command and current command are finally utilised as the control signals for the ICEs and
                             battery, respectively.

                             Figure 6. General EMS control diagram of the targeted AC HEMV.

                                  As a result, three rule-based control schemes are finally developed for a non-hybrid
                             vessel and the employed HEMV as follows:
                             (1)   Control scheme 1 is a conventional DG control strategy (denoted as DGC) developed
                                   for the traditional propulsion vessel without a battery pack (non-hybrid vessel). In
                                   this strategy, the start/stop duration, operating sequence, and output power of the
Electronics 2021, 10, 1280 11 of 28
DGs are controlled to directly follow the load demands (known as the load following
method), disregarding the energy efficiency.
(2) Control scheme 2 is a standard rule-based control strategy (RBC) developed for the
employed HEMV. Conventionally, the RBC is designed based on the power level
of the load profile, which is known as the load levelling method, to manage the
power distribution amongst the two DGs and battery. Using the RBC concept, the
DGs are allowed to operate up to their MOP following the MOL, which provides
maximum output power, to track the load demand before requesting power from the
battery pack.
(3) Control scheme 3 is an extended rule-based control strategy (ERBC), which is the
expanded version of the RBC, to overcome the limitation of the standard RBC. It is
developed based on the load levelling method coupled with the presence of extra
function logics to control the operating sequence of the ICE and the start/stop dura-
tion of each ICE and manage the power distribution of the two DGs and the battery
so that the ICEs can operate at the optimal region while maximising the usage of
the battery. As a result, the ERBC allows the ICE to operate at or close to its OOP
following the OOL to provide the best fuel economy. By operating the DGs at the
OOL, the battery unit can be used more effectively and productively to maintain the
overall system performance.
The drawback of the standard RBC strategy is that the ICE, and thus the DG, is usually
operating at or close to the MOL. This is not always true, as the higher torque does not
improve the fuel saving but conversely leads to the increment of fuel consumption if the
ICE keeps running at the high torque region and thus a soaring level of gas emissions. To
overcome this issue, the ERBC is considered in such a way to control the DG to operate at
or close to the OOL, in combination with the logics to control the ICE operating sequences,
start/stop order, and running period to enhance the performance and reduce the overall
fuel consumption.
4.1. Representative Operating Load Profile
In the rule-based EMS development process, understanding the characteristics of the
operating load profile is very important. Due to the diversity of the operational scenarios
of the vessel along with the different power demand level in every voyage, the complexity
of the load profile must be considered in the development of a reliable and efficient EMS.
To underpin the design and validation of the EMS strategies, a representative load profile
based on the characteristic and behaviour of a DP vessel [38] is derived, as shown in
Figure 7, where ti (i = 1 − n) and Pj (j = 1 − m) are, in turn, the operation time and power
request during the voyage, respectively. The load profile represents the total power request,
which includes the propulsion power demand and auxiliary and hotel load demand of
the vessel. The load profile comprises five operation modes: transit (cruising), DP loading,
DP standby, harbour loading, and harbour. Literally, for each voyage, the vessel usually
experiences all such working modes, where it consumes low energy at port and depletes
high energy when loading, unloading, or cruising. In some specific circumstances, the
vessel can turn into any of such DP modes to keep stationary during the journey to transmit
merchandise or to perform any particular tasks, for example. Therefore, the efficient EMS
control strategy of a hybrid DP system must have the capability to flexibly switch the
system amongst those operation modes, control the performance of the propulsion system
and the ESS, and manage the power flows between them efficiently.Electronics 2021, 10, 1280 12 of 28
Figure 7. A representative load profile of a DP vessel.
4.2. Power Level Definition
According to the normal operational characteristics of the selected DP vessel and the
power capacity of the two DGs and battery, four levels of power request (PR ) are defined,
allowing the system to operate within four different power levels as shown in Table 4. The
power thresholds are defined as follows:
PL = 0.5 PICE opt + PICE max
P = PICE max + 0.5PBAT max (10)
M
PH = 2PICE max
where, PL , PM , and PH are in turn the power request, low-power threshold, medium-power
threshold, and high-power threshold of the load demand; PICE opt and PICE max are in turn
the engine optimal and maximum power at a certain speed; PBAT max is the maximum
power of the battery.
Table 4. Power level and vessel switching mode definition.
Power Request Power Level Vessel Mode Definition
PR ≤ PL Very low power request Harbour
P L < PR ≤ P M Low power request Harbour loading + Harbour
PM < PR ≤ PH Medium power request DP standby + DP loading
P R > PH High power request Cruising
where PR is the instantaneous power request.
It is noteworthy that the values of the power levels are defined as the same for all
control strategies. When evaluating the DGC, the battery is not being used in the vessel;
the battery maximum power and the initial SOC are set to zero to remove the effect of the
battery. In evaluating the RBC and ERBC, to avoid continuous switching between working
modes, a small value is added to the thresholds of the battery SOC.Electronics 2021, 10, 1280 13 of 28
4.3. Operational Constraints
The following constraints have been adopted to maintain the system performance and
stability and improve the operational lifetime of the equipment.
Battery useful operational range: the battery charging and discharging current and the
operational SOC level are limited for safety reasons. As the output voltage of the battery
is varied within its operational range, the input and output power of the battery are also
limited. The constraints for the charging/discharging current and SOC variation versus
time are as follows:
Ib (t) ≤ Ich max f or charging
I (t) ≤ Idis max f or discharging (11)
b
SOCmin ≤ SOC (t) ≤ SOCmax
where, Ich max , Idis max , and Ib (t) are, in turn, the maximum charging current, maximum
discharging current, and instantaneous battery current (A); SOCmin , SOCmax , and SOC(t)
are, in turn, the minimum limit threshold, maximum limit threshold, and instantaneous
SOC of the battery (%). In this study, the negative current stands for the charging current
and the positive one represents the discharging one; the SOCmin and SOCmax thresholds
are set to 30% and 95%, respectively.
The instantaneous and maximum output power of an ICE unit is also limited and
defined as follows:
0 ≤ PICE (t) ≤ PICE max (12)
where PICE (t) and PICE max are the instantaneous and maximum output power of the ICE.
Load command conditions: as mentioned, when the load command is larger than or
equal to two times the maximum DG output power, the system will be controlled in high
power level mode, as shown in Table 4. In this mode, the energy deficit will be compensated
by the energy remaining in the battery. Therefore, the maximum load command (Pload max )
to which the system can respond is defined as follows:
0 ≤ Pload max ≤ 2PICE max + PBAT max (13)
To improve the fuel economy, as well as to minimise the electrical power consumption
in starting the ICE, and avoid the high engine start/stop frequency during the journey,
once a DG is started, it should be kept running for at least a pre-set duration (∆T) and can
be expressed as follows:
t ICE ON/OFF ≥ ∆T (14)
4.4. EMS Control Strategies Development and Justification
4.4.1. Conventional Diesel-Generators Control Strategy (DGC)
DGC is designed for the traditional non-hybrid vessel in which the battery unit is not
presented. It solely controls the power flow and the operational sequence of two DGs; thus,
the total power request distributing to two DGs only follows the load demand disregarding
energy efficiency, fuel consumption, and gas emissions. Depending on the power demand,
the DGC produces the control signals including the power request and start/stop signal
for each DG so that the total output power generated by the two DGs meets the power
requirement. Figure 8 shows the block diagram of the DGC strategy, where ICE1 and ICE2
stand for diesel engine 1 and 2, respectively; ICE = ON, ICE = OFF are, in turn, to turn on
and off the engine, respectively; P1 and P2 are the instantaneous power request of the DG1
and DG2 , respectively.Electronics 2021, 10, 1280 14 of 28
Figure 8. Conventional DGC control block diagram.
4.4.2. Rule-Based Control Strategy (RBC)
RBC is designed for the HEMV based on the power levels of the load profile and
the operational mode switching rules, as shown in Equation (10) and Table 4. Once the
output power of each DG is controlled up to its maximum power, then the battery depletes
additional energy to support the system or accumulates excess energy from the system. In
this strategy, the battery pack plays an important role in optimizing the energy of the DGs.
The following rule-based logics are employed in order to achieve the control target.
Rule 1: If PR is less than or equal to PL .
Then, if the remaining energy in the battery is sufficient to support the system within a
pre-set operating duration, two DGs are kept “OFF” and the battery is depleted to support
the system; else, when the battery energy is lower than 75% SOC, one DG is started and
kept “ON” at the MOP. In this circumstance, the battery accumulates the excess energy
from the system for later usage.
Rule 2: If PR is larger than PL and less than or equal to PM .
Then, only one DG is started and kept “ON” so that the output power is up to MOP.
The battery is switched to charging or discharging mode according to its required power
and SOC status. In this case, the battery SOC is limited so that it can be charged up to 95%
(top threshold) or discharged up to 70% to maintain the performance of the battery.
Rule 3: If PR is larger than PM and less than or equal to PH .
Then, depending on the load demand and current battery SOC, one DG or two DGs
are turned “ON” and kept running so that the DG’s output power is up to MOP. The battery
SOC thresholds are set the same as in Rule 2. When the battery SOC reaches the bottom
threshold, it is switched to charge mode, and both DGs are started. In this circumstance,
the output powers of both DGs are kept “ON” at the same power output to balance the
performance of two DGs.Electronics 2021, 10, 1280 15 of 28
Rule 4: If PR is larger than PH .
Then, two DGs are turned “ON” and held working at MOP; the battery is discharged
to the target SOC thresholds, which is stated in Equation (11). Once the battery SOC reaches
the bottom threshold (e.g., 30%), the battery is switched “OFF” and thus there are only two
DGs operating at MOP. Therefore, the maximum output power of the system in this case is
estimated by the total power generated by the two DGs and the maximum discharging
power of the battery.
4.4.3. Extended Rule-Based Control Strategy (ERBC)
On RBC, it can be seen that two DGs are priority controlled up to their MOP before
depleting the energy from the battery in most of the cases. This leads to the fact that there
is significant unnecessary excess energy generated by the DGs that will then be stored in a
limited battery capacity. It is therefore increasing the amount of fuel feeding to keep the
ICE “ON”, thus increasing fuel consumption and gas emission, while the useful utilisation
of the battery is restricted. Consequently, to overcome the weakness of the RBC, ERBC
is proposed and applied. ERBC strategy essentially employs the same logics of the RBC,
however, by using the load levelling concept with additional function logics to control the
ICEs operating at or close to the OOP, following the OOL, to achieve the highest energy
efficiency and maximise the utilisation of the battery. In this strategy, the torque command
of the ICEs is interpolated based on actual ICE power request and their desired speed so
that the total output power is close to the OOP before requesting power from the battery.
Furthermore, extra function logics are integrated into ERBC in order to control the ICE
operating sequences, which firstly prioritise the single ICE to operate at OOP and then
both ICEs at the same working point depending on the power request. This behaviour
prevents the ICE from being started/stopped regularly to diminish the influence of the ICE
transitional period and the sensitivity of the start/stop function. Additionally, the logics
also avoid the operating modes from switching frequently to maintain the stabilisation and
reliability of the system. The detailed block diagram of the ERBC strategy is illustrated in
Figure 9, where PICEopt is the optimal power output of the ICE; PBAT is the instantaneous
input/output power capacity of the battery according to the charge mode (BAT charged)
and discharge mode (BAT discharges) of the battery, respectively.
It is noteworthy that the ERBC maximises the utilisation of the battery and keeps one
or both ICEs operating at their OOPs depending on actual power demand. The battery in
this strategy can function optimally, and its SOC is varied within its boundaries. It can be
used to store the excess energy whenever the supply energy is higher than the demand or
feed its energy back to the main grid to support the ICEs when the current energy is smaller
than the demand. Furthermore, based on the constraints of the power level switching as
in Table 4, and the operational rules and the SOC boundary limits as in Equation (11), the
ERBC can fully control the ICEs and manage the battery SOC so that they can operate
within the limits. Hence, this EMS strategy can increase the resiliency of the battery SOC
whenever the excess energy is positive while maintaining the overall system performance
to meet the load requirement.Electronics 2021, 10, 1280 16 of 28
Figure 9. ERBC control block diagram.
5. Real-Time HIL Configuration for Complete HEMV Evaluation
5.1. HIL Platform Definition
To represent the complete DP HEMV system, a HIL simulation platform is built by
employing multiple pieces of real-time equipment in combination with the models of
key components to simulate the whole system. Figure 10 illustrates the complete system
configuration and signal connection. Basically, the platform consists of a SCALEXIO, a
MicroAUTOBOX II (MAB), a Battery Simulator (BAT-S), which is manufactured by dSPACE
GmbH, a local management unit (LMU) from Texas Instruments, and other peripheral
devices that are used for physical signal communication and transmission. The main tasks
of each real-time machine can be explained as follows:Electronics 2021, 10, 1280 17 of 28
Figure 10. HIL platform communication block diagram.
SCALEXIO is utilised to simulate the complete HEMV system excluding the battery
pack based on the developed models as well as to represent the EMS based on the control
strategies. In addition, the load profile illustrates that the total power request of the vessel
is loaded into this machine to support the system verification. Once the load profile is
generated, the EMS then regulates the power split signals for the DGs and the battery pack
based on their individual control logic. The control signals for each DG and battery are
interpolated accordingly and sent to the targets via a common controller area network
(CAN) bus. To demonstrate physical signal transmission amongst EMS, ICE, DG, and
battery, all control or feedback signals will be populated into the common system CAN
bus; then, they will be delivered or received accordingly by their terminals.
BAT-S is a controllable power electronic device that can simulate a single or multi-cell
battery pack based on any kind of mathematical battery model. It can output physical cell
voltage with high precision based on the given voltage command from the battery model.
This device is ideal to represent a physical battery module or pack for the developing and
testing of battery management systems (BMSs) or evaluating the performance of EMSs. In
this study, the BAT-S is used to generate physical signals of a battery sub-module 16S1P
configuration as described in Section 3.2. The BAT-S is controlled by the MAB via an
ethernet bus protocol.
MAB contains the battery model and the BMS algorithm to represent the complete
BSS. It is mainly employed to generate the control signals for the BAT-S to simulate the
physical battery pack and execute the BMS functions to manage the whole virtual BSS. It is
also used to transmit the battery information to the main control unit. Initially, the MAB
receives the battery current command, which is the input to the battery model, from the
common CAN bus. The battery model then generates the driving command for the BAT-S,
which is the cell voltage command, enabling the BAT-S to output physical cell voltages. As
mentioned, a 16S1P configuration battery sub-module is generated to simulate the complete
scaled-up battery pack. Thereby, once the battery is simulated, all cell information will be
physically captured by an LMU where the cell voltages will then be measured, filtered,
and broadcasted to the common CAN bus. This information will be once again captured
by the MAB for further analysis at the BMS. As the result, the physical output power and
parameters of the battery such as cell, module, and pack voltages, driving current, and
battery SOC are measured, calculated, and estimated accordingly by the BMS. Finally, theElectronics 2021, 10, 1280 18 of 28
battery information received from the BMS allows the EMS to determine a suitable decision
for the battery, ICE, DG, and overall system. The Matlab/Simulink models developed for
the SCALEXIO and MAB are depicted in Figures A1 and A2 in Appendix A, respectively.
In order to monitor the physical cell voltages of the battery pack generated by the
BAT-S, LMU is utilised as a measurement device to capture the physical information
of the simulated battery. The LMU consists of a battery evaluation board named Ti-
BQ76PL455EVM from Texas Instrument and a CAN converter to communicate with the
system CAN bus. The role of the battery evaluation board is to capture all physical cell
voltages generated by the BAT-S in real-time and transmit to the central BMS over the
common CAN bus. Figure 11 depicts the actual HIL simulation platform setup of the
real-time HEMV system.
Figure 11. Actual HIL simulation platform setup.
5.2. System Communication Interfaces and Challenges
Unlike offline model-based simulation techniques, a real-time HIL simulation method
requires a number of physical communication interfaces for signal exchange between
different real-time components. As shown in Figure 10, there are different communication
interfaces within the platform for signal transmission such as the CAN bus, Ethernet bus,
analogue/digital (A/D) input/output (I/O), and DC power bus where the physical signals
can be transmitted or received. The CAN bus is designed to allow various electronic-based
devices to exchange their information or signals with each other over a common serial
bus. It reduces the wiring harness between devices, thereby reducing the wiring bulkiness
and complexity of the complete system. In this configuration, a Vector CANalyzer device
(model VN1630A) is installed to monitor and record all CAN signals transmitted within
the common CAN bus for post-processing purposes. The details of the CAN signals and
messages definition can be seen in Table A1 of Appendix A. As aforementioned, the BAT-S,
via Ethernet bus protocol, receives the driving commands from the MAB, in which the
battery model and BMS are simulated, to reproduce the physical cell voltages of the battery
pack. The physical cell voltages, which are the analogue signals representing the actual
terminal voltage of the battery cells, are then captured by the LMU. The LMU receives and
broadcasts the cell data to the common CAN bus accordingly.
In fact, during the HIL implementation, it was observed that the communication errors
and signal noises occurring due to physical connection are unavoidable. For example, in
CAN communication protocol, all signals transmitted amongst components are packed
and unpacked according to the magnitude and resolution of the signals. Depending on
the priority criteria of the designer, the signal accuracy can be adjusted to fit into a CANElectronics 2021, 10, 1280 19 of 28
message and determine how fast the signal can be broadcasted or triggered. These issues
significantly affect the accuracy, latency, and update rate of the exchanged signals. In
general, it can be summarised as follows:
(1) Signal resolution and its accuracy: this can be caused by the measurement hardware
and the way to transmit and/or receive the signals. While measuring analog signals,
depending on the resolution of the analog-to-digital converter (ADC) of the measur-
ing instruments and the signal magnitude or their operating range, the measured
signals can be presented within a specific resolution. In addition, performing signal
exchanging via CAN bus, all signals need to be “resized” into suitable bit-length
so that they can be fitted into predefined messages. This task causes a difference in
the accuracy between the original signals and the actual transmitted one. Therefore,
depending on the requirement of the accuracy of the signal, the designer can define a
suitable resolution for each signal.
(2) Signal latency and time-shift: this happens in real-time operation activities when a
signal is transmitted or received from different devices; the signal can be held for one
or several time-steps due to the pre-set sample rate of the model or the priority of
the employed hardware. This can lead to the fact that the sent or received signals are
being held, delayed, or time-shifted.
(3) Measurement inaccuracy, noise, and power loss through the power electronic com-
ponents: these un-avoided drawbacks usually happen when examining analogue
signals using electronic measurement equipment.
6. Experimental Results and Discussion
In this section, comparative test-cases of the complete HEMV system are carried out to
evaluate the control performance of the proposed ERBC with those of the RBC and DGC on
the designed real-time HIL-based HEMV system. Thereby, the results can be used to assess
the potential improvement of energy cost, fuel consumption, and thus the emissions of the
typical marine system. The representative load profile with five operation modes defined in
the previous section is employed as the total power request of the whole voyage. The entire
duration of the load profile is pre-scaled to 17.5 h, which enables running experimental tests
at current laboratory conditions. As a result, the total power request and the operational
duration of each mode of the load profile are illustrated in Figure 12. The whole simulation
platform is placed in a temperature controllable thermal chamber where the temperature is
held constant at 25 ◦ C to maintain the stability of the electronic systems during the test. To
enable and evaluate the control performance comparison in different operating conditions,
the system is conducted with two different parameter sets of the ICE minimum operation
duration, i.e., 10 and 20 min, and two different initial SOC of the battery, i.e., 85% and
40%, while the rest of the system parameters shown in Tables 1 and 2 are configured the
same for all test-cases. As a result, ten test-cases with different control strategies and initial
parameter sets are generated, as shown in Table 5. The overall sampling rate is fixed at
10 milliseconds for all test-cases.Electronics 2021, 10, 1280 20 of 28
Figure 12. A representative load profile of the HEMV.
Table 5. Test-cases definition.
Controller
Test-Cases Minimum ICE Start/Stop Duration (Minute) Initial SOC (%)
(EMS)
1 DGC 10 -
2 DGC 20 -
3 RBC 10 85
4 RBC 10 40
5 RBC 20 85
6 RBC 20 40
7 ERBC 10 85
8 ERBC 10 40
9 ERBC 20 85
10 ERBC 20 40
First, test-case 7 is randomly chosen as the representative case within the four test-
cases of ERBC to evaluate the applicability of the proposed control strategy in real-time
testing conditions. Correspondingly, the necessary output power of the complete HEMV
system is estimated in comparison to the total power demand, as shown in Figure 13. The
total necessary power is predicted to be higher than the power demand at any certain time
of the journey. This behaviour reflects the overall system efficiency including that of the
propulsion system (represented by the ICE and DG’s operating efficiency), battery storage
(BSS’s efficiency), and overall efficiency of the power electronic and other components.
The difference between the total power request and the estimated required power output
is shown in the bottom sub-plot of this figure; it shows that a higher power request may
obviously lead to a larger difference between the two powers.Electronics 2021, 10, 1280 21 of 28
Figure 13. Load profile and estimated necessary power of the HEMV.
Figure 14 depicts the variation of the battery SOC over time, which demonstrates the
utilisation performance of the battery during the journey. The battery pack is controlled to
be charged or discharged according to the actual power request generated by the ERBC
controller. The SOC variation satisfies the safety constraints, as it is altering within the
range between 30% and 95% of SOC. In addition, Figure 15 illustrates the battery input
power (in charged mode—negative part) and output power (in discharge mode—positive
part) variation over time. The results show that the HIL-based battery pack performs very
well in real-time and the LMU unit can successfully capture the battery information and
send it to the central BMS, and then the EMS, to represent the behaviour of the physical
battery system. Consequently, this simulation method provides a capability of validating
the control performance of the controllers and allows the testing of the overall HEMV
system in a real-time environment.
Figure 14. Variation of battery SOC during operation.Electronics 2021, 10, 1280 22 of 28
Figure 15. Battery power variation during operation.
Additionally, Figure 16 illustrates the operating performance of the two ICEs and
thus the DG’s output powers. The top sub-plot shows the start/stop sequences and the
operation duration of the ICE. The minimum start/stop duration satisfies the constraint of
this test-case; the ICE should operate at least 10 min before stopping. The DG1 has eight
start/stop cycles with a stop ratio of 13.59%, while the DG2 has 13 with a 72.57% stop
ratio. The bottom sub-plot presents the output power of the DG1 and DG2 according to
the ICE start/stop sequences. Both DG1 and DG2 can be turned on and/or off during the
voyage to minimize the ICE operation time and thus the fuel consumption and maximize
the utilisation of the battery. Once turned on, the DG1 is controlled as close as possible to
the OOP while the DG2, if turned on, is controlled so that the output power is the same as
that of the DG1 to balance system performance.
Figure 16. DGs working performance in HIL simulation.
Second, to demonstrate the performance improvement of the proposed ERBC over
other control strategies, the key performance indicator (KPI) table is built based on the
controller design requirements, as depicted in Table 6. The KPI table enables the comparison
of the performance of the HEMV system under three different control approaches in a
number of criteria such as the number of ICE start/stop cycles, total operation time per
voyage of ICE and DG, fuel consumption, electrical consumption, and energy cost. It is
noted that the vessel energy cost is the total cost of fuel consumption, electrical cost for
cranking the ICE, and electrical cost, which produces the difference between the initial and
final battery SOC. In this table, test-case numbers 1, 3, and 7, which are the representatives
of each control strategy, are selected for the comparison. In these test-cases, the minimum
start/stop duration of ICE is set to 10 min, while the initial battery SOC is set to 85% for bothYou can also read