Nova Scotia Utility and Review Board - 2020 10-Year System Outlook NS Power - Nova Scotia Power
←
→
Page content transcription
If your browser does not render page correctly, please read the page content below
Nova Scotia Utility
       and Review Board
IN THE MATTER OF The Public Utilities Act, R.S.N.S. 1989, c.380, as
amended

        2020 10-Year System Outlook
                          NS Power

                          June 30, 2020

                  NON-CONFIDENTIAL
2020 10-Year System Outlook
                                                       NON-CONFIDENTIAL

1                                                         TABLE OF CONTENTS
2
 3   1.0     INTRODUCTION ............................................................................................................... 5
 4   2.0     LOAD FORECAST ............................................................................................................. 7
 5   3.0     GENERATION RESOURCES.......................................................................................... 11
 6     3.1      Existing Generation Resources ................................................................................................... 11
 7         3.1.1       Maximum Unit Capacity Rating Adjustments .................................................................... 13
 8         3.1.2       Mersey Hydro ..................................................................................................................... 14
 9         3.1.3       Wreck Cove Hydro ............................................................................................................. 14
10     3.2      Changes in Capacity ................................................................................................................... 15
11         3.2.1       Tusket Combustion Turbine................................................................................................ 15
12         3.2.2       Victoria Junction Combustion Turbine ............................................................................... 16
13         3.2.3       Annapolis Tidal ................................................................................................................... 16
14     3.3      Unit Utilization & Investment Strategy ...................................................................................... 17
15         3.3.1       Evolution of the Energy Mix in Nova Scotia ...................................................................... 17
16         3.3.2       Projections of Unit Utilization ............................................................................................ 19
17         3.3.3       Steam Fleet Retirement Outlook ......................................................................................... 20
18   4.0     NEW SUPPLY SIDE FACILITIES .................................................................................. 21
19   5.0     QUEUED SYSTEM IMPACT STUDIES ......................................................................... 22
20     5.1      OATT Transmission Service Queue ........................................................................................... 23
21   6.0     ENVIRONMENTAL AND EMISSIONS REGULATORY REQUIREMENTS ............. 25
22     6.1      Renewable Electricity Requirements .......................................................................................... 25
23     6.2      Environmental Regulatory Requirements ................................................................................... 28
24     6.3      Upcoming Policy Changes .......................................................................................................... 32
25   7.0     RESOURCE ADEQUACY ............................................................................................... 33
26     7.1      Operating Reserve Criteria.......................................................................................................... 33
27     7.2      Planning Reserve Criteria ........................................................................................................... 34
28     7.3      Capacity Contribution of Renewable Resources in Nova Scotia ................................................ 36
29         7.3.1       Energy Resource Interconnection Service Connected Resources ....................................... 37
30     7.4      Load and Resources Review ....................................................................................................... 38
31   8.0     TRANSMISSION PLANNING ........................................................................................ 41

     DATE FILED: June 30, 2020                                                                                                          Page 2 of 58
2020 10-Year System Outlook
NON-CONFIDENTIAL
32 8.1 System Description ..................................................................................................................... 41
33 8.2 Transmission Design Criteria...................................................................................................... 42
34 8.2.1 Bulk Power System (BPS) .................................................................................................. 43
35 8.2.2 Bulk Electric System (BES) ................................................................................................ 43
36 8.2.3 Special Protection Systems (SPS) ....................................................................................... 44
37 8.2.4 NPCC A-10 Standard Update ............................................................................................. 44
38 8.3 Transmission Life Extension ...................................................................................................... 46
39 8.4 Transmission Project Approval ................................................................................................... 46
40 8.5 New Large load Customer Interconnection Requests ................................................................. 47
41 8.6 Wind Integration Stability Study - PSC ...................................................................................... 48
42 9.0 TRANSMISSION DEVELOPMENT 2020 to 2030 ......................................................... 51
43 9.1 Impact of Proposed Load Facilities ............................................................................................ 51
44 9.2 129H-Kearney Lake Relocation.................................................................................................. 52
45 9.3 Transmission Development Plans ............................................................................................... 52
46 9.4 Western Valley Transmission System – Phase II Study ............................................................. 55
47 10.0 PANDEMIC RESPONSE.................................................................................................. 56
48 11.0 CONCLUSION .................................................................................................................. 57
49
DATE FILED: June 30, 2020 Page 3 of 582020 10-Year System Outlook
NON-CONFIDENTIAL
1 TABLE OF FIGURES
2
3 Figure 1: Net System Requirement with Future DSM Program Effects (actuals are not weather adjusted) 8
4 Figure 2: Coincident Peak Demand with Future DSM Program Effects ...................................................... 9
5 Figure 3: 2020 Firm Generating Capability for NS Power and IPPs .......................................................... 12
6 Figure 4: Firm Capacity Changes & DSM.................................................................................................. 15
7 Figure 5: 2005, 2019 Actual, 2021 Forecast Energy Mix ........................................................................... 18
8 Figure 6: Peak System Demand Trend ....................................................................................................... 19
9 Figure 7: Combined Transmission & Distribution Advanced Stage Interconnection Queue as of June 17,
10 2020 ............................................................................................................................................................ 22
11 Figure 8: Requests in the OATT Transmission Queue ............................................................................... 23
12 Figure 9: RES Compliance Forecast ........................................................................................................... 27
13 Figure 10: Multi-year Greenhouse Gas Emission Limits ........................................................................... 28
14 Figure 11: Greenhouse Gas Free Allowances 2019-2022........................................................................... 29
15 Figure 12: Emissions (SO2, NOx, Hg) ....................................................................................................... 31
16 Figure 13: NS Power 10 Year Load and Resources Outlook...................................................................... 40
17 Figure 14: NS Power Major Facilities in Service 2020 .............................................................................. 41
18
DATE FILED: June 30, 2020 Page 4 of 582020 10-Year System Outlook
NON-CONFIDENTIAL
1 1.0 INTRODUCTION
2
3 In accordance with the 3.4.2.1 1 Market Rule requirements, this Report provides the 10-
4 Year System Outlook on behalf of the Nova Scotia Power System Operator (NSPSO) for
5 2020.
6
7 The 2020 10-Year System Outlook Report contains the following information:
8
9 • A summary of the Nova Scotia Power Incorporated (NS Power, Company) load
10 forecast and update on the Demand Side Management (DSM) forecast in Section
11 2.
12
13 • A summary of generation expansion anticipated for facilities owned by NS Power
14 and others in Sections 3-5. NS Power’s generation planning for existing Facilities,
15 including retirements as well as investments in upgrades, refurbishment or life
16 extension and new Generating Facilities committed in accordance with previously
17 approved NSPSO system plans.
18
19 • A summary of environmental and emissions regulatory requirements, as well as
20 forecast compliance in Section 6. This Section also includes projections of the
21 level of renewable energy available.
22
23 • A Resource Adequacy Assessment in Section 7.
24
25 • A discussion of transmission planning considerations in Section 8.
1
Nova Scotia Wholesale and Renewable to Retail Electricity Market Rules (as amended 2016 06 10), Market Rule
3.4.2 states, “The NSPSO system plan will address: (a) transmission investment planning; (b) DSM programs
operated by EfficiencyOne or others; (c) NS Power generation planning for existing Facilities, including retirements
as well as investments in upgrades, refurbishment or life extension; (d) new Generating Facilities committed in
accordance with previous approved NSPSO system plans; (e) new Generating Facilities planned by Market
Participants or Connection Applicants other than NS Power; and (f) requirements for additional DSM programs and
/ or generating capability (for energy or ancillary services).”
DATE FILED: June 30, 2020 Page 5 of 582020 10-Year System Outlook
NON-CONFIDENTIAL
1
2 • Identification of transmission-related capital projects currently in the
3 Transmission Development Plan in Section 9.
4
5 • A discussion of NS Power’s ongoing COVID-19 pandemic response in Section
6 10.
7
8 Since the 2018 10-Year System Outlook (10YSO) – Integrated Resource Plan (IRP)
9 Action Plan Update, and following the completion of the Generation Utilization and
10 Optimization process, in its letter dated October 5, 2018 2 the Nova Scotia Utility and
11 Review Board (NSUARB) directed NS Power to undertake an IRP process to be
12 completed in 2020 and outlined several pre-IRP analyses. NS Power has completed the
13 pre-IRP deliverables and is currently undertaking the IRP analysis including workshops
14 with interested participants and is on track to complete the IRP process in 2020.
15
16 As discussed in Section 7.4, the 2020 IRP will evaluate a robust set of future planning
17 scenarios, with modeling assumptions that were created with comprehensive stakeholder
18 input. The 2020 IRP will document capacity expansion/retirement modeling optimization
19 results and associated insights over a 25-year planning horizon (2021-2045).
20
21 As discussed in Section 10, NS Power continues to monitor the ongoing spread of
22 COVID-19 and remains focused on the health and safety of employees, consultants,
23 contractors, and their families. A response team is monitoring the situation, coordinating
24 with authorities, and keeping employees informed via regular business updates. The
25 economic effects of the COVID-19 pandemic and their impact on short and medium-term
26 system planning continue to be evaluated.
27
2
M08059, UARB letter, Generation Utilization and Optimization, October 5, 2018.
DATE FILED: June 30, 2020 Page 6 of 582020 10-Year System Outlook
NON-CONFIDENTIAL
1 2.0 LOAD FORECAST
2
3 The NS Power load forecast provides an outlook on the energy and peak demand
4 requirements of customers in the province. The load forecast forms the basis for fuel
5 supply planning, investment planning, and overall operating activities of NS Power. The
6 figures presented in this Report are the same as those filed with the NSUARB in the 2020
7 Load Forecast Report on May 6, 2020 and were developed using NS Power’s statistically
8 adjusted end-use (SAE) model to forecast the residential and commercial rate classes.
9 The residential and commercial SAE models are combined with an econometric-based
10 industrial forecast and customer-specific forecasts for NS Power’s large customers to
11 develop an energy forecast for the province, also referred to as the Net System
12 Requirement (NSR).
13
14 Figure 1 shows historical and forecast NSR which includes in-province energy sales plus
15 system losses. Anticipated growth is expected to be driven by increased electric heating
16 in the residential sector as well as industrial growth. This growth will be offset by DSM
17 initiatives and natural energy efficiency improvements outside of structured DSM
18 programs, as well as increased behind-the-meter small scale solar installations. The net
19 result of these inputs is an annual decline of 0.1 percent in NSR compared to a peak
20 demand forecast that remains flat.
DATE FILED: June 30, 2020 Page 7 of 582020 10-Year System Outlook
NON-CONFIDENTIAL
1 Figure 1: Net System Requirement with Future DSM Program Effects (actuals are
2 not weather adjusted)
NSR Growth
Year (GWh) (%)
2010 12,158 0.7
2011 11,907 -2.1
2012 10,475 -12.0
2013 11,194 6.9
2014 11,037 -1.4
2015 11,099 0.6
2016 10,809 -2.6
2017 10,873 0.6
2018 11,250 3.5
2019 11,077 -1.5
2020* 11,049 -0.3
2021* 11,081 0.3
2022* 11,134 0.5
2023* 11,176 0.4
2024* 11,228 0.5
2025* 11,185 -0.4
2026* 11,167 -0.2
2027* 11,124 -0.4
2028* 11,096 -0.2
2029* 11,015 -0.7
2030* 10,949 -0.6
3 *Forecast value
4
5 NS Power also forecasts the peak hourly demand for future years. The total system peak
6 is defined as the highest single hourly average demand experienced in a year. It includes
7 both firm and interruptible loads. Due to the weather-sensitive load component in Nova
8 Scotia, the total system peak occurs in the period from December through February.
DATE FILED: June 30, 2020 Page 8 of 582020 10-Year System Outlook
NON-CONFIDENTIAL
1 The peak demand forecast is developed using end-use energy forecasts combined with
2 peak-day weather conditions to generate monthly peak demand forecasts through an
3 estimated monthly peak demand regression model. The peak contribution from large
4 customer classes is calculated from historical coincident load factors for each of the rate
5 classes. AMI-enabled savings of 34 MW are included from 2022 onward. After
6 accounting for the effects of DSM savings, system peak is expected to remain essentially
7 flat on average over the forecast period.
8
9 Figure 2 shows the historical and forecast net system peak.
10
11 Figure 2: Coincident Peak Demand with Future DSM Program Effects
Interruptible Firm
Contribution Contribution
to Peak to Peak System Peak Growth
Year (MW) (MW) (MW) (%)
2010 295 1,820 2,114 1.0
2011 265 1,903 2,168 2.5
2012 141 1,740 1,882 -13.2
2013 136 1,897 2,033 8.0
2014 83 2,036 2,118 4.2
2015 141 1,874 2,015 -4.9
2016 98 2,013 2,111 4.8
2017 67 1,951 2,018 -4.4
2018 80 1,993 2,073 2.7
2019 111 1,949 2,060 -0.6
2020* 147 2,098 2,245 8.9
2021* 152 2,085 2,237 -0.3
2022* 159 2,053 2,212 -1.1
2023* 161 2,059 2,220 0.3
2024* 166 2,064 2,230 0.4
2025* 166 2,070 2,236 0.3
2026* 165 2,074 2,240 0.2
2027* 165 2,075 2,240 0.0
2028* 165 2,075 2,240 0.0
2029* 165 2,076 2,240 0.0
2030* 164 2,076 2,240 0.0
12 *Forecast value
DATE FILED: June 30, 2020 Page 9 of 582020 10-Year System Outlook
NON-CONFIDENTIAL
1 As with any forecast, there is a degree of uncertainty around actual future outcomes. In
2 electricity forecasting, much of this uncertainty is due to the impact of variations in
3 weather, energy efficiency program effectiveness, the health of the economy, government
4 policy regarding decarbonization, the impact of electrification, changes in large customer
5 loads, the number of electric appliances and end-use equipment installed, and changes in
6 technology.
7 Other assumptions, including Distributed Energy Resources, the impacts of electrification
8 to enable deep decarbonization, and nearer term effects such as the potential effect of the
9 COVID-19 pandemic on load, are factors being considered in the 2020 IRP.
DATE FILED: June 30, 2020 Page 10 of 582020 10-Year System Outlook
NON-CONFIDENTIAL
1 3.0 GENERATION RESOURCES
2
3 3.1 Existing Generation Resources
4
5 NS Power’s generation portfolio is composed of a mix of fuel and technology types that
6 include coal, petroleum coke, light and heavy oil, natural gas, biomass, wind, tidal and
7 hydro. In addition, NS Power purchases energy from Independent Power Producers
8 (IPPs) located in the province and imports power across the NS Power/NB Power intertie
9 and the Maritime Link. Since the implementation of the Renewable Electricity Standards
10 (RES) discussed in Section 6.1, an increased percentage of total energy is produced by
11 variable renewable resources such as wind. However, due to their intermittent nature,
12 these variable resources provide less firm capacity than conventional generation
13 resources. Therefore, the majority of the system requirement for firm capacity is met
14 with NS Power’s conventional units (e.g. coal, gas) while their energy output is being
15 displaced by renewable resources when they are producing energy. This is discussed
16 further in Section 3.3 below.
17
18 Figure 3 lists NS Power’s and IPPs’ verified and forecast firm generating capability for
19 generating stations/systems along with their fuel types up to the filing date of this Report.
20 The changes and additions over the 10 year period to this total capacity are shown in
21 Figure 13 in Section 7.4.
22
DATE FILED: June 30, 2020 Page 11 of 582020 10-Year System Outlook
NON-CONFIDENTIAL
1 Figure 3: 2020 Firm Generating Capability for NS Power and IPPs
Winter Net
Plant/System Fuel Type Capacity 3
(MW)
Avon Hydro 6.4
Black River Hydro 21.4
Lequille System Hydro 23.0
Bear River System Hydro 35.5
Tusket Hydro 2.3
Mersey System Hydro 40.4
St. Margaret’s Bay Hydro 10.3
Sheet Harbour Hydro 10.2
Dickie Brook Hydro 3.6
Wreck Cove Hydro 201.4
Annapolis Tidal 4 Hydro 0.0
Fall River Hydro 0.5
Total Hydro 354.9
Tufts Cove Heavy Fuel Oil/Natural Gas 318
Trenton Coal/Pet Coke/Heavy Fuel Oil 304
Point Tupper Coal/Pet Coke/Heavy Fuel Oil 150
Lingan Coal/Pet Coke/Heavy Fuel Oil 607
Coal/Pet Coke & Limestone
Point Aconi 168
Sorbent (CFB)
Total Steam 1547
Tufts Cove Units 4, 5 & 6 Natural Gas 144
Total Combined Cycle 144
Burnside Light Fuel Oil 132
Tusket 5 Light Fuel Oil 0
Victoria Junction 6 Light Fuel Oil 33
3
Wind and Hydro are Effective Load Carrying Capability (ELCC) values. Please refer to Section 7.3 for further
information.
4
Annapolis assumed to be out of service. Please refer to Section 3.2.3.
5
Tusket CT assumed to be in service by winter 2020-2021. Please refer to Section 3.2.1.
6
As the UARB declined approval of the VJ2 CT Capital Item, the asset has been removed from NS Power’s listing
of Firm Generating Capability. For the purposes of this Report the Company has not forecast the firm capacity
provided by VJ2 CT. Please refer to Section 3.2.2.
DATE FILED: June 30, 2020 Page 12 of 582020 10-Year System Outlook
NON-CONFIDENTIAL
Winter Net
Plant/System Fuel Type Capacity 3
(MW)
Total Combustion Turbine 165
Independent Power Producers
Pre-2001 Renewables 25.8
(IPPs)
Post-2001Renewables (firm) 7 IPPs 70.6
NS Power wind (firm) 7 Wind 15.3
Community Feed-in Tariff
IPPs 34.7
(firm)7
Total IPPs & Renewables 146.4
Total Capacity 2357
1
2 3.1.1 Maximum Unit Capacity Rating Adjustments
3
4 As a member of the Maritimes Area of the Northeast Power Coordinating Council
5 (NPCC), NS Power meets the requirement for generator capacity verification as outlined
6 in NPCC Regional Reliability Reference Directory #9, Generator Real Power
7 Verification. 8 Since 2016, there has been a staged transition from Directory #9 to the
8 requirements of NERC Standard MOD-025-2 Verification and Data Reporting of
9 Generator Real and Reactive Power Capability and Synchronous Condenser Reactive
10 Power Capability. NPCC Directory #9 was retired in October 2019 and NERC MOD-
11 025-2 will provide the ongoing criteria for generator verification and data reporting.
12
13 The Net Operating Capacity of the thermal units and large hydro units covered by the
14 NPCC criteria do not require adjustments at this point. NS Power will continue to refresh
15 unit maximum capacities in the 10-Year System Outlook each year as operational
16 conditions change.
17
7
Energy Resource Interconnection Service (ERIS) and Network Resource Interconnection Service (NRIS) wind
projects are assumed to have a firm capacity contribution of 19% as detailed in Section 7.3.1.
8
https://www.npcc.org/Standards/Directories/Forms/Public%20List.aspx
DATE FILED: June 30, 2020 Page 13 of 582020 10-Year System Outlook
NON-CONFIDENTIAL
1 3.1.2 Mersey Hydro
2
3 NS Power continues to assess options to address current concerns on the Mersey Hydro
4 System. Degradation of the powerhouses and water control structures after nearly a
5 century of service has necessitated the need for significant redevelopment work. The
6 Mersey Hydro System is an important part of NS Power’s hydro assets and is responsible
7 for approximately 25 percent of annual domestic hydroelectric production. The
8 Company is preparing a capital application for the redevelopment of the Mersey system
9 for filing with the NSUARB. Further, the 2020 IRP will conduct an economic screening
10 analysis of NS Power’s hydro assets, which will inform candidate economic retirement
11 options in the full IRP Model. This analysis includes the Mersey Hydro System.
12
13 3.1.3 Wreck Cove Hydro
14
15 Wreck Cove Hydro is an important asset for NS Power, providing critical and renewable
16 generation for peak demand periods. With the ability to quickly provide 212 MW of peak
17 capacity from two operating units and average annual generation of 300 GWh, Wreck
18 Cove is NS Power’s largest hydroelectric system. NS Power has submitted a capital
19 application to the NSUARB to perform Life Extension & Modernization (LEM) work for
20 the Wreck Cove Generating Station. 9 As part of the scope for the LEM Project, the two
21 unit turbines will be replaced with newly designed turbine runners which will have
22 increased efficiency and a wider operating range over the existing ones. While the change
23 in turbine runners will not change the peak capacity of 212 MW, it will provide a forecast
24 increase of 5 percent to the annual generation from Wreck Cove. If approved, this project
25 will bring the average annual generation at Wreck Cove to 315 GWh per year.
9
M09596, NS Power Wreck Cove Life Extension and Modernization – Unit Rehabilitation and Replacement, CI
13838, February 28, 2020.
DATE FILED: June 30, 2020 Page 14 of 582020 10-Year System Outlook
NON-CONFIDENTIAL
1 3.2 Changes in Capacity
2
3 Figure 4 provides the firm Supply and DSM capacity changes in accordance with the
4 assumption set developed for the 2020 IRP and the 2020 Load Forecast.
5
6 Figure 4: Firm Capacity Changes & DSM
New Resources 2020-2029 Net MW
DSM Peak reduction 298
Total Demand Side MW Change
298
Projected Over Planning Period
Biomass 43
Tusket CT return to service 33
Maritime Link Import - Base Block 153
Assumed Unit Retirements/Lay-ups 10 -148
Tidal Feed-in Tariff (Firm capacity) 2
Total Firm Supply MW Change
83
Projected Over Planning Period
7
8 3.2.1 Tusket Combustion Turbine
9
10 On September 13, 2019, the NSUARB issued its decision to approve the Tusket CT
11 replacement. 11 Based on this approval, Tusket CT capacity has been included in this
12 year’s 10-Year System Outlook Report. Tusket CT is expected back in service prior to
13 the end of 2020. As directed by the Board, the 2020 IRP is conducting further analysis on
14 NS Power’s diesel CTs.
10
Retirement of Lingan 2 unit once the Maritime Link Base Block provides firm capacity service.
11
M08812, NSUARB Tusket CT Generator Replacement Decision, CI 51526, September 13, 2019.
DATE FILED: June 30, 2020 Page 15 of 582020 10-Year System Outlook
NON-CONFIDENTIAL
1 3.2.2 Victoria Junction Combustion Turbine
2
3 On March 23, 2020, the NSUARB issued its decision 12 to decline approval of the capital
4 work related to VJ2 at this time. The NSUARB stated:
5
6 NS Power may re-apply following the completion of the review of
7 existing CT (oil) resources during the 2020 IRP proceeding or after a
8 comprehensive alternate analysis of all the Company’s oil CTs has been
9 completed.
10
11 Given that the NSUARB has not approved the capital work related to VJ2, for the
12 purposes of this Report, the Company has not forecast the firm capacity provided by VJ2
13 CT. Further analysis of NS Power’s diesel CTs will be undertaken during the 2020 IRP
14 process.
15
16 3.2.3 Annapolis Tidal
17
18 A critical component of the Annapolis Tidal facility has failed, and the site is now
19 offline. NS Power has been assessing the future options for this facility. Work to bring
20 the site online has been put on hold until a final decision related to the future of
21 Annapolis is reached. For the purposes of this report, NS Power has not assumed
22 capacity contribution from this facility.
12
M09560, UARB letter to NS Power re Approval of 2020 Capital Work Order (P-520), March 23, 2020
DATE FILED: June 30, 2020 Page 16 of 582020 10-Year System Outlook
NON-CONFIDENTIAL
1 3.3 Unit Utilization & Investment Strategy
2
3 The Company typically forecasts 10 years of utilization and investment projections in this
4 Report. There are many operational realities, such as the prices of fuel and power or
5 changes in policy, that could trigger a significant shift in the utilization forecast to
6 provide the most economic system dispatch for customers.
7
8 This utility utilization and investment strategy (UUIS) is a product of generation planning
9 and engineering integrating the latest in Asset Management methodology and generation
10 planning techniques in the service of a complex generation operation. It provides an
11 outlook for how NS Power will operate and invest in generation assets, recognizing the
12 trend toward lower utilization along with demands for flexible operation arising from
13 renewables integration, and will continue to be updated annually in the 10YSO in future.
14 As part of the 2020 IRP process, modeling assumptions have been developed in
15 consultation with interested parties. The UUIS analysis has been deferred to the IRP
16 which will be completed later this year.
17
18 3.3.1 Evolution of the Energy Mix in Nova Scotia
19
20 NS Power’s energy production mix has undergone significant changes over the last 15
21 years. Since the implementation of the Renewable Electricity Standards (RES), an
22 increased percentage of energy sales is produced by variable renewable resources such as
23 wind. However, due to their intermittent nature, variable resources provide less firm
24 capacity than conventional generation resources. Therefore, the majority of the system
25 requirement for firm capacity and other ancillary services is met with NS Power’s
26 conventional units (i.e. coal, gas, diesel, hydro) as discussed in Sections 3.1 and 3.2,
27 while the energy output of conventional units is being displaced by renewable resources.
28 Figure 5 below illustrates this change with the actual energy mix from 2005 and 2019 and
29 the 2019 10YSO forecast energy mix for 2021. The IRP process will provide further
30 guidance on the potential energy mix under the robust set of scenarios developed.
DATE FILED: June 30, 2020 Page 17 of 582020 10-Year System Outlook
NON-CONFIDENTIAL
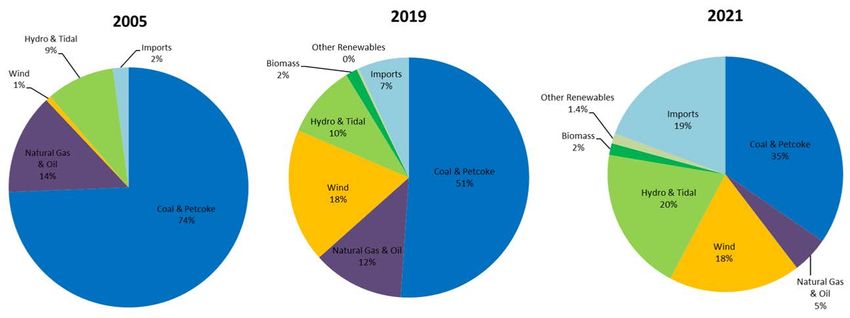
1 Figure 5 13: 2005, 2019 Actual, 2021 Forecast Energy Mix
2
3
4 As illustrated in Figure 6, NS Power’s firm peak demand has been increasing at a rate of
5 approximately 1 percent per year. After accounting for the effects of DSM savings, the
6 system peak is expected to remain essentially flat on average over the forecast period.
7 Future growth is expected to be mitigated through DSM, AMI-enabled peak reduction
8 strategies, and underlying efficiency improvements. While energy is increasingly being
9 produced by new renewable sources, the capacity required to serve system demand will
10 continue to be served by dispatchable conventional resources together with firm imports.
11 These resources also provide other critical services to the system such as load following.
13
Consistent with the provisions of the Renewable Electricity Regulations, in 2021 the category of Imports includes
ML Surplus energy while the category of Hydro includes ML NS Base Block and Supplemental Energy from the
Muskrat Falls hydro project.
DATE FILED: June 30, 2020 Page 18 of 582020 10-Year System Outlook
NON-CONFIDENTIAL
1 Figure 6: Peak System Demand Trend
2
3
4 3.3.2 Projections of Unit Utilization
5
6 NS Power typically prepares a 10-year forecast of projected unit utilization parameters
7 annually in this Report using the Plexos modeling tool and the current assumptions
8 regarding fuel and market prices, load forecast, system constraints, and generating
9 parameters; these assumptions change year over year and the Company adjusts its
10 utilization strategy accordingly.
11
12 The ongoing IRP will provide a more in-depth analysis on unit utilization and as such,
13 this Section will be deferred to the 2020 IRP Report which will be completed this year.
DATE FILED: June 30, 2020 Page 19 of 582020 10-Year System Outlook
NON-CONFIDENTIAL
1 3.3.3 Steam Fleet Retirement Outlook
2
3 In light of federal and provincial requirements for the province to lower its GHG
4 emissions, NS Power will need to decrease its reliance on fossil fuels energy sources. As
5 part of the 2018 Generation Utilization and Optimization process and the current IRP
6 process, NS Power is looking at its thermal fleet and considering retirements for
7 individual units.
8
9 As part of the 2020 IRP NS Power is analyzing updated retirement schedules and the
10 forecast major investment intervals for the units, as well as incorporating the conclusions
11 of the equivalency agreement negotiations for the Federal Coal-fired Generation of
12 Electricity Regulations (as noted in Section 6.3). In the interim, Lingan Unit 2 is planned
13 for retirement following the commencement of the delivery of the Nova Scotia Block of
14 energy and related firm capacity from the Muskrat Falls.
DATE FILED: June 30, 2020 Page 20 of 582020 10-Year System Outlook
NON-CONFIDENTIAL
1 4.0 NEW SUPPLY SIDE FACILITIES
2
3 As of June 17, 2020, NS Power has four Active Transmission Connected Interconnection
4 Requests (67.88 MW) and five Active Distribution Connected Interconnection Requests
5 (9.1 MW) at various stages of interconnection study. The Advanced Stage
6 Interconnection Request Queue is described in Section 5.
7
8 Proponents of transmission projects request Network Resource Interconnection Service
9 (NRIS) or Energy Resource Interconnection Service (ERIS). NRIS refers to a firm
10 transmission interconnection request with the potential requirement for transmission
11 reinforcement upon completion of the System Impact Study (SIS). ERIS refers to an
12 interconnection request for firm service only to the point where transmission
13 reinforcement would be required. Results of the transmission interconnection studies
14 assessing the transmission reinforcement required to support transmission projects will be
15 incorporated into future transmission plans.
16
17 Distribution projects do not receive an NRIS or ERIS designation.
DATE FILED: June 30, 2020 Page 21 of 582020 10-Year System Outlook
NON-CONFIDENTIAL
1 5.0 QUEUED SYSTEM IMPACT STUDIES
2
3 Figure 7 below provides the current combined Transmission and Distribution Advanced
4 State Interconnection Queue.
5
6 Figure 7: Combined Transmission & Distribution Advanced Stage Interconnection
7 Queue as of June 17, 2020
In-
Request
Service
Date Inter-
Queue MW MW date Service
IR# DD- County connection Type Status
Order Summer Winter DD- Type
MMM- Point
MMM-
YY
YY
27-Jul- 01-Sep- GIA
1-T 426 Richmond 45.0 45.0 47C Biomass NRIS
12 18 Executed
5-Dec- Cumberla 31-May- GIA
2-T 516 5.0 5.0 37N Tidal NRIS
14 nd 20 Executed
28-Jul- 31-Oct- GIA
3-T 540 Hants 14.1 14.1 17V Wind NRIS
16 23 Executed
26-Sep- Cumberla 01-Nov- GIA
4-T 542 3.78 3.78 37N Tidal NRIS
16 nd 21 Executed
19-Apr- 01-Sep- SIS
5-D 557 Halifax 5.6 5.6 CHP N/A
17 18 Complete
26-Jul- 31-May- GIA in
6-D 569 Digby 0.6 0.6 509V-302 Tidal N/A
19 21 Progress
21-May- Cumberla 15-Jun- GIA in
7-D 568 2.0 2.0 22N-404 Solar N/A
19 nd 21 Progress
16-Jan- 30-Nov- SIS in
8-D 566 Digby 0.7 0.7 509V-301 Tidal N/A
19 20 Progress
8
9 Active transmission and distribution requests not appearing in the Combined
10 Transmission & Distribution Advanced Stage Interconnection Request Queue are
11 considered to be at the initial queue stage, as they have not yet proceeded to the SIS stage
12 of the Generator Interconnection Procedures (GIP). Figure 7 above provides the location
13 and size of the generating facilities currently in the Combined T&D Advanced Stage
14 Interconnection Request Queue.
DATE FILED: June 30, 2020 Page 22 of 582020 10-Year System Outlook
NON-CONFIDENTIAL
1 The Port Hawkesbury Biomass generating unit (63.8 MW gross / 45 MW net output) is
2 presently an ERIS classified resource which will be converted to NRIS following the
3 system upgrades associated with Transmission Service Request 400 which is discussed
4 further is Section 5.1.
5
6 5.1 OATT Transmission Service Queue
7
8 As of June 22, 2020, as shown in Figure 8, there are three ongoing requests in the OATT
9 Transmission Queue and eight additional requests in respect of projects that are complete
10 and in service.
11
12 Figure 8: Requests in the OATT Transmission Queue
Requested Project
Date & Time of Project Project
Number Project In Service Size Status
Service Request Type Location
Date (MW)
4 TSR July 22, 2011 Point- NS-NB May 2019 330 System
Upgrades
400 to-Point
in Progress
5 TSR November 28, Point- NB – Jan 1, 2015 4 In Service
401 2013 to-Point Lunenburg
Co.
6 TSR November 28, Network Lunenburg Oct 1, 2015 0.4 In Service
402 2013 Co. (1.14)
7 TSR December 4, Point- NB – Oct 1, 2015 7 In Service
403 2013 to-Point Kings Co.
8 TSR December 4, Network Kings Co. Oct 1, 2015 1.25 In Service
404 2013 (2.63)
9 TSR March 27, 2015 Network Riverport Oct 1, 2015 0.56 In Service
405 NS
10 TSR April 27, 2015 Network Antigonish Oct 1, 2015 6.52 In Service
406 NS
DATE FILED: June 30, 2020 Page 23 of 582020 10-Year System Outlook
NON-CONFIDENTIAL
Requested Project
Date & Time of Project Project
Number Project In Service Size Status
Service Request Type Location
Date (MW)
11 TSR April 13, 2017 Point- Riverport June 1, 2017 3.0 In Service
407 to-Point NS
12 TSR April 13, 2017 Point- Antigonish June 1, 2017 20 In Service
408 to-Point
13 TSR January 17, Point- NB-NS Jan 1, 2025 800 SIS in
Progress
409 2020 to-Point
14 TSR February 10, Point- Woodbine- Jan 1, 2025 500 SIS in
Progress
410 2020 to-Point NS
1
2 The completion of system upgrades related to Transmission Service Request 400 requires
3 additional design work and subsequent procurement of materials.
4
5 Studies are being performed to determine the system upgrades necessary for TSR 409
6 and TSR 410.
DATE FILED: June 30, 2020 Page 24 of 582020 10-Year System Outlook
NON-CONFIDENTIAL
1 6.0 ENVIRONMENTAL AND EMISSIONS REGULATORY REQUIREMENTS
2
3 6.1 Renewable Electricity Requirements
4
5 The Nova Scotia Renewable Electricity Standards (RES) include a renewable energy
6 requirement for NS Power of 25 percent of energy sales in 2015, and 40 percent in 2020.
7
8 In addition to these requirements, Nova Scotia has a Community Feed-in-Tariff
9 (COMFIT) for projects which include community ownership that are connected to the
10 distribution system and Net Metering legislation for renewable projects. 14 The current
11 Net Metering program was initiated in July 2011, and implementation of the COMFIT
12 program occurred in September 2011.
13
14 On April 8, 2016 the Province amended the Renewable Electricity Regulations to allow
15 NS Power to include COMFIT projects in its RES compliance planning. It also amended
16 the Regulations to remove the “must-run” requirement of the Port Hawkesbury biomass
17 generating facility. 15
18
19 NS Power has complied with or exceeded the renewable electricity requirement in all
20 applicable years. From 2015 to 2019 the Company served 26.6 percent, 28 percent, 29
21 percent, 30 percent and 30 percent of sales, respectively, using qualifying renewable
22 energy sources. The RES target for 2020 would largely be met by the energy import
23 from the Muskrat Falls hydro project. On March 27, 2020 Nalcor Energy (Nalcor)
24 announced that it temporarily paused construction activities at the Muskrat Falls project
25 site in response to the COVID-19 pandemic. 16 Construction and commissioning of the
14
Effective December 18, 2015, the Electricity Act reduced the maximum nameplate capacity for Net Metering from
1,000 kW to 100 kW. Net metering applications submitted on or after December 18, 2015 are subject to the new
100 kW limit. The legislation also closed the COMFIT to new applications.
15
Renewable Electricity Regulations, made under Section 5 of the Electricity Act S.N.S. 2004, c. 25 O.I.C. 2010-
381 (effective October 12, 2010), N.S. Reg. 155/2010 as amended to O.I.C. 2020-147 (effective May 5, 2020), N.S.
Reg. 74/2020 s. 5(2A).
16
https://muskratfalls.nalcorenergy.com/march-27-2020-covid-19-update-from-nalcor-on-the-muskrat-falls-project/
DATE FILED: June 30, 2020 Page 25 of 582020 10-Year System Outlook
NON-CONFIDENTIAL
1 Muskrat Falls hydro project resumed on May 30, 2020. Nalcor has not provided an
2 updated construction schedule, however, given the risk of a delay in the delivery of the
3 Nova Scotia Block, the Province has permitted NS Power to address this through an
4 alternative compliance plan for 2020 through 2022 under the RES Regulations.
5
6 The RES Compliance Forecast in Figure 9 illustrates the full amount of RES-eligible
7 energy forecast to be available to the Company if the Nova Scotia Block energy flow
8 begins on January 1, 2021.
DATE FILED: June 30, 2020 Page 26 of 582020 10-Year System Outlook
NON-CONFIDENTIAL
1 Figure 9: RES Compliance Forecast
RES Compliance Forecast17
2021 2022 2023 2024
Energy Requirements (GWh)
NSR including DSM effects 11,081 11,134 11,176 11,228
Losses 742 749 747 750
Sales 10,339 10,385 10,429 10,478
RES (%) Requirement 40% 40% 40% 40%
RES Requirement (GWh) 4,136 4,154 4,172 4,191
Renewable Energy Sources (GWh)
NSPI Wind 259 259 259 259
Post 2001 IPPs 757 757 757 757
PH Biomass 290 290 290 290
COMFIT Wind Energy 534 534 534 534
COMFIT Non-Wind Energy 44 44 44 44
Eligible Pre 2001 IPPs 81 81 81 81
Eligible NSPI Legacy Hydro 935 935 935 935
REA procurement (South Canoe/Sable) 357 357 357 357
Compliant Renewable Imports 1,134* 1,134 1,134 1,134
Forecast Renewable Energy (GWh) 4,390 4,389 4,389 4,389
Forecast Surplus or Deficit (GWh) 255 235 218 198
Forecast RES Percentage of Sales 42% 42% 42% 42%
2 *This assumes the full year of Maritime Link energy flow.
17
NSR and Losses are from the 2020 NS Power 10 Year Energy and Demand Forecast, M09707, Exhibit N-1, Table
A-1, May 6, 2020.
DATE FILED: June 30, 2020 Page 27 of 582020 10-Year System Outlook
NON-CONFIDENTIAL
1 6.2 Environmental Regulatory Requirements
2
3 The Nova Scotia Greenhouse Gas Emissions Regulations 18 specify emission caps for
4 2010-2030, as outlined in Figure 10. The net result is a hard cap reduction from 10.0 to
5 4.5 million tonnes over that 20-year period, which represents a 55 percent reduction in
6 CO2 release over 20 years. Carbon emissions in Nova Scotia from the production of
7 electricity in 2030 are forecast to have decreased by 58 percent from 2005 levels.
8
9 Figure 10: Multi-year Greenhouse Gas Emission Limits
Year GHG Cumulative Million
tonnes
2014-2016 26.32
2017-2019 24.06
2020 7.5 (annual)
2021-2024 27.5
2025 6 (annual)
2026-2029 21.5
2030 4.5 (annual)
10
11 The Sustainable Development Goals Act 19 states Nova Scotia’s goals to achieve
12 province-wide greenhouse gas emission reductions of at least 10 percent below levels
13 emitted in 1990 by 2020, at least 33 percent below the levels that were emitted in 2005 by
14 2030, and a “net zero” by 2050 by balancing greenhouse gas emissions with greenhouse
15 gas removals and other offsetting measures.
18
Greenhouse Gas Emissions Regulations made under subsection 28(6) and Section 112 of the Environment Act
S.N.S. 1994-95, c. 1, O.I.C. 2009-341 (August 14, 2009), N.S. Reg. 260/2009 as amended to O.I.C. 2013-332
(September 10, 2013), N.S. Reg. 305/2013.
19
An Act to Achieve Environmental Goals and Sustainable Prosperity, S.N.S. 2019, c. 26, not proclaimed in force.
DATE FILED: June 30, 2020 Page 28 of 582020 10-Year System Outlook
NON-CONFIDENTIAL
1 On January 1, 2019 Nova Scotia’s cap-and-trade program came into effect. The Cap-and-
2 Trade Program Regulations include the annual free allowances for GHG emissions for
3 NS Power.
4
5 Under the GHG cap-and-trade system NS Power is allowed to purchase only 5 percent of
6 GHG credits which will be put up for auction by the province. Nova Scotia Power is
7 forecasting that the GHG credits available for the company to purchase will be
8 approximately 0.1 Mt annually. Although bilateral GHG trades among participants are
9 permitted, NS Power does not anticipate being able to trade significant amounts of GHG
10 credits with other participants. Due to limited GHG credit purchase opportunities, GHG
11 credit purchase will not be the primary means of GHG compliance. The primary means
12 of meeting the caps is a reduction in thermal generation from the existing coal-fired
13 generating units, replaced by non-emitting energy.
14
15 Although the free GHG allowance under the GHG cap-and-trade system was specified
16 for each year from 2019 to 2022 as noted in Figure 11, the allowances can be
17 redistributed in a four-year compliance period between 2019 and 2022 in order to reduce
18 the cost of compliance. NS Power is forecasting GHG release over the GHG cap-and-
19 trade free allowance allocation for 2019 and 2020, and GHG release under the free GHG
20 allocation in 2021 and 2022, as the lowest cost of compliance.
21
22 Figure 11: Greenhouse Gas Free Allowances 2019-2022
Year GHG Free Allowances
Million tonnes
2019 6.334
2020 5.517
2021 5.120
2022 5.087
DATE FILED: June 30, 2020 Page 29 of 582020 10-Year System Outlook
NON-CONFIDENTIAL
1 NS Power thermal facilities that meet the CO2 emissions threshold for cap-and-trade
2 (50,000 tonnes) are not required to pay fuel surcharges on fuel consumed for electricity
3 generation. Fuel consumed for on-site activities via mobile equipment is subject to a fuel
4 surcharge under the Cap-and-Trade Regulations.
5
6 As the Port Hawkesbury Biomass facility and the combustion turbine sites do not meet
7 the emissions threshold, fuel consumed on those sites will be subject to fuel surcharges
8 under the Cap and Trade Regulations.
9
10 The Nova Scotia Air Quality Regulations 20 specify emission caps for sulphur dioxide
11 (SO2), nitrogen oxides (NOX), and mercury (Hg). These regulations were amended to
12 extend from 2020 to 2030, effective January 1, 2015. The amended regulations replaced
13 annual limits with multi-year caps for the emissions targets for SO2 and NOX.
14
15 The province introduced amendments to the Air Quality Regulations respecting the SO2
16 cap for a three-year period from 2020 to 2022, effective January 21, 2020. The
17 regulations also provide local annual maximums, as well as limits on individual coal units
18 for SO2. The revised emissions requirements are shown below in Figure 12.
20
Air Quality Regulations made under Sections 25 and 112 of the Environment Act S.N.S. 1994-95, c. 1 O.I.C.
2005-87 (February 25, 2005, effective March 1, 2005), N.S. Reg. 28/2005 as amended to O.I.C. 2020-016 (effective
January 21, 2020), N.S. Reg. 8/2020.
DATE FILED: June 30, 2020 Page 30 of 582020 10-Year System Outlook
NON-CONFIDENTIAL
1 Figure 12: Emissions (SO2, NOx, Hg)
Multi-Year
SO2 (t) SO2 (t) NOX (t) NOx (t) Hg (kg)
Caps Period
Annual Max Annual Max
2020 60,900 35
14,955
2021-2022 90,000 14,955 35
68,000 35
2023-2024 56,000
2025 28,000 11,500 35
28,000 11,500 35
2026 – 2029 104,000 44,000
2030 20,000 8,800 30
2
3 By 2030, SO2 emissions from generating electricity will have been reduced by 80 percent
4 from 2005 levels. NOX emissions will have decreased by 73 percent and mercury
5 emissions will have decreased 71 percent from 2005 levels.
6
7 SO2 reductions are being addressed mainly by reduced thermal generation and changes to
8 fuel blends. NOX reductions are being addressed through reductions in thermal
9 generation and the previous installation of Low NOX Combustion Firing Systems.
10 Mercury reductions are being accomplished through reduced thermal generation, changed
11 fuel blends and the use of Powder Activated Carbon systems. NS Power offered a
12 mercury recovery program, such as recycling light bulbs or other mercury-containing
13 consumer products, which reduced the amount of mercury going into the environment
14 through landfills. The amount of mercury diverted in 2019 resulted in the total amount of
15 credits exceeding the credit target for the program; therefore, NS Power is no longer
16 funding the program as of January 31, 2020. Credits approved by Nova Scotia
17 Environment (NSE) may be used to compensate from the deferred emissions by 2020,
18 and a limited amount of credits approved by NSE (30 kg in 2020, 10 kg per year for
19 subsequent years) may be used for compliance from 2020 to 2029.
DATE FILED: June 30, 2020 Page 31 of 582020 10-Year System Outlook
NON-CONFIDENTIAL
1 6.3 Upcoming Policy Changes
2
3 Until the federal coal phase-out policy changes announced in the fall of 2016, 21 NS
4 Power’s operation of and planning for its coal-fired generation units proceeded consistent
5 with the provisions of the Agreement on Equivalency of Federal and Nova Scotia
6 Regulations for the Control of Greenhouse Gas Emissions from Electricity Producers in
7 Nova Scotia (the Equivalency Agreement). The Equivalency Agreement was finalized in
8 May 2014, and effective starting July 2015, contemporaneous with the effective date for
9 the current federal Reduction of Carbon Dioxide Emissions from Coal-Fired Generation
10 of Electricity Regulations.
11
12 In November 2016, the Province of Nova Scotia announced that an agreement-in-
13 principle had been reached with the Government of Canada to develop a new equivalency
14 agreement that will enable the province to move directly from fossil fuels to clean energy
15 sources while allowing Nova Scotia's coal-fired plants to operate at some capacity
16 beyond 2030. The need for this new agreement was driven by amendments proposed by
17 the Federal Government to the Reduction of Carbon Dioxide Emissions from Coal-fired
18 Generation of Electricity Regulations. 22 On March 30, 2019 the Renewal of this
19 Equivalency Agreement was published in Canada Gazette I. In the Renewal of the
20 existing Equivalency Agreement, a Quantitative Analysis for the period to 2040 was
21 examined, which has formed the basis for the second Equivalency Agreement. A range of
22 coal closure dates and GHG trajectories is being examined through the Company’s 2020
23 IRP.
21
https://www.canada.ca/en/environment-climate-change/news/2017/11/taking_action_tophase-outcoalpower.html
22
Vol. 152, No. 7 Canada Gazette Part I Ottawa, Saturday, February 17, 2018.
DATE FILED: June 30, 2020 Page 32 of 582020 10-Year System Outlook
NON-CONFIDENTIAL
1 7.0 RESOURCE ADEQUACY
2
3 7.1 Operating Reserve Criteria
4
5 Operating Reserves are resources which can be called upon by system operators on short
6 notice to respond to the unplanned loss of generation or imports. These assets are
7 essential to the reliability of the power system.
8
9 As a member of the Maritimes Area of NPCC, NS Power meets the operating reserve
10 requirements as outlined in NPCC Regional Reliability Reference Directory #5, Reserve.
11 These Criteria are reviewed and adjusted periodically by NPCC and subject to approval
12 by the NSUARB. The Criteria require that:
13
14 Each Balancing Authority shall have ten-minute reserve available that is at
15 least equal to its first contingency loss…and,
16
17 Each Balancing Authority shall have thirty-minute reserve available that is
18 at least equal to one half its second contingency loss. 23
19
20 In the Interconnection Agreement between Nova Scotia Power Incorporated and New
21 Brunswick System Operator (NBSO), 24 NS Power and New Brunswick Power (NB
22 Power) have agreed to share the reserve requirement for the Maritimes Area on the
23 following basis:
24
25 The Ten-Minute Reserve Responsibility, for contingencies within the
26 Maritimes Area, will be shared between the two Parties based on a 12CP
27 [coincident peak] Load-Ratio Share… Notwithstanding the Load-Ratio
28 Share the maximum that either Party will be responsible for is 100 percent
29 of its greatest, on-line, net single contingency, and, NSPI shall be
30 responsible for 50 MW of Thirty-Minute Reserve.
23
https://www.npcc.org/Standards/Directories/Forms/Public%20List.aspx
24
New Brunswick's Electricity Act (the Act) was proclaimed on October 1, 2013. Among other things, the Act
establishes the amalgamation of the New Brunswick System Operator (NBSO) with New Brunswick Power
Corporation ("NB Power").
DATE FILED: June 30, 2020 Page 33 of 582020 10-Year System Outlook
NON-CONFIDENTIAL
1
2 The Ten-Minute Reserve Responsibility formula results in a reserve share of
3 approximately 40 percent of the largest loss-of-source contingency in the Maritimes Area
4 (limited to 10 percent of Maritimes Area coincident peak load). This yields a reserve
5 share requirement for NS Power of approximately 40 percent of 550 MW, or 220 MW,
6 capped at the largest on-line unit in Nova Scotia. When Point Aconi is online, NS Power
7 maintains a ten-minute operating reserve of 168 MW (equivalent to Point Aconi net
8 output), of which approximately 33 MW is held as spinning reserve on the system.
9 Additional regulating reserve is maintained to manage the variability of customer load
10 and generation. The reserve sharing requirement with Maritime Link as the largest
11 source in Nova Scotia will depend on the amount of Maritime Link power used in Nova
12 Scotia.
13
14 7.2 Planning Reserve Criteria
15
16 The Planning Reserve Margin (PRM) is intended to maintain sufficient resources to serve
17 firm customers. Unit forced outages, higher than forecast demand, and lower than
18 forecast wind generation are all conditions that could individually or collectively
19 contribute to a shortfall of dispatchable capacity resources to meet customer demand.
20
21 NS Power is required to comply with the NPCC reliability criteria that have been
22 approved by the NSUARB. These criteria are outlined in NPCC Regional Reliability
23 Reference Directory #1 – Design and Operation of the Bulk Power System 25 which states:
24
25 Each Planning Coordinator or Resource Planner shall probabilistically
26 evaluate resource adequacy of its Planning Coordinator Area portion of the
27 bulk power system to demonstrate that the loss of load expectation
28 (LOLE) of disconnecting firm load due to resource deficiencies is, on
29 average, no more than 0.1 days per year. [This evaluation shall] make due
30 allowances for demand uncertainty, scheduled outages and deratings,
25
https://www.npcc.org/Standards/Directories/Forms/Public%20List.aspx
DATE FILED: June 30, 2020 Page 34 of 582020 10-Year System Outlook
NON-CONFIDENTIAL
1 forced outages and deratings, assistance over interconnections with
2 neighboring Planning Coordinator Areas, transmission transfer
3 capabilities, and capacity and/or load relief from available operating
4 procedures.
5
6 The PRM is a long-term planning assumption that is typically updated as part of an IRP
7 process. As part of the pre-IRP study, NS Power engaged Energy+Environmental
8 Economics Consulting, LLC (E3) to undertake a PRM and capacity value study. The
9 study found that in order to meet a 0.1 days/year loss of load expectation (LOLE) target
10 and comply with the NPCC reliability requirements, NS Power should maintain a PRM
11 between 17.8 percent and 21 percent. 26 The range in target PRM is due to a higher and
12 lower estimate of operating reserve (OR) requirements for the NS Power system. NS
13 Power is studying the appropriate calculation of its PRM as part of the 2020 IRP. For the
14 purposes of this Report, NS Power has continued to use a 20 percent PRM.
15
16 The PRM provides a basis for the minimum required firm generation NS Power must
17 plan to maintain to comply with NPCC reliability criteria; it does not represent the
18 optimal or maximum required capacity to serve other system requirements such as load-
19 following (ramping capability) and emissions compliance. The optimal capacity
20 requirement is determined through a long-term planning exercise such as the on-going
21 IRP, as discussed in Section 7.4 below.
26
M08929, Energy + Environmental Economics, Planning Reserve Margin and Capacity Value Study for Nova
Scotia Power Inc. July 2019 found as Attachment 17 to NS Power’s Pre-IRP Deliverables Report located at
https://irp.nspower.ca/documents/pre-irp-deliverables/.
DATE FILED: June 30, 2020 Page 35 of 582020 10-Year System Outlook
NON-CONFIDENTIAL
1 7.3 Capacity Contribution of Renewable Resources in Nova Scotia
2
3 Due to their variability, renewable energy resources (such as wind and solar) are not
4 always available to contribute during peak demand hours. The Effective Load Carrying
5 Capability (ELCC), or “capacity value” of a resource represents the statistical likelihood
6 that it will be available to serve the firm peak demand, and as a result, what percentage of
7 its capacity can be counted on as firm for system planning. Loss of Load Expectation
8 (LOLE) studies are the industry standard used to calculate the ELCC or capacity value of
9 these renewable resources.
10
11 By letter dated October 5, 2018 27 the NSUARB directed NS Power to complete a number
12 of pre-IRP analyses by July 31, 2019. One of the pre-IRP deliverables directed by the
13 NSUARB was a Capacity Study to calculate the ELCC of wind and other renewable
14 energy generators, both for the existing wind resources as well as potential new
15 resources. The study was undertaken by E3 28 on behalf of NS Power and the results
16 determined the average ELCC of the wind currently installed on the NS Power system to
17 be 19 percent. The declining marginal ELCC value of adding new wind the NS Power
18 system was determined to be 11 to 9 percent. NS Power has used the 19 percent capacity
19 value of wind for the purposes of this year’s Report and will use these updated values in
20 the system capacity forecast in future 10-Year System Outlook Reports.
21
22 Please refer to Section 7.3.1 regarding the inclusion of ERIS wind resources.
23
24 Municipal load for Berwick, Mahone Bay, Antigonish and Riverport is served by a wind
25 farm owned by Alternative Resource Energy Authority (AREA) and by imports. This
27
M08059, UARB Decision Letter, Generation Utilization and Optimization, October 5, 2018.
28
M08929, Integrated Resource Planning and Generation Utilization and Optimization (P-884)
Energy+Environmental Economics, Planning Reserve Margin and Capacity Value Study, July 2019, Attachment 18
to NS Power’s Pre-IRP Final Report at https://irp.nspower.ca/documents/pre-irp-deliverables/
DATE FILED: June 30, 2020 Page 36 of 58You can also read